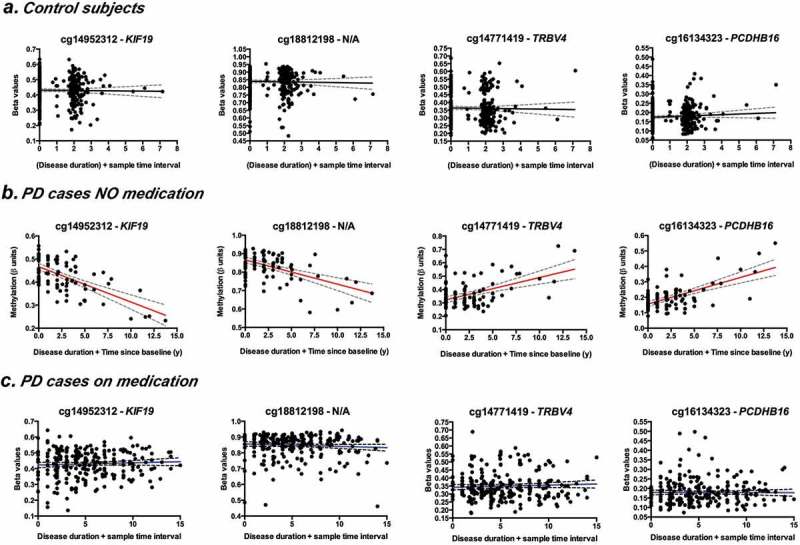
Figure 5.

Longitudinal changes in the blood methylome associated with PD progression are compensated by PD medication. Representative plots showing regression of methylation (individual β-values) as a function of disease duration and time between baseline and follow-up samples. Comparison of top changing probes between controls (a); PD cases NOT receiving medication (b) and PD cases on medication (c). Coefficient of change as determined by mixed linear models (Tables 5 and 6) and corresponding p-values are indicated.
