

ABSTRACT
Changes in DNA methylation may be a potential mechanism that mediates the effects of smoking on physiological function and subsequent disease risk. Given the dynamic nature of the epigenome, longitudinal studies are indispensable for investigating smoking-induced methylation changes over time. Using blood samples collected approximately five years apart in 380 African Americans (mean age 60.7 years) from the Genetic Epidemiology Network of Arteriopathy (GENOA) study, we measured DNA methylation levels using Illumina HumanMethylation BeadChips. We evaluated the association between Phase 1 smoking status and rate of methylation change, using generalized estimating equation models. Among the 6958 CpG sites examined, smoking status was associated with methylation change for 22 CpGs (false discovery rate q < 0.1), with the majority (91%) becoming less methylated over time. Methylation change was greater in ever smokers than never smokers, and the absolute differences in rates of change ranged from 0.18 to 0.77 per decade in M value, equivalent to a value change of 0.013 to 0.047 per decade. Significant enrichment was observed for CpG islands, enhancers, and DNAse hypersensitivity sites (p < 0.05). Although biological pathway analyses were not significant, most of the 22 CpGs were within genes known to be associated with cardiovascular disease, cancers, and aging. In conclusion, we identified epigenetic signatures for cigarette smoking that may have been missed in cross-sectional analyses, providing insight into the epigenetic effect of smoking and highlighting the importance of longitudinal analysis in understanding the dynamic human epigenome.
KEYWORDS: Smoking, DNA methylation, epigenome-wide association study, longitudinal analysis
Introduction
Cigarette smoking is a leading cause of morbidity and mortality worldwide. It is recognized as a major risk factor for several diseases including cancers, cardiovascular diseases, and chronic obstructive pulmonary disease (COPD) [1]. However, the molecular and cellular pathways by which smoking causes damage to organ systems have not been fully elucidated. Epigenetic modifications, including DNA methylation, are hypothesized to mediate the deleterious effects of environmental exposures on physiological function and disease risks [2].
To date, extensive research has revealed a considerable number of smoking-related signatures in the human epigenome. A systematic review published in 2015 showed that a total of 1,460 smoking-related CpGs have been identified in blood from 14 epigenome-wide association studies (EWAS) conducted primarily with European and African ancestry samples, of which 62 were detected in at least 3 studies [3]. Moreover, the largest meta-analysis to date, which consisted of 15,907 participants of European and African ancestries whose methylation was measured on DNA extracted from whole blood, CD4+ T cells, or monocytes, reported 2,623 CpGs that were differentially methylated between current smokers and never smokers (p < 1 × 10⁻⁷) [4]. In one of the largest EWAS in populations of Asian ancestry (596 Chinese adults), 318 CpGs were found to be associated with smoking, 157 of which overlapped with findings from European and African populations [5]. Smoking-associated methylation patterns are also associated with cancer and cardiovascular mortality [6,7]. Just as the hazardous effects of tobacco smoking can persist after smoking cessation [8,9], smoking-induced epigenetic changes including altered methylation and gene expression levels may also persist for decades after cessation [10–12].
Unlike the DNA sequence, the epigenome is dynamic over the life course. However, most existing epigenome-wide association studies are cross-sectional, and are therefore only able to examine inter-individual differences in methylation levels across smoking groups. Methylation level is influenced by environmental factors as well as genetic factors; therefore, unobserved confounders that have not been well controlled in cross-sectional studies may lead to biased results. In addition, cross-sectional studies are unable to evaluate intra-individual methylation change over time. Given the dynamic nature of epigenome, longitudinal studies that make use of multiple time points are being increasingly recognized as the most suitable approach for analyzing the epigenetics of common complex diseases [13]. Since 2010, efforts have been made to characterize DNA methylation change at more than one time point in longitudinal cohorts, although they have mainly focused on candidate genes and/or have had a relatively small sample size [14]. These studies have reported significant longitudinal intra-individual methylation changes in peripheral blood or buccal cells for both childhood [14,15] and adulthood [16] within genes involved in inflammation, aging, and human cancers.
More recently, researchers have started to investigate epigenome-wide methylation changes over time. For example, one longitudinal analysis in an elderly European population (N = 499) measured DNA methylation in blood at two time points and found that 31,252 CpGs significantly changed over a 9-year time span, and that the change rate of 76 CpGs were strongly associated with mortality [17]. Another study using whole blood samples identified CpGs with significant longitudinal changes within the first two years of life in 105 African American children, including CpGs located in genes related to inflammation [18]. In terms of smoking-related longitudinal analysis on methylation, to our knowledge, only one study has analyzed repeated measures of blood methylation using commercially-available microarray technology [19]. This study investigated the effect of continued smoking and cessation on longitudinal methylation change in a European population (N = 1,344); however, their analysis was restricted to CpGs that showed significant cross-sectional association with smoking at baseline. They found that only half of the tested CpGs showed the same direction for cross-sectional effect and longitudinal effects comparing current smokers to never smokers. Another recent work also showed that cross-sectional differences may not necessarily be consistent with longitudinal change [17], potentially due to unadjusted internal confounding, different mechanisms of regulation in response to environmental exposures, and differences in statistical power. In light of this, some true associations between smoking and DNA methylation may have been missed in longitudinal analyses that are limited to CpG sites that show association with smoking in cross-sectional analysis.
In this study, we investigate epigenome-wide DNA methylation changes in peripheral blood leukocytes over 5 years in 380 African American participants from the Genetic Epidemiology Network of Arteriopathy (GENOA) study to identify CpG sites with change rates that differ by smoking status. Findings from this study can improve our understanding of the underlying mechanisms of smoking effects on human health and disease.
Results
Sample characteristics
Sample characteristics at Phase 1 are summarized in Table 1. In the 380 subjects, age at Phase 1 ranged from 34 to 91 years (mean = 61), and 29% were male. A total of 70 subjects (18.4%) were current smokers, 95 subjects (25.0%) were former smokers, and 215 (56.6%) were never smokers. The distribution of age was significantly different across three smoking groups (p = 0.02), but not significant between ever smokers and never smokers (p = 0.85). Males were more likely to smoke than females (p = 4.7 × 10⁻¹²). Current smokers had the lowest mean BMI while never smokers had the highest (p = 1.0 × 10⁻⁵). Participants who sometimes drink alcoholic beverages were more likely to smoke than those who never drink (p = 7.9 × 10⁻⁹). The prevalence of hypertension and diabetes was not significantly different across smoking groups (p = 0.23 and p = 0.06, respectively). The average dosage of smoking (pack-years) was not significantly different between current and former smokers in this cohort (p = 0.1). Sample characteristics at Phase 2 are provided in the supplementary files (Table S1). From Phase 1 to Phase 2, 24 current smokers became former smokers and one former smoker became a current smoker.
Table 1.
Study participant characteristics at Phase 1 by smoking statusa.
| All subjects (N = 380) |
Ever smokers |
Never smokers (N = 215) |
P valueb (three groups) |
P valuec (ever vs. never smokers) |
||
|---|---|---|---|---|---|---|
| Current smokers (N = 70) |
Former smokers (N = 95) |
|||||
| Age (years) | 60.7 (7.7) | 58.7 (7.8) | 62.1 (7.9) | 60.8 (7.5) | 0.02 | 0.85 |
| Male, N (%) | 109 (29%) | 38 (54%) | 40 (42%) | 31 (14%) | 4.7E-12 | 5.1E-12 |
| BMI (kg/m2) | 30.6 (6.0) | 27.6 (5.2) | 30.9 (5.9) | 31.5 (6.1) | 1.0E-05 | 0.001 |
| Alcohol consumption, N (%)d | 128 (34%) | 44 (63%) | 34 (36%) | 50 (23%) | 7.9E-09 | 1.6E-06 |
| Hypertension, N (%) | 290 (76%) | 48 (69%) | 75 (79%) | 167 (78%) | 0.23 | 0.56 |
| Diabetes, N (%) | 78 (21%) | 8 (11%) | 25 (26%) | 45 (21%) | 0.06 | 0.92 |
| Pack-yearse | 27.4 (21.2) | 30.4 (17.1) | 25.2 (23.6) | - | 0.10 | - |
aResults are reported as means (standard deviations), or counts (proportions).
bP-values for continuous variables were calculated using ANOVA F test and for categorical variables using chi-square test, comparing across three smoking groups.
cP-values for continuous variables were calculated using T test and for categorical variables using chi-square test, comparing ever smokers vs. never smokers.
dParticipants who reported alcohol consumption are those who described themselves as a person who sometimes drinks alcoholic beverages rather than never.
eTwo current smokers and one former smoker had missing values for pack-years.
Performance of methylation harmonization
The quality control (QC) and pipeline harmonization pipeline for the methylation data is shown in Figure S1. Before harmonization, the first principal component, which explained 36% of the total variance in the combined methylation data, captured the platform difference between 27K and 450K data (Figure S2-A). After harmonization, the platform difference was removed (Figure S2-B). The inter-individual correlations in the nine cross-platform replicates (with 27K and 450K data at Phase 2) ranged from −0.895 to 0.998 (median = 0.259, mean = 0.240) in the 23,202 harmonized CpGs, while the randomly selected cross-platform pairs had a normal distribution with a mean of approximately zero (Figure S3-A). The intra-individual correlations in the cross-platform replicates ranged from 0.996 to 0.998 (median = 0.997), while the correlations in 400 random pairs ranged from 0.980 to 0.996 (median = 0.992) (Figure S3-B). Only probes with inter-individual correlation across the nine cross-platform replicates ≥0.5 (N = 7360 probes) and that met further QC procedures (see Methods) were included in our analysis (final N = 6958 probes).
Methylation change over time
The time window between the Phase 1 and Phase 2 exams among the 380 participants ranged from 3.0 to 7.5 years, with mean (standard deviation) = 4.9 (1.0). The distributions of mean methylation level at Phase 1 and mean methylation change rate for the 6958 CpGs are shown in Figure S4. Among the 6958 CpG sites, 4467 (64.2%) had mean M value less than 0 at Phase 1 (percent methylation<50%). Mean methylation change rates ranged from −0.38 to 0.26 (M value/decade), and for 4155 (59.7%) CpGs the mean change rate was less than 0.
Smoking effect on methylation change over time
We first compared methylation change rate between current smokers (N = 70) and never smokers (N = 215). Remarkable deviation from the null line in the QQ plot was observed (Figure S5-A), and 536 CpGs showed p-value () < 0.05, with the lowest p = 4.6 × 10⁻⁵. However, after correction for multiple testing, no CpGs remained significant under the threshold of FDR q < 0.1. Considering that no significant difference in methylation change rate was observed between current smokers and former smokers in our data (Figure S5-B, all FDR q > 0.1), we next combined participants in the two groups as ever smokers (N = 165), and compared them with never smokers. After multiple testing correction, 22 CpG sites showed significantly different change rates with FDR q < 0.1 for . A more stringent threshold at FDR q < 0.05 would have yielded 10 CpG sites. As shown in Table 2, the majority of the 22 significant sites at q < 0.1 had relatively low methylation levels at Phase 1 (M values<0, percent methylation<50%), while three (cg03533058, cg03760483, and cg18133966) were relatively highly methylated (M values>0, percent methylation>50%). No significant difference in Phase 1 methylation level was observed between ever smokers and never smokers for any of the 22 CpGs ( p > 0.05). With the exception of three CpGs (cg03760483, cg18133966, and cg17906786) for which significant change was not observed in never smokers, all of the other 19 CpGs significantly changed between the two phases in both ever smokers and never smokers (p < 0.05). The majority of the 19 CpGs that changed between the phases decreased over time (< 0 for never smokers, and < 0 for ever smokers), while cg03533058 increased (> 0 for never smokers, and > 0 for ever smokers). It is noteworthy that and for all of the significant CpGs were in the same direction except for cg17906786, indicating that smoking is associated with accelerated change rates at these sites. For example, as shown by the predicted trajectory of methylation at cg00030047 (Figure 1(a)), methylation decreased over 5 years for both ever smokers and never smokers, but decreased much faster in ever smokers. Similarly in Figure 1(b), cg03533058 methylation increased at a faster rate in ever smokers than never smokers. The absolute difference in rates of change in M value between ever smokers and never smokers ranged from 0.18 to 0.77 per decade, equivalent to a β value change of 0.013 to 0.047 per decade. At Phase 2, significant differences in methylation level between ever and never smokers were observed for 16 of 22 CpGs (p values<0.05, Table S2).
Table 2.
Statistically significant CpG sites whose methylation change rate was associated with ever-smoker vs. never-smoker status ( FDR q < 0.1)a.
| CpG | Gene | µ () | FDR q for | b | ||||
|---|---|---|---|---|---|---|---|---|
| cg00030047 | RNF207 | −1.33 (0.03) | 0.047 (0.35) | −0.27 (1.4E-04) | −0.32 (1.1E-05) | −0.59 (3.2E-11) | 0.036 | −0.37 (3.1E-04) |
| cg21494776 | ICAM4 | −1.60 (0.04) | 0.028 (0.65) | −0.44 (2.3E-06) | −0.43 (1.5E-05) | −0.87 (3.0E-12) | 0.036 | −0.37 (0.003) |
| cg16638540 | ZNF135 | −1.55 (0.04) | 0.070 (0.21) | −0.27 (0.001) | −0.41 (1.8E-05) | −0.68 (8.1E-10) | 0.036 | −0.35 (0.007) |
| cg08675664 | ALDH7A1 | −3.53 (0.03) | 0.091 (0.06) | −0.23 (0.001) | −0.37 (2.3E-05) | −0.59 (4.7E-09) | 0.036 | −0.41 (4.5E-04) |
| cg10549973 | TOMM20L | −3.73 (0.05) | 0.096 (0.26) | −0.44 (6.7E-04) | −0.64 (2.6E-05) | −1.08 (2.9E-09) | 0.036 | −0.67 (9.3E-04) |
| cg03533058 | NR4A1 | 3.21 (0.03) | −0.054 (0.14) | 0.22 (0.001) | 0.34 (3.1E-05) | 0.57 (2.7E-10) | 0.036 | 0.43 (2.4E-04) |
| cg04597449 | GPR150 | −2.35 (0.04) | 0.075 (0.18) | −0.44 (2.0E-07) | −0.35 (4.1E-05) | −0.79 (6.4E-16) | 0.041 | −0.43 (2.0E-04) |
| cg03760483 | ALOX12 | 0.67 (0.04) | 0.104 (0.10) | −0.07 (0.31) | −0.25 (5.3E-05) | −0.31 (1.3E-06) | 0.046 | −0.29 (4.4E-04) |
| cg11668923 | ADAM12 | −2.84 (0.06) | 0.092 (0.27) | −0.52 (7.7E-04) | −0.67 (6.1E-05) | −1.18 (5.8E-11) | 0.047 | −0.80 (2.0E-04) |
| cg21303386 | RGS7 | −2.46 (0.06) | 0.077 (0.37) | −0.46 (0.002) | −0.61 (6.9E-05) | −1.06 (3.5E-09) | 0.048 | −0.48 (0.011) |
| cg11323198 | CDH8 | −2.32 (0.04) | 0.014 (0.81) | −0.35 (9.9E-05) | −0.40 (8.3E-05) | −0.76 (1.7E-09) | 0.052 | −0.39 (0.007) |
| cg03026462 | FOXA1 | −3.37 (0.07) | 0.038 (0.69) | −0.49 (0.005) | −0.77 (1.0E-04) | −1.26 (3.8E-09) | 0.054 | −0.62 (0.012) |
| cg15731815 | RNF207 | −2.50 (0.06) | 0.173 (0.08) | −0.35 (0.020) | −0.60 (1.0E-04) | −0.95 (1.7E-07) | 0.054 | −0.69 (6.6E-04) |
| cg23984434 | GUCY1A2 | −3.77 (0.05) | −0.079 (0.34) | −0.54 (3.1E-05) | −0.56 (1.1E-04) | −1.10 (2.8E-11) | 0.054 | −0.41 (0.031) |
| cg18133966 | PLA2G1B | 1.44 (0.03) | −0.069 (0.12) | 0.10 (0.22) | 0.30 (1.2E-04) | 0.39 (1.1E-04) | 0.055 | 0.32 (0.002) |
| cg02590345 | LPPR1 | −3.07 (0.03) | 0.030 (0.50) | −0.30 (7.4E-06) | −0.29 (2.0E-04) | −0.59 (4.0E-12) | 0.085 | −0.27 (0.009) |
| cg17457560 | NRG1 | −2.96 (0.05) | 0.10 (0.19) | −0.40 (0.004) | −0.53 (2.2E-04) | −0.93 (2.7E-08) | 0.085 | −0.35 (0.079) |
| cg19502744 | SRD5A2 | −1.86 (0.03) | 0.079 (0.10) | −0.27 (2.8E-05) | −0.27 (2.2E-04) | −0.54 (7.4E-10) | 0.085 | −0.15 (0.120) |
| cg17906786 | C13orf36 | −0.67 (0.02) | −0.005 (0.88) | 0.07 (0.16) | −0.18 (2.3E-04) | −0.11 (0.04) | 0.085 | −0.17 (0.008) |
| cg12262564 | IQGAP3 | −2.36 (0.04) | 0.044 (0.41) | −0.37 (3.2E-05) | −0.35 (2.9E-04) | −0.72 (1.4E-09) | 0.097 | −0.30 (0.007) |
| cg03554552 |
CD3EAP; PPP1R13L |
−1.82 (0.03) | 0.047 (0.34) | −0.49 (3.6E-09) | −0.32 (3.0E-04) | −0.81 (4.2E-16) | 0.097 | −0.27 (0.013) |
| cg19764436 |
RTDR1; GNAZ |
−2.82 (0.03) | 0.032 (0.51) | −0.38 (4.9E-07) | −0.30 (3.1E-04) | −0.69 (3.5E-14) | 0.097 | −0.32 (0.004) |
aRegression coefficients presented are from the generalized estimating equation model comparing ever smokers vs. never smokers:
. µ is the predicted Phase 1 M value for never smokers calculated based on the average distribution of age, sex, and cell proportions in the cohort (N = 380). reflects the estimated cross-sectional difference in Phase 1 methylation level between ever- and never-smokers. reflects the estimated rate of methylation change (M value/decade) for never-smokers. reflects the estimated difference in rate of change between ever and never smokers. (+) reflects the estimated rate of methylation change (M value/decade) for ever smokers.
bFor comparison, is provided, which represents the estimated difference in rate of methylation change between current and never smokers.
Figure 1.
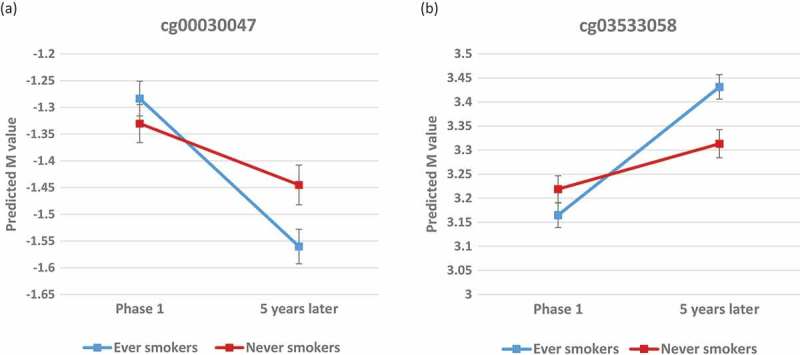
Predicted trajectories for ever-smokers and never-smokers over 5 years at cg00030047 (A) and cg03533058 (B). Predicted methylation levels were calculated from the GEE model based on the average distribution of age, sex, and cell proportions in the cohort (N = 380). Error bars denote the 95% confidence interval for each predicted M value.
Effect estimates with consistent effect directions and similar magnitudes were also observed for the change rate of the 22 CpGs in the analysis comparing current vs. never smokers ( in Table 2), though p-values were less significant, which is likely due to the reduced sample size. For most of the 22 significant sites, the mean change rate in former-smokers is either similar with that in current smokers, or between the mean change rate of current smokers and never smokers (Figure S6).
When further controlling for Phase 1 hypertension, or controlling for Phase 1 hypertension, diabetes, BMI, and alcohol consumption, we observed no substantive change in the detected association effects or significance between smoking and methylation change rate (all remained significant with p < 0.001 for and had similar effect estimates, Table S3). In addition, no substantive changes were observed in the regression results of the sensitivity analysis which excluded the 25 participants whose smoking status changed between time points (Table S4).
The majority of the genes corresponding to the 22 CpGs have previously been shown to be associated with smoking-related health outcomes. Table S5 provides the molecular function of each gene as well as a non-exhaustive list of relevant previous studies.
Enrichment analysis on genomic features and gene-set analysis
The genomic features of the significant CpGs are shown in Table 3. For the 22 CpGs, 17 were nested in a CGI and three were in upstream (north) shores of CpG islands (CGIs). Significant enrichment was observed for CGI (77% versus 36% overall in the 6958 CpGs, p = 9.4 × 10−05), and marginally significant for the broader CGI region that also includes CGI flanking shores and shelves (91% versus 74% overall, p = 0.049). No significant enrichment was detected for promoter regions or gene bodies. We found enrichment of CpGs mapping to enhancer elements (32% versus 13% overall, p = 0.015) and DNAse hypersensitivity sites (41% versus 13% overall, p = 0.001), indicating that the detected CpG sites are more likely to be near elements that are associated with gene expression. No significant gene-set enrichment was observed in the 22 CpGs after FDR correction in the GO or KEGG pathways.
Table 3.
Genomic features of the 22 significant sites.
| CpG | Nearest genea | Chr | CGI regionb | Promoterb | Gene bodyb | Enhancerb | DHSb |
|---|---|---|---|---|---|---|---|
| cg00030047 | RNF207 | 1 | N_Shore | TRUE | TRUE | TRUE | |
| cg21494776 | ICAM4 | 19 | Island | TRUE | |||
| cg16638540 | ZNF135 | 19 | Island | TRUE | TRUE | TRUE | |
| cg08675664 | ALDH7A1 | 5 | Island | ||||
| cg10549973 | TOMM20L | 14 | Island | TRUE | TRUE | ||
| cg03533058 | NR4A1 | 12 | |||||
| cg04597449 | GPR150 | 5 | N_Shore | TRUE | |||
| cg03760483 | ALOX12 | 17 | Island | TRUE | TRUE | TRUE | |
| cg11668923 | ADAM12 | 10 | Island | TRUE | |||
| cg21303386 | RGS7 | 1 | Island | TRUE | |||
| cg11323198 | CDH8 | 16 | Island | ||||
| cg03026462 | FOXA1 | 14 | Island | TRUE | |||
| cg15731815 | RNF207 | 1 | Island | TRUE | TRUE | TRUE | |
| cg23984434 | GUCY1A2 | 11 | Island | TRUE | |||
| cg18133966 | PLA2G1B | 12 | TRUE | ||||
| cg02590345 | LPPR1 | 9 | Island | TRUE | TRUE | ||
| cg17457560 | NRG1 | 8 | Island | TRUE | TRUE | ||
| cg19502744 | SRD5A2 | 2 | Island | TRUE | |||
| cg17906786 | C13orf36 | 13 | N_Shore | TRUE | |||
| cg12262564 | IQGAP3 | 1 | Island | TRUE | |||
| cg03554552 | PPP1R13L; CD3EAP | 19 | Island | TRUE (for CD3EAP) |
|||
| cg19764436 |
RTDR1;GNAZ |
22 |
Island |
|
TRUE (for RTDR1) |
|
|
| Enrichment p valuec |
- | - |
= 9.4E-05 = 0.049 |
0.97 | 0.31 | 0.015 | 0.001 |
aThe nearest gene(s) around the CpG, according to Illumina annotation and the UCSC Genome Browser.
bGenomic features are based on Illumina annotation and the UCSC Genome Browser. CGI region: CpG island as well as flanking shores and shelves; ‘Island’ represents being within a CGI; ‘N_Shore’ represents being 0–2 kb upstream from a CGI. Promoter: located within 1.5 kb before the transcription start site of any transcript of the associated gene. DHS: DNAse hypersensitivity sites.
cOne-sided Fisher’s exact test was used to examine enrichment in specific genomic regions. For the enrichment analysis on CGI region, indicates enrichment for CGI, and indicates enrichment in broader CGI regions (including flanking CGI shores and shelves).
Cross-sectional analysis
We conducted a cross-sectional association analysis on methylation levels of the 6958 CpGs at Phase 1 to examine potential replication of previous EWAS findings. Among the 6958 CpGs included in our analysis, 578 CpGs were among those that showed significantly different methylation levels between current smokers and never smokers (FDR q < 0.05) in the EWAS meta-analysis conducted by Joehanes, et al. (2016) [4]. We compared methylation level between current smokers and never smokers in our 380 subjects for the 578 CpGs, and found that the effect estimates of 510 (88.2%) CpGs were consistent with the EWAS meta-analysis. Among these 510 sites, 136 (23.5%) had p < 0.05, which is more than twice as high as the percentage of the full set of 6958 CpGs with p < 0.05 (10.4%). In addition, in the EWAS meta-analysis, 89 of the 578 CpGs were also differentially methylated between former smokers and never smokers (FDR q < 0.05). For these 89 CpGs, we compared methylation levels between ever smokers and never smokers in our data. We found that 79 (88.8%) of these CpGs had the same direction of effect as in the EWAS meta-analysis, among which 18 (20.2%) also had p < 0.05, as compared to only 4.8% of the full set of 6958 CpGs with p < 0.05.
Discussion
Substantial research has demonstrated a strong epigenetic effect of smoking. However in the current literature, there is a lack of longitudinal analysis on intra-individual methylation change. The GENOA cohort, in which genome-wide DNA methylation was assessed at two time points, provides an unprecedented opportunity to explore the dynamics of the epigenome in elderly African Americans. In this study, we identified 22 epigenetic signatures for cigarette smoking whose methylation change rate was significantly associated with smoking status. The majority of the 22 CpG sites significantly changed over time for both ever and never smokers, but the change in ever smokers was significantly faster than that in never smokers, regardless of the direction of the change. This indicates that smoking may accelerate epigenetic changes that are part of the normal aging process, which may in turn increase the risk of aging-related diseases. In addition, most of the significant CpGs tended to decrease over time. This trend has also been observed in previous EWAS studies, in that smoking is associated with decreased methylation levels for most of the smoking-related CpGs that have been identified to date [3,4].
Our significant results are enriched in genomic regions that are associated with important regulatory functions for gene expression, including CpG islands, enhancers, and DNAse hypersensitivity sites. These regions have also been shown as highly dynamic [20]. It is noteworthy that three of the significant sites are located within CpG shores, one of the most variable genomic regions [20], although significant enrichment for CpG shores was not detected for our results. We did not observe significant enrichment in promoter regions or gene bodies.
The effect of smoking on gene expression can be persistent or reversible [21]. Similarly, differential responses to cigarette smoke among CpGs have been observed in previous EWAS studies. Specifically, smoking-related methylation alteration at some loci can revert to non-smoking levels after cessation, while the change at other loci can persist for decades after cessation [4,10,22,23]. For the 6958 CpGs included in our primary analysis, we did not observe significant differences in methylation change rates between current smokers and former smokers; thus, we combined the two groups for analysis. Lack of significance may have indicated that many of the CpGs evaluated in this study were not rapidly-reversible upon smoking cessation; alternatively, our study may have been underpowered to detect differences in methylation between current and former smokers. Among the 22 significant CpGs, the change rate in former smokers at approximately half of the CpGs was similar to that in current smokers (Figure S6), indicating that the smoking effect on these CpGs may be persistent. For the other half of the significant CpGs, former smokers had a change rate between that of current and never smokers (Figure S6). This trend suggests that the altered methylation dynamics due to smoking was at least partially restored after cessation at these slowly-reversible CpGs. The underlying mechanism for the reversibility of methylation change and the timing of the reversal effect after cessation will be an important area of future research.
Our longitudinal analysis suggests that previous cross-sectional EWAS analyses of smoking may have missed some signals. For the 22 significant CpGs identified in our longitudinal analysis, we did not observe significant differences in methylation levels at Phase 1 (Table 2). The fact that findings from cross-sectional analysis may not necessarily overlap with findings from longitudinal analysis has been reported in previous research. In a two-time-point study in an elderly European population (N = 499), 56,579 CpGs were significantly associated with age in cross-sectional analysis, and 31,252 CpGs significantly changed over 9 years, with only 16,987 CpGs overlapping between the two analysis [17]. In another two-time-point methylation study on smoking [19], longitudinal analysis was limited to CpGs presenting significant association with smoking in cross-sectional analysis, and the results showed that only 53% of the tested CpGs had consistent direction of longitudinal and cross-sectional effects. Thus, studies that restrict longitudinal analysis to CpGs significant in cross-sectional analysis may miss some true signals, and it may also be the case that effect directions are not always consistent in cross-sectional and longitudinal studies. Specifically, it is possible to hypothesize that methylation change in response to tobacco smoke exposure may differ across sites through different regulatory mechanisms. Some CpGs become methylated or demethylated shortly after exposure to smoking. For other CpGs, however, smoking may affect the dynamic trajectory of methylation, and it may take some time for the change to accumulate to a detectable magnitude. These slowly-respondent loci are possibly involved in mechanisms for smoking’s long-term effects on health, but they can easily be missed in cross-sectional analysis. In this case, longitudinal analysis, with a good control of internal confounders, is a powerful approach to examine methylation dynamics and identify CpGs that are persistently affected by smoking.
None of the 22 CpG sites that we identified were reported in previous EWAS of cigarette smoking in African ancestry [24,25] or Asian ancestry [5,26,27], and only one (cg03026462 at FOXA1) was identified in the meta-analysis of European and African ancestry [4]. Thus, we identified 21 novel loci for cigarette smoking that have not been detected in previous epigenetic research on smoking. In accordance with the widespread impact of smoking on health outcomes across many organ systems [8], most of our significant CpGs are located within or near genes that have been shown to have a potential role in various cancers, cardiovascular function, and/or inflammation (Table S5).
For example, FOXA1 encodes a pioneer transcription factor that can bind to genomic regions with enhancers and initiate subsequent regulatory events through epigenetic switches including DNA demethylation [28]. FOXA1 plays an important role in development and differentiation of multiple organs and has also been implicated in the progression and prognosis of many hormone dependent cancers, including breast [29], prostate [30], colorectal [31], and endometrial cancer [32]. Importantly, FOXA1 expression has also been found to associate with worse lung function in COPD patients [33] and to promote apoptosis of the pulmonary epithelial cells [34]. FOXA1 was also suggested as a negative regulator in the initial stages of lung cancer metastasis [35]. Given that promoter methylation often leads to decreased gene expression, the faster decrease in FOXA1 cg03026462 methylation observed in GENOA ever smokers may result in upregulated FOXA1 expression, which is associated with worse lung function and lung cancer metastasis.
A total of 17 of the 22 CpG sites identified (77.2%) have been previously associated with at least one form of cancer (Table S5). Of these, eight have been linked with various forms of lung cancer, including ZNF135 [36], ALDH7A1 [37], NR4A1 [38], ADAM12 [39], NRG1 [40], IQGAP3 [41], PPP1R13L [42], and CD3EAP [43]. Three identified genes also influence other aspects of lung function, including ALOX12 (persistent wheezing in childhood [44]), CDH8 (lung function in patients with Cystic Fibrosis [45]), and PLA2G1B (lung inflammation [46]).
Some of the identified genes have also been linked with cardiovascular function and/or inflammatory response. For example, two of the significant CpGs are located within RNF207, a gene that has recently been shown to have an important role in cardiac energy metabolism and development of cardiac dysfunction [47,48]. The plasma level of Rnf207 has been proposed as a biomarker for early diagnosis of acute myocardial infarction [49]. Moreover, polymorphisms in ALOX12 have been linked with various cardiovascular diseases, including hypertension [50], subclinical atherosclerosis [51], myocardial infarction [52], as well as inflammation biomarkers [51]. The known functions of the identified genes offer valuable insight into the potential underlying mechanisms of the effects of smoking on cardiovascular health.
Of particular note, GPR150 encodes an orphan member of the class A rhodopsin-like family of G-protein-coupled receptors (GPCRs), which have an important role in cell growth and oncogenesis [53]. Interestingly, another gene in the same GPCR class, GPR15, is a well-known epigenetic biomarker of smoking [54], and smoking-induced hypomethylation of GPR15 cg19859270 has been reported for several populations including those of African ancestry [4,24]. GPR150 and GPR15 were shown to have similar patterns of constitutive activity in the cAMP signaling pathway [55]. Our findings suggest that additional GPCRs beyond GPR15 may be potential targets for the hazardous effect of smoking.
Our study has many strengths. To our knowledge, this is the first epigenome-wide investigation on the association between smoking and methylation change over time. Our longitudinal analysis leveraging the GEE model offered the opportunity to examine distinct methylation patterns and the dynamic course between ever smokers and never smokers, while unmeasured internal confounders including genetic variants are well controlled. Given the lack of studies reporting the impact of smoking on intra-individual methylation change over time, our study provides valuable insight into the epigenetic mechanisms for the harmful health effects of smoking. Furthermore, our sample was comprised of older African Americans, an under-studied population. Moreover, white blood cells are excellent target tissues to study the epigenetic effects of smoking, because smoking is known to lead to chronic inflammation. Future studies in target tissues for smoking-related diseases (such as heart and lung) will offer more insight to the underlying mechanisms by which DNA methylation mediates the effect of smoking on physiological functions. Finally, we developed a pipeline for data preprocessing and harmonization between DNA methylation platforms, which enabled cross-platform comparisons.
However, our study is not without limitations. First, the harmonization performed to control platform differences between the two phases limits the interpretability of the analysis results, and may have also reduced the magnitude of methylation change, resulting in decreased power to detect smoking effects on methylation change. Also due to the harmonization, we were only able to examine methylation change in a subset of CpGs with high a signal-to-noise ratio. Secondly, although the GENOA cohort has a large methylation sample at both phases, the relatively small sample size of participants available for longitudinal analysis limited statistical power. In addition, since only a few participants changed in smoking status between the two time points, we were underpowered to assess the ways that methylation changes when there is a change in smoking status. With more data in the future, we will be able to further examine how smoking dosage and cessation influences epigenetic trajectories. Thirdly, we were not able to control for genomic principal components in this analysis because genetic data were not available for some participants. Lastly, it has been suggested that stability of methylation sites may be affected by genetic factors [13]. In this study, we reduced this problem by excluding CpGs within two nucleotides or closer to a SNP. A comprehensive investigation in the future integrating genetic polymorphisms, methylation, gene expression, and organ damage measures will allow us to better understand how the complex human genome is regulated by the interplay of genes and environment, as well as how aberrant epigenetic dynamics can lead to physiological dysfunction.
Conclusion
In summary, we identified 22 smoking-related CpGs, 21 of which have not been previously identified. In these sites, the methylation change rate tends to be accelerated by smoking. The corresponding genes play important roles in various human cancers, cardiovascular diseases, and inflammation. The insights gained from this study may improve our understanding of the molecular mechanisms underlying the health hazards caused by smoking and facilitate the development of targeted treatment for smoking-induced diseases in the era of precision medicine. Our study also offers an epigenome-wide analysis of smoking effects on intra-individual methylation change, which is largely missing from the current literature. The distinct findings from longitudinal analysis and cross-sectional analysis highlight the importance of longitudinal analysis in understanding the dynamic human epigenome.
Materials and methods
Study population
The Genetic Epidemiology Network of Arteriopathy (GENOA) is a community-based study of hypertensive sibships designed to investigate the genetics of hypertension and target organ damage [56,57]. In the initial phase of GENOA (Phase 1: 1996–2001), all members of sibships containing ≥ 2 individuals with essential hypertension clinically diagnosed before age 60 were invited to participate, including both hypertensive and normotensive siblings. A total of 1,854 African Americans from Jackson, MS were recruited in the initial phase. Eighty percent (N = 1,482) from the initial study population returned for the second examination (Phase 2: 2001–2005). Demographic information, medical history, clinical characteristics, lifestyle factors, and blood samples were collected in each phase. DNA methylation levels were measured from peripheral blood samples collected at both phases for 422 unrelated participants. After quality control of methylation data, N = 380 had methylation measured at both phases and a recorded smoking status at Phase 1.
Assessment of smoking status and other covariates
Ever smokers (current and former smokers) and never smokers were classified based on self-reported smoking status at Phase 1. Current smokers were defined as those who reported smoking at the time of exam or last quit smoking within the year prior to the exam date, and had smoked more than 100 cigarette in his or her lifetime. Former smokers were defined as those who last quit smoking more than a year prior to the exam date, but reported having smoked more than 100 cigarettes in his or her lifetime. Never smokers were defined as those who had not smoked more than 100 cigarettes in his or her lifetime.
Potential confounders assessed at Phase 1 were considered as additional covariates in our analysis. Hypertension was defined as having systolic blood pressure ≥140 mmHg, diastolic blood pressure ≥90 mmHg, or previous diagnosis of hypertension and use of antihypertensive medication. Diabetes was defined as fasting blood glucose ≥ 126 mg/dL or use of antidiabetic medication. Body mass index (BMI, kg/m2) was calculated from measured weight and height. Participants who reported alcohol consumption are those who described themselves as a person who sometimes drinks alcoholic beverages rather than never.
Methylation data preprocessing and harmonization
Genomic DNA was extracted from stored peripheral blood leukocytes that were collected at Phase 1 (1996–2001) and Phase 2 (2001–2005) using the AutoGen FlexStar system (AutoGen, Holliston, MA). Bisulfite conversion was performed with the EZ DNA Methylation Kit (Zymo Research, Irvine, CA). A total of 422 DNA samples at Phase 1 were assessed using the Illumina Infinium HumanMethylation450 BeadChip (450K), and 1008 samples at Phase 2 were assessed using the Illumina Infinium HumanMethylation27 BeadChip (27K), including 422 of the same participants measured at Phase 1. Ten out of the 1008 samples collected at Phase 2 were also assessed using the 450K BeadChip, so we were able to identify and control for technical bias between the two platforms using these cross-platform replicates.
We developed a quality control (QC) pipeline (Figure S1) for 27K and 450K data preprocessing and harmonization based on methods suggested by Illumina and previous studies [58–60]. For data from each platform, individual background and dye-bias correction was conducted using the Noob method implemented in the Minfi package [61]. Exclusively for 450K where two types of probes were used (Infinium I and Infinium II), we used the Regression on Correlated Probes (RCP) method [62] to adjust for the probe-type bias in the 450K data. ComBat, an empirical Bayes batch-correction method [63], was used to remove technical effects. Mislabeled samples, outliers, samples with probe detection rate<90% (detection p = 0.01 for 27K, as suggested by Illumina; detection p < 10−16 for 450K data, as suggested by Lehne, et al. (2015) [58]), and samples with incomplete bisulfite conversion were removed. Probes detected in <90% of samples were removed. Finally, 429 samples and 478,865 probes in 450K and 949 samples and 25,605 probes in 27K were available after the QC process.
In order to harmonize the methylation data between the two platforms, we combined the preprocessed 450K and 27K data and retained only the 23,202 overlapping probes on autosomal chromosomes. The ComBat function was used to adjust for platform differences in the combined data. After the harmonization, we calculated the inter-individual correlation between 27K measures and 450K measures for each probe across the nine cross-platform replicates (one of the ten replicate samples was removed during 27K data preprocessing), as well as the intra-individual correlation for each replicate pair across 23,202 probes. We also compared the distribution of correlations in cross-platform replicates to that in randomly selected cross-platform pairs. Only probes with inter-individual correlation no less than 0.5 were retained for further analysis (n = 7360). We then excluded probes that are two nucleotides or closer to a SNP and/or probes known to cross-hybridize to other regions of the genome [64]. After this process, 6958 CpG sites were available for analysis.
We next quantified the methylation level of each CpG site in terms of its relative difference with respect to the mean methylation level across all individuals within each phase. The methylation level of a given CpG was first calculated as β value based on the formula β = max (IM,0)/[(max(IU,0)+max(IM,0)+100], where IM represents the fluorescence intensity of the methylated sites and IU represents the fluorescence intensity of the unmethylated sites. We further transformed β values into M values using the formula M = log2(β/(1-β)), as the M values better follow a Gaussian distribution. The proportions of each of the six white blood cell types (CD4 T-cells, CD8 T-cells, NK-cells, B-cells, monocytes, and granulocytes) were estimated using Houseman’s method [65].
Statistical analyses
1. Smoking effect on methylation change
To account for repeated measurements within the same subject, we used generalized estimating equation (GEE) models (shown below) with an exchangeable correlation structure to assess the association between smoking and methylation change rate for each of the 6958 CpGs:
For subject (1, …, N) and Phase j (j = 1, 2), is the methylation M value for the th subject at Phase j; is a binary indicator for current or ever smoker at Phase 1; is the time (in decades) elapsed since Phase 1, and = 0 for Phase 1 measures; is the age (in years) at Phase 1; includes the percentages of CD4 T-cells, CD8 T-cells, NK-cells, B-cells, and monocytes estimated at each phase. reflects the cross-sectional difference in Phase 1 methylation level across smoking groups. reflects the rate of change (change in M value per decade) in methylation for never smokers. reflects the difference in rate of methylation change across smoking groups. To examine the smoking effect on rate of methylation change, tested the null hypothesis versus . False Discovery Rate (FDR) [66] was used to correct for multiple testing across the epigenome, and an FDR q value<0.1 was considered significant. For significant associations, a model further controlling for hypertension, and a fully adjusted model including hypertension, diabetes, BMI, and alcohol consumption were used to assess potential confounding. We also conducted a sensitivity analysis for significant CpGs by re-running the GEE model after excluding the 25 participants whose smoking status changed between time points.
2. Enrichment of genomic features and pathways
For CpG sites significantly associated with smoking, we examined whether their locations were enriched in certain genomic regions including gene promoters, CpG islands (CGI), CGI flanking regions (CGI shore, 0–2 kb from CGI; CGI shelf, 2-4 kb from CGI), enhancers, and DNAse hypersensitivity sites (DHS). We used annotation files from Illumina and the UCSC Genome Browser to determine the nearest gene and genomic features associated with each CpG. We considered a CpG site to be within a promoter region if it is located within 1.5 kb before the transcription start site of any transcript of the associated gene. Enrichment analysis was performed using a one-sided Fisher’s exact test, comparing the distribution of each genomic feature of the significant sites to the distribution in all 6958 CpGs. p < 0.05 was considered significant.
We also performed gene-set enrichment analysis on significant CpGs to test potential enrichment in biological pathways using the gometh() function implemented in the missMethyl R package [67]. Gene ontology (GO) categories and KEGG pathways were tested, and FDR q < 0.1 was considered significant evidence for enrichment.
3. Cross-sectional analysis
As a confirmatory step, we also conducted a cross-sectional analysis for smoking at Phase 1 in the 380 subjects to examine potential replication of previous EWAS findings for smoking in our data. We performed linear regression in the 6958 CpGs using the model shown below:
is the methylation M value for the th subject at Phase 1; is a binary indicator for current or ever smoker at Phase 1; is the age (in years) at Phase 1; includes the percentages of CD4 T-cells, CD8 T-cells, NK-cells, B-cells, and monocytes estimated at Phase 1. To examine the smoking effect on methylation level at Phase 1, we tested the null hypothesis versus , and p < 0.05 was considered significant. Then, we compared our effect estimates to those in Joehanes, et al. (2016) [4], the largest epigneome-wide meta-analysis of smoking to date, to examine whether the directions of effect are consistent across studies and whether our significant findings are enriched for sites that were also significant in the Joehanes, et al. study.
Funding Statement
Funding for the GENOA study was provided by the National Heart, Lung and Blood Institute of the National Institutes of Health (HL054464, HL054457, HL054481, HL100185, HL119443, HL085571, and HL133221).
Disclosure statement
No potential conflict of interest was reported by the authors.
Supplemental material
Supplemental data for this article can be accessed here.
References
- [1].Duaso M, Duncan D.. Health impact of smoking and smoking cessation strategies: current evidence. Br J Community Nurs. 2012;17(8):356–363. [DOI] [PubMed] [Google Scholar]
- [2].Martin EM, Fry RC. Environmental influences on the epigenome: exposure- associated DNA methylation in human populations. Annu Rev Public Health. 2018;39:309–333. [DOI] [PubMed] [Google Scholar]
- [3].Gao X, Jia M, Zhang Y, et al. DNA methylation changes of whole blood cells in response to active smoking exposure in adults: a systematic review of DNA methylation studies. Clin Epigenetics. 2015;7(1):113. [DOI] [PMC free article] [PubMed] [Google Scholar]
- [4].Joehanes R, Just AC, Marioni RE, et al. Epigenetic signatures of cigarette smoking. Circ Cardiovasc Genet. 2016;9(5):436–447. [DOI] [PMC free article] [PubMed] [Google Scholar]
- [5].Zhu X, Li J, Deng S, et al. Genome-wide analysis of DNA methylation and cigarette smoking in a Chinese population. Environ Health Perspect. 2016;124(7):966–973. [DOI] [PMC free article] [PubMed] [Google Scholar]
- [6].Zhang Y, Schottker B, Florath I, et al. Smoking-associated DNA methylation biomarkers and their predictive value for all-cause and cardiovascular mortality. Environ Health Perspect. 2016;124(1):67–74. [DOI] [PMC free article] [PubMed] [Google Scholar]
- [7].Breitling LP, Salzmann K, Rothenbacher D, et al. Smoking, F2RL3 methylation, and prognosis in stable coronary heart disease. Eur Heart J. 2012;33(22):2841–2848. [DOI] [PubMed] [Google Scholar]
- [8].National Center for Chronic Disease Prevention and Health Promotion (US) Office on Smoking and Health . [Google Scholar]
- [9].Centers for Disease Control and Prevention (US), National Center for Chronic Disease Prevention and Health Promotion (US), Office on Smoking and Health (US) . [Google Scholar]
- [10].Guida F, Sandanger TM, Castagné R, et al. Dynamics of smoking-induced genome-wide methylation changes with time since smoking cessation. Hum Mol Genet. 2015;24(8):2349–2359. [DOI] [PMC free article] [PubMed] [Google Scholar]
- [11].Huan T, Joehanes R, Schurmann C, et al. A whole-blood transcriptome meta-analysis identifies gene expression signatures of cigarette smoking. Hum Mol Genet. 2016;25(21):4611–4623. [DOI] [PMC free article] [PubMed] [Google Scholar]
- [12].Shenker NS, Ueland PM, Polidoro S, et al. DNA methylation as a long-term biomarker of exposure to tobacco smoke. Epidemiology. 2013;24(5):712–716. [DOI] [PubMed] [Google Scholar]
- [13].Ng JW, Barrett LM, Wong A, et al. The role of longitudinal cohort studies in epigenetic epidemiology: challenges and opportunities. Genome Biol. 2012;13(6):246. [DOI] [PMC free article] [PubMed] [Google Scholar]
- [14].Wong CCY, Caspi A, Williams B, et al. A longitudinal study of epigenetic variation in twins. Epigenetics. 2010;5(6):516–526. [DOI] [PMC free article] [PubMed] [Google Scholar]
- [15].Joyce BT, Gao T, Liu L, et al. Longitudinal study of DNA methylation of inflammatory genes and cancer risk. Cancer Epidemiol Biomarkers Prev. 2015;24(10):1531–1538. [DOI] [PMC free article] [PubMed] [Google Scholar]
- [16].Madrigano J, Baccarelli A, Mittleman MA, et al. Aging and epigenetics: longitudinal changes in gene-specific DNA methylation. Epigenetics. 2012;7(1):63–70. [DOI] [PMC free article] [PubMed] [Google Scholar]
- [17].Moore AZ, Hernandez DG, Tanaka T, et al. Change in epigenome-wide DNA methylation over 9 years and subsequent mortality: results from the InCHIANTI study. J Gerontol A Biol Sci Med Sci. 2016;71(8):1029–1035. [DOI] [PMC free article] [PubMed] [Google Scholar]
- [18].Wang D, Liu X, Zhou Y, et al. Individual variation and longitudinal pattern of genome-wide DNA methylation from birth to the first two years of life. Epigenetics. 2012;7(6):594–605. [DOI] [PMC free article] [PubMed] [Google Scholar]
- [19].Wilson R, Wahl S, Pfeiffer L, et al. The dynamics of smoking-related disturbed methylation: a two time-point study of methylation change in smokers, non-smokers and former smokers. BMC Genomics. 2017;18(1):805. [DOI] [PMC free article] [PubMed] [Google Scholar]
- [20].Ziller MJ, Gu H, Muller F, et al. Charting a dynamic DNA methylation landscape of the human genome. Nature. 2013;500(7463):477–481. [DOI] [PMC free article] [PubMed] [Google Scholar]
- [21].Beane J, Sebastiani P, Liu G, et al. Reversible and permanent effects of tobacco smoke exposure on airway epithelial gene expression. Genome Biol. 2007;8(9):R201. [DOI] [PMC free article] [PubMed] [Google Scholar]
- [22].Tsaprouni LG, Yang T, Bell J, et al. Cigarette smoking reduces DNA methylation levels at multiple genomic loci but the effect is partially reversible upon cessation. Epigenetics. 2014;9(10):1382–1396. [DOI] [PMC free article] [PubMed] [Google Scholar]
- [23].Ambatipudi S, Cuenin C, Hernandez-Vargas H, et al. Tobacco smoking-associated genome-wide DNA methylation changes in the EPIC study. Epigenomics. 2016;8(5):599–618. [DOI] [PubMed] [Google Scholar]
- [24].Dogan MV, Shields B, Cutrona C, et al. The effect of smoking on DNA methylation of peripheral blood mononuclear cells from African American women. BMC Genomics. 2014;15(1):151. [DOI] [PMC free article] [PubMed] [Google Scholar]
- [25].Philibert RA, Beach SR, Lei MK, et al. Changes in DNA methylation at the aryl hydrocarbon receptor repressor may be a new biomarker for smoking. Clin Epigenet. 2013;5(1):19. [DOI] [PMC free article] [PubMed] [Google Scholar]
- [26].Li J, Zhu X, Yu K, et al. Genome-wide analysis of DNA methylation and acute coronary syndrome. Circ Res. 2017;120(11):1754–1767. [DOI] [PubMed] [Google Scholar]
- [27].Lee MK, Hong Y, Kim SY, et al. DNA methylation and smoking in Korean adults: epigenome-wide association study. Clin Epigenet. 2016;8(1):103. [DOI] [PMC free article] [PubMed] [Google Scholar]
- [28].Serandour AA, Avner S, Percevault F, et al. Epigenetic switch involved in activation of pioneer factor FOXA1-dependent enhancers. Genome Res. 2011;21(4):555–565. [DOI] [PMC free article] [PubMed] [Google Scholar]
- [29].Shou J, Lai Y, Xu J, et al. Prognostic value of FOXA1 in breast cancer: A systematic review and meta-analysis. Breast. 2016;27:35–43. [DOI] [PubMed] [Google Scholar]
- [30].Wang Q, Li W, Zhang Y, et al. Androgen receptor regulates a distinct transcription program in androgen-independent prostate cancer. Cell. 2009;138(2):245–256. [DOI] [PMC free article] [PubMed] [Google Scholar]
- [31].Ma W, Jiang J, Li M, et al. The clinical significance of forkhead box protein A1 and its role in colorectal cancer. Mol Med Rep. 2016;14(3):2625–2631. [DOI] [PMC free article] [PubMed] [Google Scholar]
- [32].Tangen IL, Krakstad C, Halle MK, et al. Switch in FOXA1 status associates with endometrial cancer progression. PloS one. 2014;9(5):e98069. [DOI] [PMC free article] [PubMed] [Google Scholar]
- [33].Hansel NN, Ruczinski I, Rafaels N, et al. Genome-wide study identifies two loci associated with lung function decline in mild to moderate COPD. Hum Genet. 2013;132(1):79–90. [DOI] [PMC free article] [PubMed] [Google Scholar]
- [34].Song L, Zhang B, Feng Y, et al. A role for forkhead box A1 in acute lung injury. Inflammation. 2009;32(5):322–332. [DOI] [PubMed] [Google Scholar]
- [35].Wang H, Meyer CA, Fei T, et al. A systematic approach identifies FOXA1 as a key factor in the loss of epithelial traits during the epithelial-to-mesenchymal transition in lung cancer. BMC Genomics. 2013;14(1):680. [DOI] [PMC free article] [PubMed] [Google Scholar]
- [36].Robles AI, Arai E, Mathé EA, et al. An integrated prognostic classifier for stage I lung adenocarcinoma based on mRNA, microRNA, and DNA methylation biomarkers. J Thorac Oncol. 2015;10(7):1037–1048. [DOI] [PMC free article] [PubMed] [Google Scholar]
- [37].Li J, Wang J, Chen Y, et al. A prognostic 4‐gene expression signature for squamous cell lung carcinoma. J Cell Physiol. 2017;232(12):3702–3713. [DOI] [PubMed] [Google Scholar]
- [38].Zhu B, Yang JR, Jia Y, et al. Overexpression of NR4A1 is associated with tumor recurrence and poor survival in non-small-cell lung carcinoma. Oncotarget. 2017;8(69):113977–113986. [DOI] [PMC free article] [PubMed] [Google Scholar] [Retracted]
- [39].Shao S, Li Z, Gao W, et al. ADAM-12 as a diagnostic marker for the proliferation, migration and invasion in patients with small cell lung cancer. PLoS One. 2014;9(1):e85936. [DOI] [PMC free article] [PubMed] [Google Scholar]
- [40].Cha YJ, Shim HS. Biology of invasive mucinous adenocarcinoma of the lung. Transl Lung Cancer Res. 2017;6(5):508–512. [DOI] [PMC free article] [PubMed] [Google Scholar]
- [41].Yang Y, Zhao W, Xu Q, et al. IQGAP3 promotes EGFR-ERK signaling and the growth and metastasis of lung cancer cells. PLoS One. 2014;9(5):e97578. [DOI] [PMC free article] [PubMed] [Google Scholar]
- [42].Li S, Shi G, Yuan H, et al. Abnormal expression pattern of the ASPP family of proteins in human non-small cell lung cancer and regulatory functions on apoptosis through p53 by iASPP. Oncol Rep. 2012;28(1):133–140. [DOI] [PubMed] [Google Scholar]
- [43].Yin J, Guo L, Wang C, et al. Effects of PPP1R13L and CD3EAP variants on lung cancer susceptibility among nonsmoking Chinese women. Gene. 2013;524(2):228–231. [DOI] [PubMed] [Google Scholar]
- [44].Morales E, Bustamante M, Vilahur N, et al. DNA hypomethylation at ALOX12 is associated with persistent wheezing in childhood. Am J Respir Crit Care Med. 2012;185(9):937–943. [DOI] [PubMed] [Google Scholar]
- [45].Wright FA, Strug LJ, Doshi VK, et al. Genome-wide association and linkage identify modifier loci of lung disease severity in cystic fibrosis at 11p13 and 20q13. 2. Nat Genet. 2011;43(6):539. [DOI] [PMC free article] [PubMed] [Google Scholar]
- [46].Yang C, Lee I, Chi P, et al. TNF-α induces cytosolic phospholipase A2 expression via Jak2/PDGFR-dependent Elk-1/p300 activation in human lung epithelial cells. Am J Physiol Lung Cell Mol Physiol. 2014;306(6):L543–51. [DOI] [PubMed] [Google Scholar]
- [47].Mizushima W, Takahashi H, Watanabe M, et al. The novel heart-specific RING finger protein 207 is involved in energy metabolism in cardiomyocytes. J Mol Cell Cardiol. 2016;100:43–53. [DOI] [PubMed] [Google Scholar]
- [48].Roder K, Werdich AA, Li W, et al. RING finger protein RNF207, a novel regulator of cardiac excitation. J Biol Chem. 2014. December 5;289(49):33730–33740. [DOI] [PMC free article] [PubMed] [Google Scholar]
- [49].Han QY, Wang HX, Liu XH, et al. Circulating E3 ligases are novel and sensitive biomarkers for diagnosis of acute myocardial infarction. Clin Sci (Lond). 2015;128(11):751–760. [DOI] [PMC free article] [PubMed] [Google Scholar]
- [50].Quintana LF, Guzman B, Collado S, et al. A coding polymorphism in the 12-lipoxygenase gene is associated to essential hypertension and urinary 12(S)-HETE. Kidney Int. 2006;69(3):526–530. [DOI] [PubMed] [Google Scholar]
- [51].Burdon KP, Rudock ME, Lehtinen AB, et al. Human lipoxygenase pathway gene variation and association with markers of subclinical atherosclerosis in the diabetes heart study. Mediators Inflamm. 2010;2010:1–9. [DOI] [PMC free article] [PubMed] [Google Scholar]
- [52].Roumeliotis AK, Roumeliotis SK, Panagoutsos SA, et al. Association of ALOX12 gene polymorphism with all-cause and cardiovascular mortality in diabetic nephropathy. Int Urol Nephrol. 2018;50(2):321–329. [DOI] [PubMed] [Google Scholar]
- [53].Dorsam RT, Gutkind JS. G-protein-coupled receptors and cancer. Nat Rev Cancer. 2007;7(2):79–94. [DOI] [PubMed] [Google Scholar]
- [54].Kõks S, Kõks G. Activation of GPR15 and its involvement in the biological effects of smoking. Exp Biol Med. 2017;242(11):1207–1212. [DOI] [PMC free article] [PubMed] [Google Scholar]
- [55].Martin AL, Steurer MA, Aronstam RS. Constitutive activity among orphan class-A G protein coupled receptors. PloS one. 2015;10(9):e0138463. [DOI] [PMC free article] [PubMed] [Google Scholar]
- [56].Daniels PR, Kardia SL, Hanis CL, et al. Genetic Epidemiology Network of Arteriopathy study. Familial aggregation of hypertension treatment and control in the Genetic Epidemiology Network of Arteriopathy (GENOA) study. Am J Med. 2004;116(10):676–681. [DOI] [PubMed] [Google Scholar]
- [57].FBPP Investigators Multi-center genetic study of hypertension: the Family Blood Pressure Program (FBPP). Hypertension. 2002;39(1):3–9. [DOI] [PubMed] [Google Scholar]
- [58].Lehne B, Drong AW, Loh M, et al. A coherent approach for analysis of the Illumina HumanMethylation450 BeadChip improves data quality and performance in epigenome-wide association studies. Genome Biol. 2015;16(1):37. [DOI] [PMC free article] [PubMed] [Google Scholar]
- [59].Morris TJ, Beck S. Analysis pipelines and packages for Infinium HumanMethylation450 BeadChip (450k) data. Methods. 2015;72:3–8. [DOI] [PMC free article] [PubMed] [Google Scholar]
- [60].Fortin J, Triche TJ Jr., Hansen KD. Preprocessing, normalization and integration of the Illumina HumanMethylationEPIC array with minfi. Bioinformatics. 2016;33(4):558–560. [DOI] [PMC free article] [PubMed] [Google Scholar]
- [61].Triche TJ Jr., Weisenberger DJ, Van Den Berg D, et al. Low-level processing of Illumina Infinium DNA methylation beadarrays. Nucleic Acids Res. 2013;41(7):e90. [DOI] [PMC free article] [PubMed] [Google Scholar]
- [62].Niu L, Xu Z, Taylor JA. RCP: a novel probe design bias correction method for Illumina Methylation BeadChip. Bioinformatics. 2016;32(17):2659–2663. [DOI] [PMC free article] [PubMed] [Google Scholar]
- [63].Johnson WE, Li C, Rabinovic A. Adjusting batch effects in microarray expression data using empirical Bayes methods. Biostatistics. 2007;8(1):118–127. [DOI] [PubMed] [Google Scholar]
- [64].Peters TJ, Buckley MJ, Statham AL, et al. De novo identification of differentially methylated regions in the human genome. Epigenetics Chromatin. 2015;8(1):6. [DOI] [PMC free article] [PubMed] [Google Scholar]
- [65].Houseman EA, Accomando WP, Koestler DC, et al. DNA methylation arrays as surrogate measures of cell mixture distribution. BMC Bioinformatics. 2012;13:86,2105–13-86. [DOI] [PMC free article] [PubMed] [Google Scholar]
- [66].Benjamini Y, Hochberg Y. Controlling the false discovery rate - a practical and powerful approach to multiple testing. J Roy Stat Soc B Met. 1995;57:289–300. [Google Scholar]
- [67].Phipson B, Maksimovic J, Oshlack A. missMethyl: an R package for analyzing data from Illumina's HumanMethylation450 platform. Bioinformatics. 2016 Jan 15;32(2):286–288. [DOI] [PubMed] [Google Scholar]
Associated Data
This section collects any data citations, data availability statements, or supplementary materials included in this article.