

Abstract
Optical second harmonic generation (SHG) is a nonlinear optical process which is sensitive to the symmetry of media. SHG microscopy allows for selective probing of a non-centrosymmetric area of sample. This type of nonlinear optical microscope was first used to observe ferroelectric domains and has been applied to various specimens including the biological samples to date. Imaging of the endogenous SHG of biological tissue has been utilized for the selective observation of filament systems in tissues such as collagen, myosin, and microtubules, which exhibit a polar structure. The cellular membrane can be selectively observed by the SHG microscope through membrane staining with amphiphilic polar dye molecules. It has been reported that, by imaging exogenous SHG of the membrane, sensitive detection of membrane damage could be realized using the SHG microscope. Because the staining dye is fluorescent, both SHG and two-photon excited fluorescence (TPF) images can be obtained simultaneously. How the SHG intensity depends on the molecular alignment of the polar dye molecules that reflects the ordering of lipid molecules in the plasma membrane and the necessity of the normalization of the SHG intensity by the TPF intensity is discussed. Furthermore, the assessment of the membrane damage induced by exposing polycation to HeLa cells has been compared with the conventional cytotoxicity and cell viability tests to demonstrate the higher sensitivity of the present SHG-based assay.
Electronic supplementary material
The online version of this article (10.1007/s12551-019-00546-x) contains supplementary material, which is available to authorized users.
Keywords: Nonlinear optics, SHG, HeLa cell, Cytotoxicity, Assay, Plasma membrane, Lipid bilayer, Molecular ordering
History of second harmonic generation and its application for imaging
Recently, a range of nonlinear optical processes (Shen 1984) including optical second harmonic generation (SHG) have been utilized in bioimaging from the cellular to the tissue level. Because two (or more) photons participate in the nonlinear optical processes, the nonlinear optical microscope can be called as two-photon or multi-photon microscope (Williams et al. 2001; Helmchen and Denk 2005; Oheim et al. 2006; Lefort 2017). Using two near-infrared femtosecond laser beams with different frequencies, three types of nonlinear optical processes, SHG, two-photon excited fluorescence (TPF), and coherent anti-Stokes Raman scattering (Fig. 1), can be generated simultaneously, resulting in multimodal tomographic imaging (König 2018). Such multiphoton tomography has already been used for the diagnosis of skin and corneal diseases in clinics (Weinigel et al. 2014). Herein, we first provide a brief overview of the history of SHG and its application for bioimaging.
Fig. 1.

(a) Energy level diagram of second harmonic generation (SHG). Two photons at the frequency ω instantaneously convert to a single photon at the frequency 2ω through the virtual states. Because three photons take part in this process, this nonlinear optical process is a three-photon process and is different from a sequential process of absorption and emission like fluorescence. Media that do not possess an inversion symmetry are SHG-active. (b) Diagram of two-photon excited fluorescence (TPF). The fluorophore is excited by absorbing two photons through the intermediate virtual state. After a vibrational relaxation to the lowest level of the excited state, the fluorescent photon is emitted as in a normal fluorescence process. The excitation process by two photons (two-photon absorption) is a nonlinear optical process classified as a two-photon process. In general, every fluorophore is able to exhibit TPF. (c) Diagram of coherent anti-Stokes Raman scattering (CARS). When the frequency difference between the pump beam (ωp) and the Stokes beam (ωs) matches the frequency of a Raman-active vibration mode, a resonant CARS at the frequency 2ωp–ωs occurs. CARS is a four-photon process and sensitive to a molecular vibration
SHG was first demonstrated from quartz crystal soon after the invention of the ruby laser (Franken et al. 1961). SHG is often referred to as the frequency doubling phenomenon since two photons of frequency ω are converted into one photon of frequency 2ω (Fig. 1a). Such an optical harmonic generation was theoretically described by the mixing of electromagnetic waves at interfaces and in nonlinear media (Armstrong et al. 1962; Bloembergen and Pershan 1962; Pershan 1963). These theoretical interpretations were confirmed by the experimental evidences, such as SHG from the ferroelectric and piezoelectric crystals (Bass et al. 1962; Savage and Miller 1962) and the reflected SHG from the surfaces of semiconductor (Ducuing and Bloembergen 1963) and metal (Brown et al. 1965). The SHG efficiencies of the crystalline powder of amino acids and surges were also investigated at this early stage (Rieckhoff and Peticolas 1965).
The most important characteristic of SHG is its sensitivity toward the symmetry of media. Within the dipole approximation, SHG is only allowed in media whose spatial inversion symmetry is broken and the above-mentioned crystals are non-centrosymmetric materials not possessing spatial inversion symmetry. For example, in the case of ferroelectric crystals, their non-centrosymmetric structures originate from the spontaneous polarization caused by the alignment of the electric dipole moments. Even in the case of centrosymmetric media, the surfaces and interfaces of the media are also SHG-active owing to the lack of spatial inversion symmetry at the boundary. Furthermore, media which do not have time inversion symmetry, are under the magnetic field, or possess magnetic ordering, also exhibit SHG activity (Pershan 1963; Fiebig et al. 2005). In early days, such a symmetry-sensitive nature made SHG as a tool for investigating the structural phase transition in crystals accompanied by the change in the symmetry (Miller 1964). This trend brought the first SHG image to study the structures of the ferroelectric domains of triglycine sulfate (Dolino 1973). Additionally, the grains in the polycrystalline semiconductor (Hellwarth and Christensen 1974) were also observed by the SHG microscope, enabling the detection of their structures which could not be visualized by a conventional optical microscope. Furthermore, SHG microscopy is able to visualize the 180° domains of the ferroelectric (Uesu et al. 1995; Kurimura and Uesu 1997; Flörsheimer et al. 1998) and antiferromagnetic (Fiebig and Fröhlich 1995) crystals in a nondestructive way. With the aid of the interference of SH waves generated from the sample and the reference crystal, the three-dimensional structure of the periodically inverted ferroelectric domain, which is essential for optimal design for nonlinear optical frequency conversion devices, can also be obtained by the SHG microscope (Kurimura and Uesu 1997; Flörsheimer et al. 1998; Uesu et al. 2007; Yokota et al. 2012).
Besides the bulk crystals, SHG was also applied to surface science as an analytical tool. After SHG was pointed out as being a sensitivity method for probing the monolayer at the surface of material, the expansion of the application of SHG to surface science contributed to establishing one of the subfields in nonlinear optics known as surface nonlinear optics (Bloembergen 1999; Shen 2000). SHG is able to probe the molecular adsorption and molecular ordering on the surfaces or at the interfaces of centrosymmetric media (Shen 1989), and the first SHG imaging of the monolayer was demonstrated using a dye monolayer coated on a fused-silica plate (Boyd et al. 1986). Later, the SHG microscope was applied to visualize the two-dimensional distributions of the orientation of polar dye molecules in a monolayer at the air-water interface (Flörsheimer et al. 1994; Kato et al. 1999a, b; Flörsheimer 1999; Uesu and Kato 1999) and in a self-assembled monolayer (Smilowitz et al. 1997).
Another impressive application of SHG microscope is to monitor the carrier motion in the organic transistor (Manaka et al. 2007). The injected carriers from the source electrode form a local electric field in the organic film that induces SHG. The collection of the time-resolved SHG images during the carrier injection from the source electrode allows monitoring the carrier motion in the channel.
The first biological sample observed by the SHG microscope was the rat-tail tendon which has a non-centrosymmetric structure owing to the alignment of polar collagen (Freund and Deutsch 1986). However, before the use of SHG microscopes progressed in biological studies, the images of living cells obtained by TPF microscope was reported (Denk et al. 1990). In fact, it was the use of TPF (not SHG) in bioimaging that opened a new interest for the application of nonlinear optical processes (Helmchen and Denk 2005; Oheim et al. 2006). Both SHG and TPF were first observed in 1961 and applied to various materials to investigate their efficiencies (Kaiser and Garrett 1961; Peticolas et al. 1963). However, TPF had the advantage to be readily applicable to the bioimaging compared to SHG. The fluorescence imaging technique in biology such as fluorescence labelling and the laser scanning device was well established before the invention of TPF microscopy. With the aid of the fluorescence imaging technique, TPF microscopy rapidly expanded its application to bioimaging. To obtain TPF from the fluorophores, the near-infrared ultrashort pulse laser is used instead of the UV-visible contentious-wave laser used to excite normal fluorescence. Use of the near-infrared light (700 to 1000 nm in wavelength) dramatically reduces the photo-toxicity and allows deeper imaging penetration depth (Helmchen and Denk 2005; Kawakami et al. 2013) owing to the low absorbance of near-infrared light in tissues (Pellicer and Bravo 2011; Jacques 2013). The inherent nonlinear optical property also brings a benefit of the nonlinear optical microscopy. The signal generated by the nonlinear optical process, including TPF, is proportional to the nth power of the intensity of the incident beam, where n depends on the type of nonlinear optical process. Owing to this nonlinear relationship between the signal and the incident intensity, when the incident beam is focused by the microscope objective, the generation of the signal is confined to the region adjacent to the focal points (Helmchen and Denk 2005; Oheim et al. 2006). As a result, even without a pinhole in a confocal microscope that cut the signal from the out-of-focal point region, one can achieve enough spatial resolution for the tomographic imaging by three-dimensional laser scanning. The signal generated by such a nonlinear optical process also depends on the pulse width and repetition rate of the laser. The narrower pulse width and higher repetition rate of the pulse beam result in the higher nonlinear optical signals including TPF (Helmchen and Denk 2005; Lefort 2017). Although it is still very expensive, commercial development in the early 2000s of stable and user-friendly high repetition rate lasers provided a significant boost to the usage of nonlinear optical microscopy. As the TPF microscope has established itself as a standard tool, the biological applications of the SHG microscope have also expanded (Pavone and Campagnola 2013).
As the SHG microscope is able to selectively observe the region in a sample where the spatial inversion symmetry is broken, it is a valuable tool for investigating the molecular ordering and structural organization in biological samples (Campagnola et al. 2002; Mohler et al. 2003). The main sources of endogenous SHG in biological samples are collagen (Campagnola 2013; Mansfield et al. 2019), myosin (Yokota et al. 2012; Vanzi et al. 2013), and microtubule (Kwan 2013), since their polar structures are organized by non-centrosymmetric structural proteins. SHG microscope has also been used for various medical applications such as the diagnosis of collagen-related diseases and the detection of tumor-associated collagen as a cancer biomarker (Pavone and Campagnola 2013; König 2018; Kirby et al. 2018).
Besides imaging by endogenous SHG, exogenous staining enables visualization of the plasma membranes and monitoring the change in the membrane potential under the SHG microscope (Campagnola et al. 1999; Moreaux et al. 2000, 2003; Dombeck et al. 2004; Nuriya et al. 2006, 2016; Vanzi et al. 2013). The distribution of lipid molecules between the outer and inner leaflet of the membrane bilayer is asymmetric (Bretscher 1973; Murate et al. 2015). This implies that the cellular membranes are non-centrosymmetric, i.e., SHG-active. However, the SHG signal can hardly be observed from the membranes, indicating that the asymmetric distribution of materials across the membrane (Murate et al. 2015) is not high enough to generate observable SHG signals. To enhance the SHG signal, the membranes are stained with amphiphilic polar dye molecules whose chromophore consists of one π-conjugated chain terminated by the electron donating and accepting moieties (D-π-A conjugation) (Reeve et al. 2010). As an example, the molecular structure of the dye (RH237) is shown in Fig. 2 (Kobayashi et al. 2002). Such dye molecules intercalate in the lipid bilayer perpendicular, pointing their polar axes in one direction via hydrophobic interaction as shown in Fig. 3. Note that the dye molecules diffuse through the plasma membrane into the cell. Specifically, the diffused dye molecules in the inner leaflet of the bilayer orient in the opposite direction to those in the outer leaflet and compensate the overall polar structure. However, the population of the dye molecule in the outer leaflet is higher than that in the inner leaflet, since the dye molecules are applied from the outside of the cell. The schematic in Fig. 3 shows only the excess dye molecules in the outer leaflet that are not compensated by the dye molecules in the inner leaflet and therefore are able to contribute to the SHG signal. Since the dye molecules used for the membrane imaging under the SHG microscope also exhibit fluorescence, the SHG and TPF images can be obtained simultaneously. When we compare the images, one can often notice that the TPF signal is generated from the membrane and cytosol of the cell, but the SHG signal is generated only from the membrane. This is because the dye molecules diffused into the cytosol adhere in the cell with random orientation, resulting in their SHG-inactive nature in the cytosol (Kobayashi et al. 2002; Vanzi et al. 2013).
Fig. 2.

N-(4-Sulfobutyl)-4-(6-(4-(dibutylamino)phenyl)hexatrienyl)pyridinium, inner salt (RH237). The chromophore consists of one π-conjugated chain terminated by the electron donating and accepting moieties (d-π-A conjugation)
Fig. 3.

Schematic presentation of the intercalation process of the amphiphilic dye molecules with the d-π-A conjugation in the plasma membrane
While the unidirectional alignment of the polar chromophores contributes to the SHG signal, the SHG intensity of the membrane depends on the electric field across the membrane due to the perturbation of electron distribution along the polar axis of the chromophores. This property leverages the membrane potential-sensitive imaging using the SHG signal. It was shown that the SHG imaging has higher sensitivity for monitoring the action potentials of living neurons against the various stimulus compared to the conventional fluorescence method. The non-fluorescent amphiphilic polar dye molecule was also designed not to hamper the multimodal imaging using the multiple fluorescence labelling during the monitoring of the membrane potential by the SHG imaging (Nuriya et al. 2016).
SHG-based assay for cell membrane damage
In addition to the above-mentioned applications, we proposed the SHG imaging as a tool for sensitive detection of membrane damage at the 2018 Joint Conference of the Asian Biophysical Association and the Australian Society for Biophysics (Cranfield 2019). The principle of the detection of membrane damage by SHG is introduced below.
The idea for the detection of membrane damage arose when the internalization of microparticles into HeLa cells was observed by the SHG microscope, and it was observed that the more the cell got attacked by the positively charged microparticles, the weaker the SHG intensity of the membrane became (Kato and Kondo 2018). When the plasma membrane was damaged by contact of toxic material, a disordering of the lipid molecules in the plasma membrane would be induced. Depending on the concentration or the exposure period of the toxic material, the degree of the disordering increases, the release of cytosol happens at some level, and finally, the lysis of cell occurs. When the amphiphilic dye molecules are introduced to the damaged membrane, the dye molecules also expected to intercalate into the membrane with a disordered manner similar to the disordered lipids as shown in Fig. 4. When the membrane without and with damage are compared (Figs. 3 and 4, respectively), the intercalated dye molecules are expected to be ordered in the former and less ordered in the latter. Therefore, the SHG intensity (ISHG) is highest in the non-damaged membrane and will decrease as the damage progresses. When the membrane is fully destroyed, resulting in a random orientation of the dye molecules, no SHG signal is expected. Thus, the membrane damage would be able to be monitored by the ISHG of the membrane exogenously SHG-activated by the amphiphilic polar dye molecule shown in Fig. 2.
Fig. 4.

Schematic presentation of the intercalation process of the amphiphilic dye molecules with the d-π-A conjugation in the disordered lipid bilayer
Demonstration of SHG-based assay
To induce the damage in the cell membrane, polyethyleneimine (PEI) was applied to HeLa cells. PEI is a polycation known to be cytotoxic (Parhamifar et al. 2014). PEI adheres on the cell surface whose net surface charge is negative, via electrostatic interactions and damages the plasma membrane. As a consequence, cytosolic components are released and the necrotic cell death is induced (Choksakulnimitr et al. 1995; Fischer et al. 2003). Therefore, PEI is regarded as an ideal membrane-damaging agent.
After the exposure of PEI to the HeLa cells, the cells were stained with RH237 (Fig. 2) and the imaging was carried out. The detailed conditions of cell culture and observation can be found in Electronic Supplementary Material. The bright field, SHG, and TPF images of HeLa cells after 1-h exposure to the PEI-containing medium at the different PEI concentrations (0.0 to 7.5 μg/mL) are shown in Fig. 5. These images were obtained at a certain z-position of the three-dimensional scan. When the bright field and SHG images of the non-damaged cells (Fig. 5a1, a2) were compared, it is evident that the SHG signals were mainly observed at the plasma membrane. This indicates that the SHG imaging allows the selective observation of the plasma membrane. On the other hand, the TPF image of the non-damaged cells (Fig. 5a3) shows that the TPF signals were observed not only from the plasma membrane but also from the cytosol. Therefore, the dye molecules diffused into the cells were randomly oriented and did not contribute to SHG.
Fig. 5.

Bright field, SHG, and TPF images of HeLa cells exposed to PEI for 1 h at the PEI concentration of (a1–a3) 0.0 μg/mL, (b1–b3) 0.5 μg/mL, (c1–c3) 1.0 μg/mL, (d1–d3) 1.5 μg/mL, (e1–e3) 2.5 μg/mL, (f1–f2) 5.0 μg/mL, and (g1–g3) 7.5 μg/mL. To visualize how the SHG intensity depended on the PEI concentration, brightness and contrast levels of all the above SHG images were adjusted to be the same, and the same treatment was applied to all the above TPF images
A series of the bright field images (Fig. 5a1–g1) show the harmful effect of PEI on cells. Above 2.5 μg/mL, the shape of the cells was observed to be changed where the cells shrunk into a round shape. The series of the SHG images (Fig. 5a2–g2) shows that the intensity decreased with increasing PEI concentration. Even at 1.0 μg/mL, the SHG image no longer showed the membranes clearly (Fig. 5c2), and the SHG signals were barely detected from the image at 7.5 μg/mL (Fig. 5g2). These two-dimensional observations at a certain z-position in the cells support that the damage level of the membrane can be assessed by the SHG imaging. To make the dependence of the SHG intensity clear, ISHG that represents the integrated SHG intensity through the three-dimensional scanning was plotted as a function of the PEI concentration in Fig. 6a. There is a clear trend that ISHG decreased as the PEI concentration increased, but the curve remained noisy. The three independent observations were made and 5 three-dimensional images were taken at each observation, i.e., 15 images in total were obtained for each PEI concentration. There were ~ 30 cells per image, and this gives about 450 cells at each PEI concentration. Although the data obtained from these cells were averaged, a smooth dependence of ISHG on the PEI concentration could not be obtained as expected (Fig. 6a).
Fig. 6.
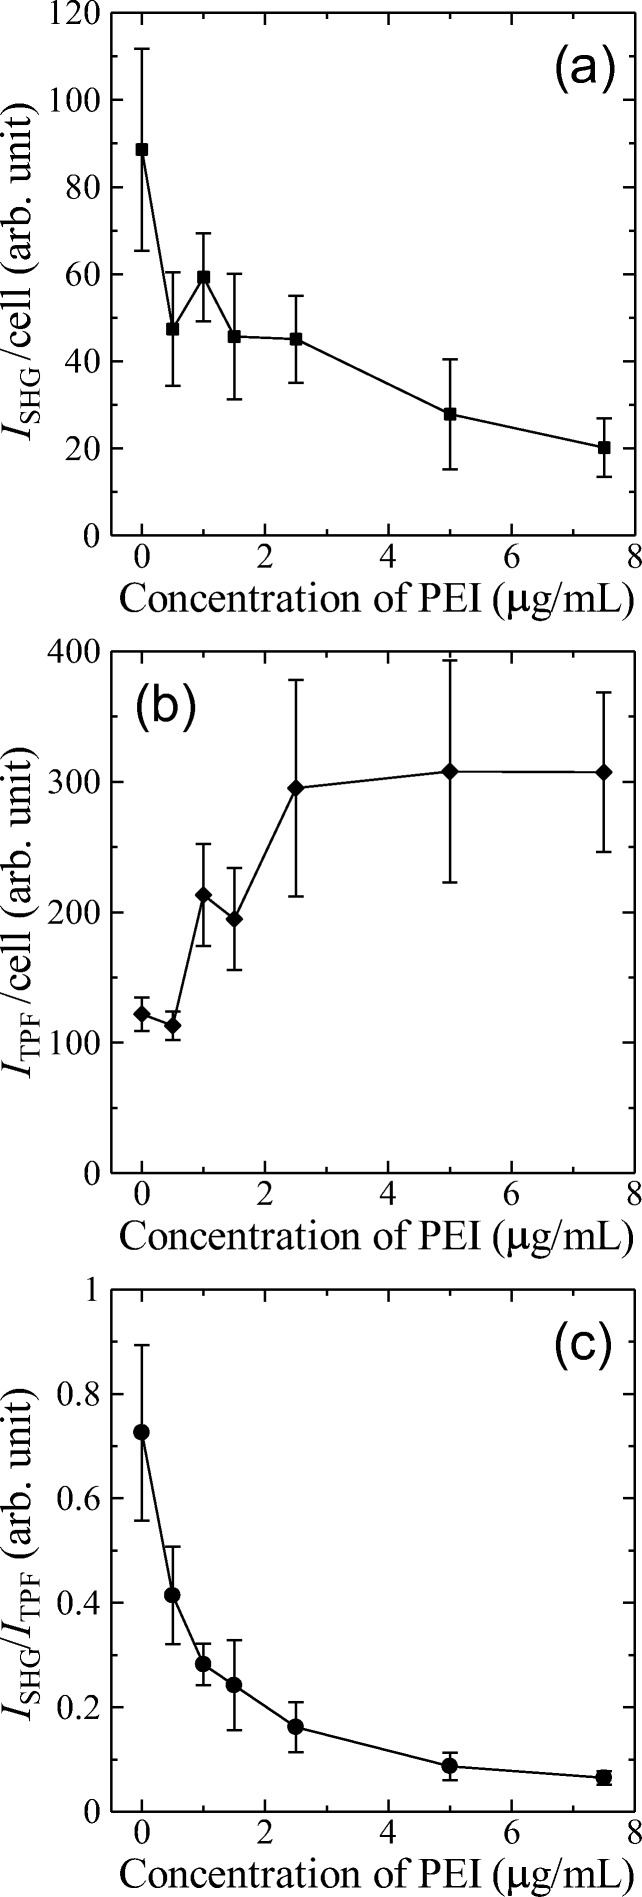
(a) Integrated SHG intensity (ISHG) per cell as a function of the PEI concentration. (b) Integrated TPF intensity (ITPF) per cell as a function of the PEI concentration. (c) ISHG normalized by ITPF (ISHG/ITPF) as a function of the PEI concentration. The error bars represent the standard deviation calculated from 15 data
In contrast to the SHG images that show a dependence on the PEI concentration, the dependence of the TPF signal on the PEI concentration could not be distinguished as shown in the series of TPF images (Fig. 5a3–g3). Although the TPF image at 0.0 μg/mL (Fig. 5a3) shows both membranes and cytosols, the TPF images above 1.0 μg/mL show the cytosols more clearly but the membranes are hardly seen (Fig. 5c3–g3). ITPF that represents the integrated TPF intensity over the three-dimensional image was also plotted as a function of the PEI concentration (Fig. 6b). There is a trend that ITPF increases as the PEI concentration increases up to 2.5 μg/mL. This trend is ascribed to the increase in the membrane permeability with the increasing membrane damage level. The trend in Fig. 6b implies that above 2.5 μg/mL, the dye molecules readily diffused into the cells owing to the lack of membrane integrity and saturation of the dye adsorption in the cytosol occurred. This is similar to that the dead cells were stained by the dye in the dye exclusion test (Pappenheimer 1917; Phillips 1973). As in Fig. 6a for ISHG, ITPF also does not show a smooth dependence on the PEI concentration. Because the ITPF is proportional to the number of the dye molecules, the discontinuous dependences in Fig. 6a, b could be ascribed to the fluctuation of the stain level at each observation. Not only the staining procedure but also the whole experimental process of this assay had been carefully revised several times, but the discontinuous dependence of the SHG and TPF intensities on the PEI concentration could not be excluded. Next, according to previous literature (Campagnola et al. 1999), ISHG was normalized by ITPF to compensate the fluctuation of the amount of dye molecule among the observations, and ISHG/ITPF was plotted as a function of the PEI concentration. As shown in Fig. 6c, ISHG/ITPF was observed to decrease continuously as the PEI concentration increases.
While ITPF is scaled by the number of molecules that contribute to TPF (NTPF), ISHG is scaled by the square of the number of molecules that contribute to SHG (NSHG2) (Moreaux et al. 2000). In our case, NTPF is not equal to NSHG, because the dye molecules in the cytosol contribute to TPF but not to SHG. Therefore, the normalization of ISHG by ITPF does not provide a full compensation of the fluctuation of the stain level but a mitigation of the scattering of data, and it has been shown in the present assay that the normalization by ITPF is apparently effective to investigate the precise change in the signal level of SHG.
SHG-based assay versus conventional assay
The results obtained by the proposed method have been compared with the conventional cytotoxic assays, i.e., the cytosolic enzyme release assay and the cell metabolic assay. The former assesses the membrane damage by measuring the amount of the one of the cytosolic enzyme, lactate dehydrogenase (LDH), released in the medium owing to the loss of membrane integrity (Korzeniewski and Callewaert 1983). The latter assesses the mitochondrial activity by using the water-soluble tetrazolium (WST) which transforms into formazan by the reduction reaction induced by the mitochondrial dehydrogenase in the living cells (Ishiyama et al. 1997). This WST assay is the improved version of the well-known MTT assay (Slater et al. 1963; Mosmann 1983).
The cytotoxicity and the cell viability against PEI were assessed by the LDH release assay and the WST assay, respectively, using HeLa cells and the same media. The detailed conditions of the assays can be found in Electronic Supplementary Material. Figure 7a shows the cytotoxicity determined by the LDH release assay. As the PEI concentration increases, the cytotoxicity (the release of LDH) increases, and the dependences of the cytotoxicity and ISHG/ITPF on the PEI concentration show a good negative correlation with each other. Figure 7b shows the cell viability determined by the WST assay. As the PEI concentration increases, the viability decreases, and the dependences of the viability and ISHG/ITPF on the PEI concentration show a good positive correlation with each other as expected.
Fig. 7.
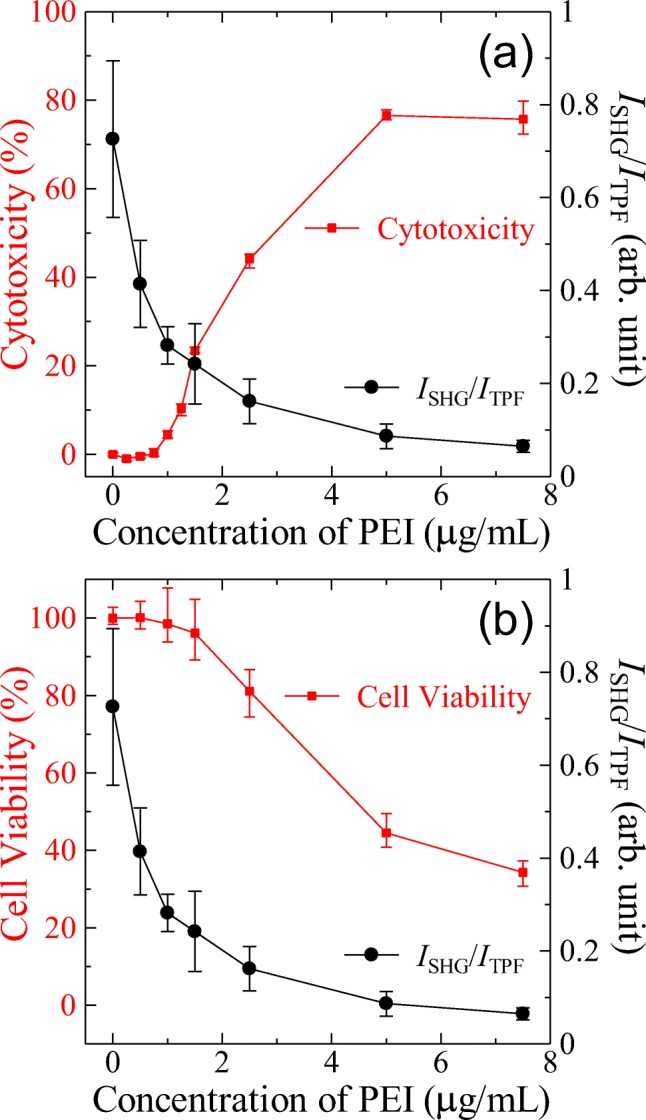
(a) Square plots indicate the PEI-induced cytotoxicity determined by the LDH release assay. Circle plots indicate ISHG/ITPF obtained by the nonlinear optical imaging for the comparison. (b) Square plots indicate the cell viability after the PEI exposure determined by the WST assay. Circle plots indicate ISHG/ITPF obtained by the nonlinear optical imaging for the comparison. Each plot is obtained by averaging the three measurements, and the error bars show the max and min. For the plots of ISHG/ITPF, see Fig. 6 and main text
Overall, a good correlation exists between the ISHG/ITPF and the two conventional assays. However, in the lower concentration region, there are notable differences. The two conventional assays show almost no responses against the exposure to PEI below 1.0 μg/mL, while the SHG-based assay shows a significant decrease in ISHG/ITPF from 0.0 to 1.0 μg/mL. This difference clearly shows the higher sensitivity of the SHG-based assay compared to the two conventional assays. The reason for this higher sensitivity can be explained by the dependence of the SHG signal on the lipid ordering in the membrane. Even the concentration of PEI was not high enough and the membrane damage was insignificant to release the cytosolic components and reduce the metabolic activity; the contact between the membrane and PEI perturbs the alignment of the lipid molecules in the membrane, inducing a disorder at the molecular level of the lipid alignment. Hence, the advantage of the proposed assay lies at the change of molecular level ordering that can be detected as SHG is sensitive to the symmetry and ordering of the polar molecules.
Summary and perspective
After a brief overview of the history of SHG and SHG microscope, the application of nonlinear optical processes in the field of bioimaging has been summarized. Under a SHG microscope, both the endogenously SHG-active components in biological tissues and plasma membranes stained by the polar dye molecules can be observed. Using this exogenous staining technique, an analytical method to assess the membrane damage has been introduced as a novel application of the SHG microscope (Cranfield 2019). While the membrane damage at a low toxin concentration remained difficult to detect by the conventional cytotoxicity and cell viability assays, this could be detected by the SHG-based assay. This method is expected to lay the foundation for the real-time observation of how toxins induce damage into the cell membranes or how the cells reconstruct the damaged membranes using the SHG microscope. The application of the nonlinear optics to biology is not limited to imaging. The development of nonlinear optical flow cytometry is also being progressed (Tkaczyk and Tkaczyk 2011; Collier et al. 2015; Hiramatsu et al. 2019), and integration of the SHG-based assay into the nonlinear optical flow cytometry would be an interesting application (Awasthi et al. 2012).
The bioimaging by endogenous SHG had been well developed and will be applied to the various diagnosis. Further expansion of SHG imaging will be promoted by the development of exogenously SHG-activating agents other than the amphiphilic polar dye molecules for the membrane. Likely to the fluorescence labelling in the TPF imaging, use of SHG-active nanoparticles for SHG labelling is also interesting for the SHG imaging (Cohen 2010).
Electronic supplementary material
(PDF 476 kb)
Acknowledgements
The author acknowledges Associate Professor Y. Mukai for her support of the cell culture, Associate Professor H. Kudo for use of the microplate reader, and R. Kondo and H. Soga for their experimental assistance.
Compliance with ethical standards
Funding
This work was funded by The Institute of Science and Technology, Meiji University and JSPS KAKENHI Grant Number 16K01399.
Conflict of interest
Noritaka Kato declares that he has no conflict of interest.
Ethical approval
This article does not contain any studies with human participants and animals performed by the author.
Footnotes
Publisher’s note
Springer Nature remains neutral with regard to jurisdictional claims in published maps and institutional affiliations.
References
- Armstrong JA, Bloembergen N, Ducuing J, Pershan PS. Interactions between light waves in a nonlinear dielectric. Phys Rev. 1962;127:1918–1939. doi: 10.1103/PhysRev.127.1918. [DOI] [Google Scholar]
- Awasthi S, Matthews DL, Li RA, et al. Label-free identification and characterization of human pluripotent stem cell-derived cardiomyocytes using second harmonic generation (SHG) microscopy. J Biophotonics. 2012;5:57–66. doi: 10.1002/jbio.201100077. [DOI] [PMC free article] [PubMed] [Google Scholar]
- Bass M, Franken PA, Hill AE, et al. Optical mixing. Phys Rev Lett. 1962;8:18–18. doi: 10.1103/PhysRevLett.8.18. [DOI] [Google Scholar]
- Bloembergen N. Surface nonlinear optics: a historical overview. Appl Phys B Lasers Opt. 1999;68:289–293. doi: 10.1007/s003400050621. [DOI] [Google Scholar]
- Bloembergen N, Pershan PS. Light waves at the boundary of nonlinear media. Phys Rev. 1962;128:606–622. doi: 10.1103/PhysRev.128.606. [DOI] [Google Scholar]
- Boyd GT, Shen YR, Hänsch TW. Continuous-wave second-harmonic generation as a surface microprobe. Opt Lett. 1986;11:97–99. doi: 10.1364/OL.11.000097. [DOI] [PubMed] [Google Scholar]
- Bretscher MS. Membrane structure: some general principles. Science. 1973;181:622–629. doi: 10.1126/science.181.4100.622. [DOI] [PubMed] [Google Scholar]
- Brown F, Parks RE, Sleeper AM. Nonlinear optical reflection from a metallic boundary. Phys Rev Lett. 1965;14:1029–1031. doi: 10.1103/PhysRevLett.14.1029. [DOI] [Google Scholar]
- Campagnola PJ. Second harmonic generation imaging. 1. Boca Raton, London, New York: CRC Press, Taylor & Francis Group; 2013. 3D SHG imaging and analysis of fibrillar collagen organization; pp. 125–150. [Google Scholar]
- Campagnola PJ, Wei M, Lewis A, Loew LM. High-resolution nonlinear optical imaging of live cells by second harmonic generation. Biophys J. 1999;77:3341–3349. doi: 10.1016/S0006-3495(99)77165-1. [DOI] [PMC free article] [PubMed] [Google Scholar]
- Campagnola PJ, Millard AC, Terasaki M, et al. Three-dimensional high-resolution second-harmonic generation imaging of endogenous structural proteins in biological tissues. Biophys J. 2002;82:493–508. doi: 10.1016/S0006-3495(02)75414-3. [DOI] [PMC free article] [PubMed] [Google Scholar]
- Choksakulnimitr S, Masuda S, Tokuda H, et al. In vitro cytotoxicity of macromolecules in different cell culture systems. J Control Release. 1995;34:233–241. doi: 10.1016/0168-3659(95)00007-U. [DOI] [Google Scholar]
- Cohen BE. Beyond fluorescence. Nature. 2010;467:407. doi: 10.1038/467407a. [DOI] [PubMed] [Google Scholar]
- Collier BB, Awasthi S, Lieu DK, Chan JW. Non-linear optical flow cytometry using a scanned, bessel beam lights-sheet. Sci Rep. 2015;5:10751. doi: 10.1038/srep10751. [DOI] [PMC free article] [PubMed] [Google Scholar]
- Cranfield Charles G. ABA/ASB Membrane Biophysics session II 2018. Biophysical Reviews. 2019;11(3):281–282. doi: 10.1007/s12551-019-00516-3. [DOI] [PMC free article] [PubMed] [Google Scholar]
- Denk W, Strickler JH, Webb WW. Two-photon laser scanning fluorescence microscopy. Science. 1990;248:73–76. doi: 10.1126/science.2321027. [DOI] [PubMed] [Google Scholar]
- Dolino G. Direct observation of ferroelectric domains in TGS with second-harmonic light. Appl Phys Lett. 1973;22:123–124. doi: 10.1063/1.1654581. [DOI] [Google Scholar]
- Dombeck DA, Blanchard-Desce M, Webb WW. Optical recording of action potentials with second-harmonic generation microscopy. J Neurosci. 2004;24:999. doi: 10.1523/JNEUROSCI.4840-03.2004. [DOI] [PMC free article] [PubMed] [Google Scholar]
- Ducuing J, Bloembergen N. Observation of reflected light harmonics at the boundary of piezoelectric crystals. Phys Rev Lett. 1963;10:474–476. doi: 10.1103/PhysRevLett.10.474. [DOI] [Google Scholar]
- Fiebig M., Fröhlich D., Sluyterman v. L. G., Pisarev R. V. Domain topography of antiferromagnetic Cr2O3 by second‐harmonic generation. Applied Physics Letters. 1995;66(21):2906–2908. doi: 10.1063/1.113699. [DOI] [Google Scholar]
- Fiebig M, Pavlov VV, Pisarev RV. Second-harmonic generation as a tool for studying electronic and magnetic structures of crystals: review. J Opt Soc Am B. 2005;22:96–118. doi: 10.1364/JOSAB.22.000096. [DOI] [Google Scholar]
- Fischer D, Li Y, Ahlemeyer B, et al. In vitro cytotoxicity testing of polycations: influence of polymer structure on cell viability and hemolysis. Biomaterials. 2003;24:1121–1131. doi: 10.1016/S0142-9612(02)00445-3. [DOI] [PubMed] [Google Scholar]
- Flörsheimer M. Second-harmonic microscopy: new tool for the remote sensing of interfaces. Phys Status Solidi A. 1999;173:15–27. doi: 10.1002/(SICI)1521-396X(199905)173:1<15::AID-PSSA15>3.0.CO;2-8. [DOI] [Google Scholar]
- Flörsheimer M, Looser H, Küpfer M, Günter P. In situ imaging of Langmuir monolayers by second-harmonic microscopy. Thin Solid Films. 1994;244:1001–1006. doi: 10.1016/0040-6090(94)90619-X. [DOI] [Google Scholar]
- Flörsheimer M., Paschotta R., Kubitscheck U., Brillert C., Hofmann D., Heuer L., Schreiber G., Verbeek C., Sohler W., Fuchs H. Second-harmonic imaging of ferroelectric domains in LiNbO 3 with micron resolution in lateral and axial directions. Applied Physics B: Lasers and Optics. 1998;67(5):593–599. doi: 10.1007/s003400050552. [DOI] [Google Scholar]
- Franken PA, Hill AE, Peters CW, Weinreich G. Generation of optical harmonics. Phys Rev Lett. 1961;7:118–119. doi: 10.1103/PhysRevLett.7.118. [DOI] [Google Scholar]
- Freund I, Deutsch M. Second-harmonic microscopy of biological tissue. Opt Lett. 1986;11:94–96. doi: 10.1364/OL.11.000094. [DOI] [PubMed] [Google Scholar]
- Hellwarth R, Christensen P. Nonlinear optical microscopic examination of structure in polycrystalline ZnSe. Opt Commun. 1974;12:318–322. doi: 10.1016/0030-4018(74)90024-8. [DOI] [Google Scholar]
- Helmchen F, Denk W. Deep tissue two-photon microscopy. Nat Methods. 2005;2:932–940. doi: 10.1038/nmeth0306-235. [DOI] [PubMed] [Google Scholar]
- Hiramatsu K, Ideguchi T, Yonamine Y, et al. High-throughput label-free molecular fingerprinting flow cytometry. Sci Adv. 2019;5:eaau0241. doi: 10.1126/sciadv.aau0241. [DOI] [PMC free article] [PubMed] [Google Scholar]
- Ishiyama M, Miyazono Y, Sasamoto K, et al. A highly water-soluble disulfonated tetrazolium salt as a chromogenic indicator for NADH as well as cell viability. Talanta. 1997;44:1299–1305. doi: 10.1016/S0039-9140(97)00017-9. [DOI] [PubMed] [Google Scholar]
- Jacques SL. Optical properties of biological tissues: a review. Phys Med Biol. 2013;58:R37–R61. doi: 10.1088/0031-9155/58/11/r37. [DOI] [PubMed] [Google Scholar]
- Kaiser W, Garrett CGB. Two-photon excitation in CaF2: Eu2+ Phys Rev Lett. 1961;7:229–231. doi: 10.1103/PhysRevLett.7.229. [DOI] [Google Scholar]
- Kato N, Kondo R. Cellular internalization of polycation-coated microparticles and its dependence on their zeta potential. Jpn J Appl Phys. 2018;57:03EK03. doi: 10.7567/jjap.57.03ek03. [DOI] [Google Scholar]
- Kato N, Saito K, Aida H, Uesu Y. Observations of merocyanine J-aggregate domains in mixed molecular monolayers using SHG/fluorescence and atomic force microscopes. Chem Phys Lett. 1999;312:115–120. doi: 10.1016/S0009-2614(99)00956-2. [DOI] [Google Scholar]
- Kato N, Saito K, Uesu Y. Optical second harmonic images of merocyanine J-aggregate monolayers at the air–water interface. Thin Solid Films. 1999;338:5–8. doi: 10.1016/S0040-6090(98)01164-X. [DOI] [Google Scholar]
- Kawakami R, Sawada K, Sato A, et al. Visualizing hippocampal neurons with in vivo two-photon microscopy using a 1030 nm picosecond pulse laser. Sci Rep. 2013;3:1014. doi: 10.1038/srep01014. [DOI] [PMC free article] [PubMed] [Google Scholar]
- Kirby RC, Rajeev C, Julia MH, et al. Polarization-resolved second harmonic generation imaging of human ovarian cancer. J Biomed Opt. 2018;23:1–8. doi: 10.1117/1.JBO.23.6.066501. [DOI] [PMC free article] [PubMed] [Google Scholar]
- Kobayashi M, Fujita K, Kaneko T, et al. Second-harmonic-generation microscope with a microlens array scanner. Opt Lett. 2002;27:1324–1326. doi: 10.1364/OL.27.001324. [DOI] [PubMed] [Google Scholar]
- König K. Multiphoton microscopy and fluorescence lifetime imaging, applications in biology and medicine. Berlin, Boston: De Gruyter; 2018. [Google Scholar]
- Korzeniewski C, Callewaert DM. An enzyme-release assay for natural cytotoxicity. J Immunol Methods. 1983;64:313–320. doi: 10.1016/0022-1759(83)90438-6. [DOI] [PubMed] [Google Scholar]
- Kurimura S, Uesu Y. Application of the second harmonic generation microscope to nondestructive observation of periodically poled ferroelectric domains in quasi-phase-matched wavelength converters. J Appl Phys. 1997;81:369–375. doi: 10.1063/1.364121. [DOI] [Google Scholar]
- Kwan AC. Second harmonic generation imaging. 1. Boca Raton, London New York: CRC Press, Taylor & Francis Group; 2013. Second-harmonic generation imaging of microtubules; pp. 151–168. [Google Scholar]
- Lefort C. A review of biomedical multiphoton microscopy and its laser sources. J Phys D Appl Phys. 2017;50:423001. doi: 10.1088/1361-6463/aa8050. [DOI] [Google Scholar]
- Manaka T, Lim E, Tamura R, Iwamoto M. Direct imaging of carrier motion in organic transistors by optical second-harmonic generation. Nat Photonics. 2007;1:581–584. doi: 10.1038/nphoton.2007.172. [DOI] [Google Scholar]
- Mansfield JC, Mandalia V, Toms A, et al. Collagen reorganization in cartilage under strain probed by polarization sensitive second harmonic generation microscopy. J R Soc Interface. 2019;16:20180611. doi: 10.1098/rsif.2018.0611. [DOI] [PMC free article] [PubMed] [Google Scholar]
- Miller RC. Optical harmonic generation in single crystal BaTiO3. Phys Rev. 1964;134:A1313–A1319. doi: 10.1103/PhysRev.134.A1313. [DOI] [Google Scholar]
- Mohler W, Millard AC, Campagnola PJ. Second harmonic generation imaging of endogenous structural proteins. Methods. 2003;29:97–109. doi: 10.1016/S1046-2023(02)00292-X. [DOI] [PubMed] [Google Scholar]
- Moreaux L, Sandre O, Mertz J. Membrane imaging by second-harmonic generation microscopy. J Opt Soc Am B. 2000;17:1685–1694. doi: 10.1364/JOSAB.17.001685. [DOI] [Google Scholar]
- Moreaux L, Pons T, Dambrin V, et al. Electro-optic response of second-harmonic generation membrane potential sensors. Opt Lett. 2003;28:625–627. doi: 10.1364/OL.28.000625. [DOI] [PubMed] [Google Scholar]
- Mosmann T. Rapid colorimetric assay for cellular growth and survival: application to proliferation and cytotoxicity assays. J Immunol Methods. 1983;65:55–63. doi: 10.1016/0022-1759(83)90303-4. [DOI] [PubMed] [Google Scholar]
- Murate M, Abe M, Kasahara K, et al. Transbilayer distribution of lipids at nano scale. J Cell Sci. 2015;128:1627–1638. doi: 10.1242/jcs.163105. [DOI] [PubMed] [Google Scholar]
- Nuriya M, Jiang J, Nemet B, et al. Imaging membrane potential in dendritic spines. Proc Natl Acad Sci U S A. 2006;103:786–790. doi: 10.1073/pnas.0510092103. [DOI] [PMC free article] [PubMed] [Google Scholar]
- Nuriya M, Fukushima S, Momotake A, et al. Multimodal two-photon imaging using a second harmonic generation-specific dye. Nat Commun. 2016;7:11557. doi: 10.1038/ncomms11557. [DOI] [PMC free article] [PubMed] [Google Scholar]
- Oheim M, Michael DJ, Geisbauer M, et al. Principles of two-photon excitation fluorescence microscopy and other nonlinear imaging approaches. Multi-Photon Imaging Dis Ther. 2006;58:788–808. doi: 10.1016/j.addr.2006.07.005. [DOI] [PubMed] [Google Scholar]
- Pappenheimer AM. Experimantal studies upon lymphocytes: I The reactions of lymphocytes under various experimental conditions. J Exp Med. 1917;25:633–650. doi: 10.1084/jem.25.5.633. [DOI] [PMC free article] [PubMed] [Google Scholar]
- Parhamifar L, Andersen H, Wu L, et al. Chapter twelve - Polycation-mediated integrated cell death processes. In: Liu D, Wagner E, et al., editors. Huang L. Advances in Genetics: Academic Press; 2014. pp. 353–398. [DOI] [PubMed] [Google Scholar]
- Pavone FS, Campagnola PJ, editors. Second harmonic generation imaging. 1. CRC Press, Taylor & Francis Group: Boca Raton, London,New York; 2013. [Google Scholar]
- Pellicer Adelina, Bravo María del Carmen. Near-infrared spectroscopy: A methodology-focused review. Seminars in Fetal and Neonatal Medicine. 2011;16(1):42–49. doi: 10.1016/j.siny.2010.05.003. [DOI] [PubMed] [Google Scholar]
- Pershan PS. Nonlinear optical properties of solids: energy considerations. Phys Rev. 1963;130:919–929. doi: 10.1103/PhysRev.130.919. [DOI] [Google Scholar]
- Peticolas WL, Goldsborough JP, Rieckhoff KE. Double photon excitation in organic crystals. Phys Rev Lett. 1963;10:43–45. doi: 10.1103/PhysRevLett.10.43. [DOI] [Google Scholar]
- Phillips Hugh J. Tissue Culture. 1973. Dye Exclusion Tests for Cell Viability; pp. 406–408. [Google Scholar]
- Reeve JE, Anderson HL, Clays K. Dyes for biological second harmonic generation imaging. Phys Chem Chem Phys. 2010;12:13484–13498. doi: 10.1039/C003720F. [DOI] [PubMed] [Google Scholar]
- Rieckhoff KE, Peticolas WL. Optical second-harmonic generation in crystalline amino acids. Science. 1965;147:610–611. doi: 10.1126/science.147.3658.610. [DOI] [PubMed] [Google Scholar]
- Savage A, Miller RC. Measurements of second harmonic generation of the ruby laser line in piezoelectric crystals. Appl Opt. 1962;1:661–664. doi: 10.1364/AO.1.000661. [DOI] [Google Scholar]
- Shen YR. The principles of nonlinear optics. New York: Wiley-Interscience; 1984. [Google Scholar]
- Shen YR. Surface properties probed by second-harmonic and sum-frequency generation. Nature. 1989;337:519–525. doi: 10.1038/337519a0. [DOI] [Google Scholar]
- Shen YR. Surface nonlinear optics: a historical perspective. IEEE J Sel Top Quantum Electron. 2000;6:1375–1379. doi: 10.1109/2944.902191. [DOI] [Google Scholar]
- Slater TF, Sawyer B, Sträuli U. Studies on succinate-tetrazolium reductase systems: III. Points of coupling of four different tetrazolium salts III. Points of coupling of four different tetrazolium salts. Biochim Biophys Acta. 1963;77:383–393. doi: 10.1016/0006-3002(63)90513-4. [DOI] [PubMed] [Google Scholar]
- Smilowitz L, Jia QX, Yang X, et al. Imaging nanometer-thick patterned self-assembled monolayers via second-harmonic generation microscopy. J Appl Phys. 1997;81:2051–2054. doi: 10.1063/1.364284. [DOI] [Google Scholar]
- Tkaczyk ER, Tkaczyk AH. Multiphoton flow cytometry strategies and applications. Cytometry A. 2011;79A:775–788. doi: 10.1002/cyto.a.21110. [DOI] [PubMed] [Google Scholar]
- Uesu Y, Kato N. Multi-purpose nonlinear optical microscope. Its principle and applications to polar thin-film observation. Phys Solid State. 1999;41:688–692. doi: 10.1134/1.1130850. [DOI] [Google Scholar]
- Uesu Y., Kurimura S., Yamamoto Y. Optical second harmonic images of 90° domain structure in BaTiO3 and periodically inverted antiparallel domains in LiTaO3. Applied Physics Letters. 1995;66(17):2165–2167. doi: 10.1063/1.113934. [DOI] [Google Scholar]
- Uesu Yoshiaki, Yokota Hiroko, Kawado Satoshi, Kaneshiro Junichi, Kurimura Sunao, Kato Noritaka. Three-dimensional observations of periodically poled domains in a LiTaO3 quasiphase matching crystal by second harmonic generation tomography. Applied Physics Letters. 2007;91(18):182904. doi: 10.1063/1.2786589. [DOI] [Google Scholar]
- Vanzi F, Sacconi L, Cicchi R, et al. Second harmonic generation imaging. 1. Boca Raton, London, New York: CRC Press, Taylor & Francis Group; 2013. Molecular structure and order with second-harmonic generation microscopy; pp. 103–124. [Google Scholar]
- Weinigel M, Breunig H G, Kellner-Höfer M, Bückle R, Darvin M E, Klemp M, Lademann J, König K. In vivohistology: optical biopsies with chemical contrast using clinical multiphoton/coherent anti-Stokes Raman scattering tomography. Laser Physics Letters. 2014;11(5):055601. doi: 10.1088/1612-2011/11/5/055601. [DOI] [Google Scholar]
- Williams RM, Zipfel WR, Webb WW. Multiphoton microscopy in biological research. Curr Opin Chem Biol. 2001;5:603–608. doi: 10.1016/S1367-5931(00)00241-6. [DOI] [PubMed] [Google Scholar]
- Yokota H, Kaneshiro J, Uesu Y. Optical second harmonic generation microscopy as a tool of material diagnosis. Physiother Res Int. 2012;2012:704634. doi: 10.1155/2012/704634. [DOI] [Google Scholar]
Associated Data
This section collects any data citations, data availability statements, or supplementary materials included in this article.
Supplementary Materials
(PDF 476 kb)