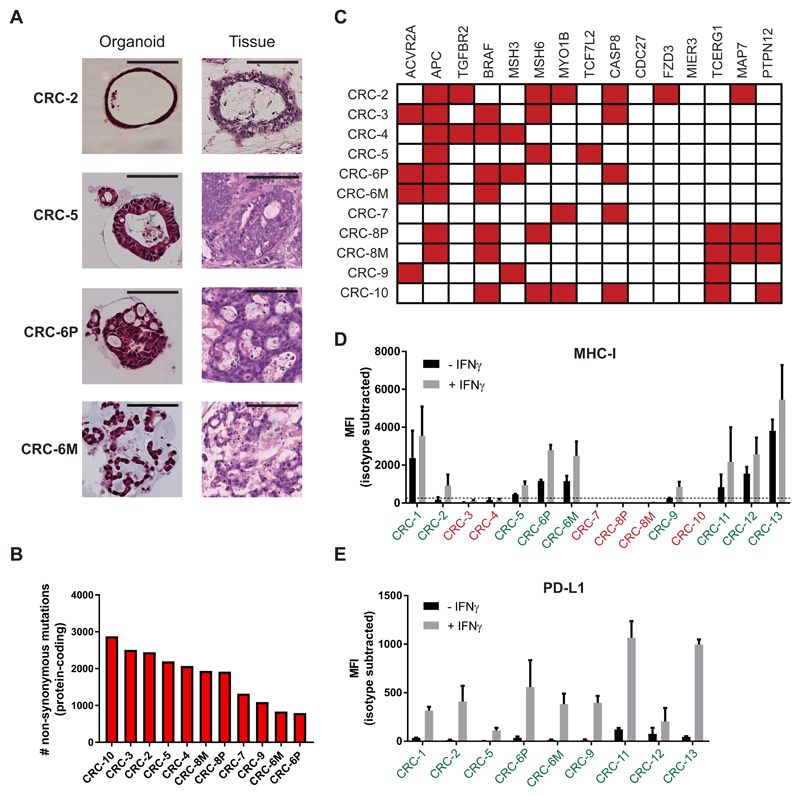
Figure 1. Characterization of a panel of dMMR CRC organoids.
(A) Haematoxylin and eosin (H&E) staining of tumor organoids and original tumor tissue. Organoids show morphology similar to the architecture of the original tumor. CRC-2 organoids demonstrates cystic tubules similar to mucin-filled glands of the primary tumor. CRC-5 organoids and primary tumor are composed of tubular glands with layered epithelium. Organoid CRC-6P is composed of complex cribriform glands, also seen in the primary tumor. Organoid CRC-6M consists of irregular trabecular structures and poorly formed glands, similar to the metastasis. Scale bar = 100 μm.
(B) Mutational load of tumor organoids as determined by the number of non-synonymous mutations per tumor exome.
(C) Mutation status of genes significantly mutated in hypermutated colorectal cancer according to TCGA 2012. Mutated genes are indicated in red.
(D) Cell surface MHC-I expression as determined by flow cytometry. Organoids were stimulated with 200 ng/mL IFNγ for 24 hours or left unstimulated. Bar graphs indicate median fluorescence intensity (MFI) of anti-HLA-A,B,C-PE minus MFI of isotype control. Tumor organoids with MFI < 250 above isotype control (dashed line) were classified as MHC-I deficient (indicated in red). Error bars indicate s.e.m. of at least two independent experiments.
(E) Cell surface PD-L1 expression as determined by flow cytometry. Organoids were stimulated with 200 ng/mL IFNγ for 24 hours or left unstimulated. Bar graphs indicate median fluorescence intensity (MFI) of anti-PD-L1-APC minus MFI of isotype control. Error bars indicate s.e.m. of at least two independent experiments.
See also Figures S1-S2 and Tables S1-S2.

