

Abstract
Objective
Imaging plays a role in myositis assessment by detecting muscle changes indicative of pathology. This study was conducted to determine the ultrasonographic pattern of muscle involvement in patients with inclusion body myositis ( IBM) through an assessment of muscle echointensity.
Methods
Sixty-two individuals were consecutively studied, 18 with IBM, 16 with polymyositis or dermatomyositis and 28 normal controls. Standardised scans were completed bilaterally for the deltoids, biceps, flexor digitorum profundus (FDP), flexor carpi ulnaris, rectus femoris, tibialis anterior and gastrocnemius assessing for muscle echointensity changes.
Results
Patients with IBM had a markedly increased muscle echointensity when compared with comparator groups for all muscles studied. This was most discriminating at the FDP, gastrocnemius and rectus femoris. Asymmetry between sides and a heterogeneously increased echointensity were also seen.
Conclusion
Ultrasonography can aid in the assessment of IBM by displaying an increased echointensity in characteristically involved muscles, particularly when combined with assessments for asymmetry and echotexture.
Keywords: muscle ultrasound, inclusion body myositis, myositis, sonography, myopathy
Introduction
Inclusion body myositis is the most common form of idiopathic inflammatory myopathy in patients over the age of 45 (1). IBM may be initially misdiagnosed as polymyositis (PM), particularly in the early stages of the disease when muscle biopsy findings are nonspecific and the characteristic IBM pattern of weakness is not apparent. Because IBM is currently considered treatment refractory with a lack of sustained improvement with immunosuppressive regimens, making a correct diagnosis from the onset is imperative to reduce potential medication-related morbidity. Diagnostic criteria for IBM has evolved over the last few years from a heavy reliance on muscle histopathology findings to an increased importance placed on clinical presentation (2). When the typical clinical findings of slowly progressive weakness with involvement of the quadriceps and distal forearm muscles is seen, the diagnosis is rarely in question. However, for atypical or early cases where classic histopathologic changes are also not observed, imaging can play an important role in identifying subclinical muscle involvement and may provide insight into different stages of the disease. Magnetic resonance imaging (MRI) studies in IBM have shown fatty infiltration and atrophy of involved muscles, but also muscle oedema (3). Typical patterns of involvement have also been described including predilection for the anterior muscle groups, lower limb involvement more than upper limb, distal predominance, and selective involvement of the flexor digitorum profundus (FDP) and medial gastrocnemius (3–7).
As a bedside and inexpensive imaging tool, muscle sonography has had an expanding role in the assessment of myopathies, with an increased echointensity seen in diseased muscle (8). Given the nature of the disease with continued accrual of pathology over time, IBM is an attractive model to search for diagnostic patterns on ultrasonography. Few studies on sporadic inclusion body myositis however, have been done. Two recent reports focused on known areas of abnormality as noted on MRI, particularly the FDP muscle in the forearm (9) and the gastrocnemius muscle in the leg (10). These small studies convincingly displayed pathologic involvement of these muscle groups in IBM, and the use of ultrasound in assisting with unclear cases of IBM in practice has been advocated (11). To further investigate the clinical utility of ultrasound in IBM, we conducted this study to determine the pattern and distribution of muscle involvement in IBM patients using a standardised protocol and sought to identify relevant imaging features.
Materials and methods
Patients
Sixty-two subjects were recruited during the period of August 2015 to May 2016. The Johns Hopkins Institutional Review Board approved the study and all participants provided signed informed consent prior to any study procedures. Patients with myositis were recruited from the Johns Hopkins Myositis Center in Baltimore, Maryland. All patients with IBM in this study had undergone muscle biopsies and met 2011 European Neuromuscular Center (ENMC) Criteria for clinicopathologic or clinically defined IBM (12). None of the IBM patients were on active immunosuppression at the time of evaluation. Patients were classified as dermatomyositis (DM) if they met Bohan and Peter criteria for definite or probable dermatomyositis (13, 14), DM by muscle biopsy using European Neuromuscular Centre (ENMC) criteria (15), or carried a DM specific antibody. Patients were classified as polymyositis (PM) if they met Bohan and Peter criteria for PM with a compatible muscle biopsy, carried a myositis specific or associated antibody, and were not DM or IBM. All patients with DM and PM were on treatment and showed response to immunosuppression. The immune-mediated necrotising myopathies were classified as PM for the purposes of this study.
For patients with myositis, creatine phosphokinase (CPK) level closest to the time of ultrasound evaluation was recorded (within 4 weeks), along with duration of symptoms of weakness (in months). All subjects underwent muscle strength testing, graded for 15 muscle groups using the Medical Research Council scale and transformed to a modified Kendall’s 0–10 scale (16). Functional capacity was estimated with the use of the Duke Activity Status Index (DASI) where the higher the score, the more active the patient (17).
Equipment
Studies were carried out using a GE Logiq e (GE, Fairfield, CT, USA) with 12L linear phased array transducer by one examiner (JA), a rheumatologist with 5 years of musculoskeletal ultrasound experience. Studies were completed using a single machine. All system-setting parameters were kept constant throughout the study with a gain of 40dB, frequency of 10Mhz, dynamic range of 87, grey map of H/O with cross beam and enhancers turned off to standardise any influences on muscle echointensity. Four focal zones were spread out evenly across the image, and depth was held constant at 6cm for the rectus muscle and 4cm for all the other muscle groups. A generous amount of contact gel was used for acoustic coupling and to prevent excessive pressure on the underlying tissue. To ensure that images were acquired perpendicular to the muscle, they were captured at the angle where the underlying bone was most distinct as described (18). Given the anisotropic nature of muscle and changes in echointensity with even slight changes in angle, three images were captured of each muscle with the probe lifted and re-applied for each image.
Study protocol
A total of 14 muscle groups were imaged per patient, 7 on each side. This included the deltoids, biceps, flexor carpi radialis (FCR), FDP, rectus femoris, tibialis anterior and gastrocnemius muscles. These extremity muscles were chosen to include those with known involvement in myositis, as well as to provide a gradient that could differentiate proximal from distal predominance. Although more muscles could have been imaged, this study was carried out in the context of developing a protocol feasible for clinical use in myositis evaluation. Images on both sides were obtained to assess for asymmetry.
A standardised protocol (patterned after (19)) was carried out whereby muscle groups were imaged transversely at measured points: deltoids at ¼ distance from acromion to antecubital crease, biceps at 2/3 distance from acromion to antecubital crease, FCR at 1/3 of distance from antecubital crease to distal radius, FDP at 5cm from edge of olecranon (as described in (9)), rectus femoris at ½ distance from anterior superior iliac spine to upper pole of patella, tibialis anterior at 1/3 distance from lower border of patella to the lateral malleolus, and the gastrocnemius at 1/3 of the distance from popliteal fossa to medial malleolus. Patients were examined in a supine position with the muscles relaxed.
Measurement of echointensity
Quantitative muscle ultrasound was employed for echointensity analysis and performed on saved images. The ITK-SNAP software (20) (Kitware, Clifton Park, NY, USA) was used to manually delineate (segment) desired muscles. Segmented regions were used to compute muscle echointensities through MATLAB (Mathworks, Natick, MA) software. As there were three images for each muscle with corresponding echointensities, these values were averaged to produce a single value of muscle echointensity for each muscle.
Data analysis/statistical methods
The known diagnosis was used as the gold standard for disease classification. We performed one-way analysis of variance (ANOVA) and the Tukey-Kramer HSD (Honest Significant Difference) comparison of means test of the muscle echointensity across the different disease groups. This statistical test was chosen as it provides the most conservative estimate of statistical differences between categorical variables (i.e. disease subgroups). Quantitative data were analysed using multivariate regression methods. In instances where the dependent variable was categorical and the independent variables were continuous, the logistic regression method was used to calculate parametric estimates of the logistic fit and the p-values were calculated using the maximum likelihood ratio test statistics. Results were considered significant if the p-value was <0.05. The statistical calculations and generation of graphs in this paper were performed using the JMP 12 Pro statistical software (SAS, Cary, NC).
Results
A total of 62 individuals were included in this study, 25 male and 37 female, ranging in age from 23 to 84, and comprised of 18 IBM patients, 9 PM patients, 7 DM patients (34 patients), and 28 normal controls. Ages distributed by decade included 4 from 20–29 years, 8 from 30-–39 years, 8 from 40–49 years, 15 from 50–59 years, 15 from 60–69 years, 9 from 70–79 years, and 3 from 80–89 years. Patient demographics and disease characteristics by disease group are outlined in Table I. As expected, IBM patients tended to be older, with longer duration of weakness and lower DASI scores, indicating more functional disability. CPK levels were highest in the PM subgroup, which was comprised mostly of necrotising myopathies, followed by IBM, with lower mean CPK values seen in the DM subgroup. In this cohort, the IBM patients were the weakest, while the patients with PM had the most preserved strength.
Table I.
Clinical characteristics of study subjects.
| IBM | PM | DM | Normal | |
|---|---|---|---|---|
| n. of subjects | 18 | 9 | 7 | 28 |
| M:F | 9:9 | 1:8 | 2:5 | 13:15 |
| Age mean (range; SD) | 64.8 (52–84; 9,8)* | 57.4 (28–71;12.5) | 55.4 (30–82;16.4) | 48.5 (23–74;15.5)* |
| Duration of weakness in months mean (SD) | 138.0 (93.2)* | 45.2 (40.8)* | 55.14 (28.9) | not applicable |
| CPK mean (SD) (24–195) | 578 (610)* | 1764 (1626)* | 219 (203) | not done |
| DASI mean (SD) (0–58.2) | 25.84 (13.2)* | 31.7 (19.4) | 37.7 (20.1) | 57.6 (2.9)* |
| Strength (SD) (0–10) | 8.44 (2.1) | 9.24 (1.8) | 8.59 (2.5) | 10 (0) |
| Antibodies represented | cN1a | HMGCR, RNP Ku, PL-12 | TIF-1γ, SAE, PL-7, Jo-1, PM-Scl | N/A |
p-values between IBM and normal or PM are <0.001.
Analysis of echointensities by quantitative measures
Using quantitative analysis of segmented muscles, mean muscle echointensities (Table II), showed higher values across all muscle groups in IBM compared to other myositis and normals, except for the deltoid and biceps muscles which was not significantly different between the myositis subgroups. Of the muscles tested, the gastrocnemius and FDP muscles had the highest echointensity values and the largest difference compared to other groups.
Table II.
Tukey-Kramer HSD Comparison of means for muscle echointensities across disease subgroups by muscle type, where the background shading signifies alpha-level differences of at least 0.05 in ascending order from light to dark.
| Normal Mean (SD) | Polymyositis Mean (SD) | Dermatomyositis Mean (SD) | IBM Mean (SD) | |
|---|---|---|---|---|
| Deltoid | 53.50 (9.63) | 67.38 (9.61) | 75.49 (14.70) | 74.15 (17.56) |
| Biceps | 64.23 (9.96) | 82.16 (12.16) | 82.40 (15.38) | 87.67 (17.82) |
| FCR | 57.28 (7.06) | 69.49 (16.81) | 72.73 (15.28) | 81.83 (16.79) |
| FDP | 48.44 (7.66) | 61.06 (11.05) | 67.66 (12.12) | 89.83 (16.68) |
| Rectus | 53.42 (10.0) | 67.88 (10.50) | 72.20 (14.30) | 87.51 (15.60) |
| Gastrocnemius | 59.49 (12.02) | 66.58 (14.38) | 71.56 (9.47) | 91.41 (13.55) |
| Tibialis anterior | 70.70 (8.96) | 80.73 (10.1) | 84.00 (7.69) | 88.04 (9.37) |
| Low | Moderate | High | ||
Among patients with IBM, multivariate analysis for factors related to muscle echointensity showed that age, CPK level and functional capacity as measured by DASI were not related, or did not predict the level of increase in muscle echointensity seen (p>0.05). However, muscle strength (p<0.0016) and duration of weakness (p<0.0001) were strong predictors of muscle echointensity in IBM. Duration of weakness was the most significant predictor with a longer duration of weakness correlating with a higher echointensity of the muscle. In the case of strength, the relationship was inverse with decreased strength related to an increase in echointensity.
An assessment of muscle echointensity in normal patients showed that there is a slight increase in echointensity with age (Fig. 1). In patients with myositis, a similar increase in age was also seen, but with higher muscle echointensities. However, age had a very small effect on muscle echointensity between normals and those with myositis (p=0.07), while the biggest predictor was having disease (p<0.0001).
Fig. 1.
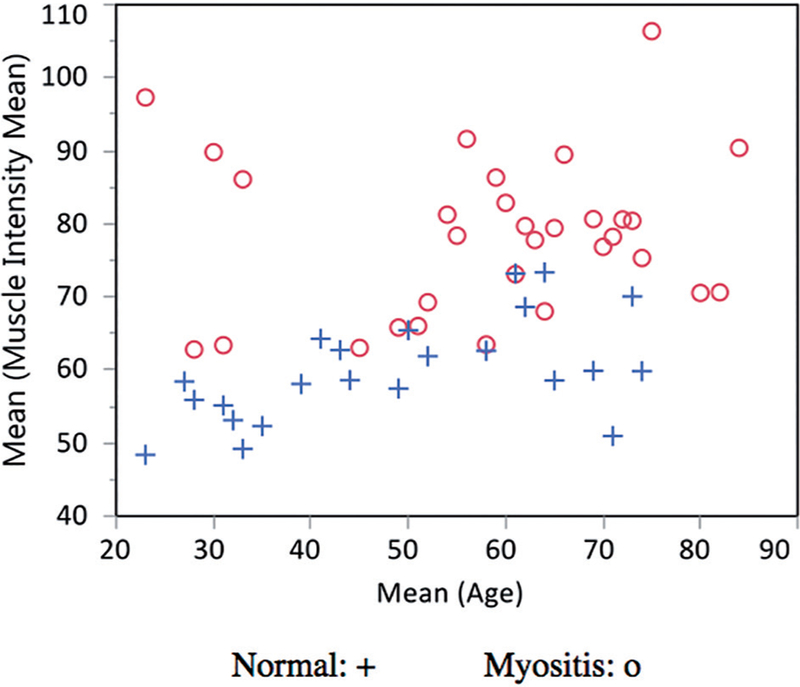
Mean muscle echointensities plotted by age in normal (+) vs. patients with myositis (o)
Muscle involvement in IBM compared with controls
All muscle groups tested showed a significant difference between myositis and normals. When using the deltoids, biceps, FCR and tibialis anterior, IBM could not be distinguished from the other myositis groups due to overlapping means (Fig. 2, group 1). However, when using the rectus, FDP and gastrocnemius muscles (Fig. 2, group 2), IBM could be distinguished from DM, PM and normals given the much higher mean muscle echointensities. This group of muscles therefore, showed the best discriminative ability for IBM against other myositis and controls and would have the highest yield for imaging when considering a diagnosis of IBM.
Fig. 2. One-way analysis of variance (ANOVA) of muscle intensity means by diagnosis and muscle type using Tukey-Kramer HSD comparison of means. Separated circles indicate statistically significant differences in means.

Group 1: For the deltoids, biceps, FCR, and tibialis anterior all groups of myositis are significantly distinguishable from normal using mean muscle intensities. However, different myositis conditions are not distinguishable from each other. Overlapping circles and colors designate that there are no significant difference between those groups. For all these groups, the red circles denote normal, and show that the means do not overlap with those with myositis (separate circles).
Group 2: For these three muscle groups, the separate red circles (IBM) indicate that the means do not overlap with those of myositis or normals. All these cases, the p-values among the diagnosis types were <0.001.
Discussion
Building on previous studies for IBM (9–11), we performed an extended evaluation of upper and lower extremity muscles bilaterally to assess for gradients of muscle involvement as well as to search for asymmetry between sides. We found that all muscle groups tested showed higher echointensities on average in IBM compared to PM, DM and normal controls. Similar to MRI studies (5), the most severely affected muscles were the gastrocnemius muscle in the leg, and the FDP muscle in the forearm. The rectus femoris muscle was also found to be similarly affected which was the only anterior quadriceps muscle group studied. Of these three muscles, the FDP performed the best for discriminating IBM on the basis of muscle echointensity. This selective abnormality of the FDP muscle has not been described in another myopathy (5) and makes this an important feature. However, as noted in larger MRI studies, the FDP can be uninvolved in up to 27% of cases, and there is a variability in phenotype among individuals with this disease (5,7). In cases where the upper extremity is not as involved, the diagnosis of IBM may then be further supported by observing for pathology in the gastrocnemius and rectus muscles. Interestingly, we noted involvement in the FDP and gastrocnemius in all our patients, sometimes in the absence of detectable weakness or atrophy in those muscles on clinical exam. Three of the 18 IBM patients had no weakness of the deep finger flexors on exam and yet showed increased echointensity of the FDP muscle. Ankle plantar flexor strength is also notoriously well-preserved in IBM despite significant and early involvement of the gastrocnemius. This type of imaging thus has advantages for detecting subclinical pathology, which could lead to earlier detection. It may also help clarify an unclear diagnosis particularly where polymyositis versus IBM is concerned.
Several patterns were apparent on visual inspection of images. These included a striking asymmetry between sides in many cases, particularly in the gastrocnemius muscle (Fig. 3e-f), despite similar strength testing and lack of visible atrophy on exam. This could not be demonstrated statistically despite multiple types of analysis (dominant vs. non dominant side, upper vs. lower extremity, muscle by muscle analysis) and appears to be randomly occurring across individuals. The increase in echointensity of affected muscles in IBM was also noted to be in a heterogenous pattern with atrophy (Fig. 3b-d-f). In severe cases, there seemed to be a separation of muscle fascicles giving rise to the appearance of what we term a “popcorn pattern” (Fig. 3d). These visual and qualitative assessments, when combined with quantitative measures of echointensity may add further information in support of a diagnosis of IBM.
Fig. 3. Representative images of IBM muscle involvement.

A) normal FDP (fd) and FCU (fc) muscles, B) FDP in IBM, atrophic with marked increase in echointensity, C) normal gastrocnemius (ga) and soleus (so) muscles, D) gastrocnemius in IBM with heterogeneously increased echointensity with “popcorn pattern”, E) and F) bilateral gastrocnemius muscles in the same IBM patient showing asymmetry. sc: subcutaneous tissue/fat.
Given the lack of effective treatment for IBM, it is not surprising that the increase in echointensity in this group was most directly related to the duration of symptoms. Although muscle echointensity does increase with age (19), and IBM patients tend to be older, the degree of increase in echointensity was not explained by age alone. Further, the preferential involvement of certain muscles points to a specificity for this disease. We could not control for duration of disease among the myositis groups, however effective treatment in PM and DM has been shown to mitigate the changes in echointensity seen (21, 22). Strength was also inversely related to muscle pathology in IBM, but as noted above, the muscle could be seen as affected on imaging even in cases when strength was still seemingly preserved.
Presumably, the marked increase in echointensity in the muscles of IBM patients is due to fatty replacement and fibrosis, which are the biggest contributors to increase in muscle echointensity (23, 24). Fat or fibrous replacement of the muscle leads to an increase in the number of reflections in the muscle and alters its acoustic impedance. Further studies correlating ultrasound images with MRI as well as histopathology would be key to elucidate the exact nature of the changes seen on ultrasound in different stages of IBM and is the focus of our future work.
Limitations of our study include a single unblinded sonographer, and unmatched controls for age and disease duration. Also, the comparator myositis patients were already on treatment which could have influenced the extent of muscle changes seen. However, limitations notwithstanding, this study includes the largest number of patients with IBM in a single ultrasound study and includes comparison groups which allow for the assessment of pattern specificity. We make use of a standardised method for acquiring images, include an extended number of muscle groups, and utilise objective quantitative methods for assessment.
As imaging continues to play an important role in the evaluation of IBM, ultrasound by virtue of its availability, real-time imaging capabilities, and ease of examination for the patient, may become an alternative to MRI. Based on this study, we show that ultrasound can assist in the evaluation of patients with suspected inclusion body myositis by observing for an increase in echointensity in involved muscles, particularly when combined with assessments for asymmetry and echotexture. Although obtaining a comprehensive exam of multiple muscle groups can be done, scanning the FDP, gastrocnemius and quadriceps muscles in cases of suspected IBM may be sufficient. Larger studies including other myopathies are needed to validate these findings
Acknowledgments
Funding: this work was supported by the Jerome L. Greene Foundation Scholar Award to J. Albayda, and E. Tiniakou, the Johns Hopkins University Applied Physics Laboratory, Science and Technology, Research and development Fund to P. Burlina and S. Billings, the Rheumatology Research Foundation to E. Tiniakou, and in part by the National Institute of Arthritis and Musculoskeletal and Skin Diseases (P30-AR053503) to J. Albayda, C.O. Bingham, L. ChristopherStine, J.J. Paik, E. Tiniakou).
Competing interests: C.O. Bingham has served as a consultant for and received grant support (to his institution) from BMS; the other authors have declared no competing interests.
References
- 1.NEEDHAM M, MASTAGLIA FL: Sporadic inclusion body myositis: A review of recent clinical advances and current approaches to diagnosis and treatment. Clin Neurophysiol 2016; 127: 1764–73. [DOI] [PubMed] [Google Scholar]
- 2.HILTON-JONES D, BRADY S: Diagnostic criteria for inclusion body myositis. J Intern Med 2016; 280: 52–62. [DOI] [PubMed] [Google Scholar]
- 3.TASCA G, MONFORTE M, DE FINO C et al. : Magnetic resonance imaging pattern recognition in sporadic inclusion-body myositis: Muscle MRI in IBM. Muscle Nerve 2015; 52: 956–62. [DOI] [PubMed] [Google Scholar]
- 4.PHILLIPS BA, CALA LA, THICKBROOM GW et al. : Patterns of muscle involvement in inclusion body myositis: clinical and magnetic resonance imaging study. Muscle Nerve 2001; 24: 1526–34. [DOI] [PubMed] [Google Scholar]
- 5.COX FM, REIJNIERSE M, VAN RIJSWIJK CSP et al. : Magnetic resonance imaging of skeletal muscles in sporadic inclusion body myositis. Rheumatology 2011; 50: 1153–61. [DOI] [PubMed] [Google Scholar]
- 6.DION E, CHERIN P, PAYAN C et al. : Magnetic resonance imaging criteria for distinguishing between inclusion body myositis and polymyositis. J Rheumatol 2002; 29: 1897–906. [PubMed] [Google Scholar]
- 7.SEKUL EA, CHOW C, DALAKAS MC: Magnetic resonance imaging of the forearm as a diagnostic aid in patients with sporadic inclusion body myositis. Neurology 1997; 48: 863–66. [DOI] [PubMed] [Google Scholar]
- 8.PILLEN S, VAN ALFEN N: Skeletal muscle ultrasound. Neurol Res 2011; 33: 1016–24. [DOI] [PubMed] [Google Scholar]
- 9.NOTO Y-I, SHIGA K, TSUJI Y et al. : Contrasting echogenicity in flexor digitorum profundus-flexor carpi ulnaris: A diagnostic ultrasound pattern in sporadic inclusion body myositis: Ultrasound Pattern in IBM. Muscle Nerve 2014; 49: 745–8. [DOI] [PubMed] [Google Scholar]
- 10.NODERA H, TAKAMATSU N, MATSUI N et al. l.: Intramuscular dissociation of echogenicity in the triceps surae characterizes sporadic inclusion body myositis. Eur J Neurol 2016; 23: 588–96. [DOI] [PubMed] [Google Scholar]
- 11.VU Q, CARTWRIGHT M: Neuromuscular ultrasound in the evaluation of inclusion body myositis. BMJ Case Rep 2016; 2016: bcr2016217440. [DOI] [PMC free article] [PubMed] [Google Scholar]
- 12.ROSE MR; 188th eNMC INterNatIoNal Work-shop: Inclusion Body Myositis, 2–4 December 2011, Naarden, The Netherlands. Neuromuscul. Disord 2013; 23: 1044–55. [DOI] [PubMed] [Google Scholar]
- 13.BOHAN A, PETER JB: Polymyositis and dermatomyositis (first of two parts). N Engl J Med 1975; 292: 344–47. [DOI] [PubMed] [Google Scholar]
- 14.BOHAN A, PETER JB: Polymyositis and dermatomyositis (second of two parts). N Engl J Med 1975; 292: 403–7. [DOI] [PubMed] [Google Scholar]
- 15.HOOGENDIJK JE, AMATO AA, LECKY BR et al. : 119th eNMC INterNatIoNal Workshop: Trial design in adult idiopathic inflammatory myopathies, with the exception of inclusion body myositis, 10–12 October 2003, Naarden, The Netherlands. Neuromuscul Disord 2004; 14: 337–45. [DOI] [PubMed] [Google Scholar]
- 16.RIDER LG, WERTH VP, HUBER AM et al. : Measures of adult and juvenile dermatomyositis, polymyositis, and inclusion body myositis: Physician and Patient/Parent Global Activity, Manual Muscle Testing (MMT), Health Assessment Questionnaire (HAQ)/Childhood Health Assessment Questionnaire (C-HAQ). Arthritis Care Res 2011; 63 (Suppl. 11): S118–S157. [DOI] [PMC free article] [PubMed] [Google Scholar]
- 17.HLATKY M, BOINEAU R, HIGGINBOTHAM M et al. : A brief self-administered questionnaire to determine functional capacity (The Duke Activity Status Index). Am J Cardiol 1989; 64: 651–54. [DOI] [PubMed] [Google Scholar]
- 18.PILLEN S: Skeletal muscle ultrasound. Eur J Transl Myol 2010; 20: 145–56. [Google Scholar]
- 19.ARTS IMP, PILLEN S, SCHELHAAS HJ et al. : Normal values for quantitative muscle ultrasonography in adults. Muscle Nerve 2010; 41: 32–41. [DOI] [PubMed] [Google Scholar]
- 20.YUSHKEVICH PA, PIVEN J, HAZLETT HC et al. : User-guided 3D active contour segmentation of anatomical structures: significantly improved efficiency and reliability. NeuroImage 2006; 31: 1116–28. [DOI] [PubMed] [Google Scholar]
- 21.BHANSING KJ, HOPPENREIJS EP, JANSSEN AJ et al. : Quantitative muscle ultrasound: a potential tool for assessment of disease activity in juvenile dermatomyositis. Scand J Rheumatol 2014; 43: 339–41. [DOI] [PubMed] [Google Scholar]
- 22.HABERS GEA, vaN BRUSSEL M, BHANSING KJ et al. : Quantitative muscle ultrasonography in the follow-up of juvenile dermatomyositis. Muscle Nerve 2015; 52: 540–6. [DOI] [PubMed] [Google Scholar]
- 23.REIMERS K, REIMERS CD, WAGNER S et al. : Skeletal muscle sonography: a correlative study of echogenicity and morphology. J Ultrasound Med 1993; 12: 73–7. [DOI] [PubMed] [Google Scholar]
- 24.PILLEN S, TAK RO, ZWARTS MJ et al. : Skeletal muscle ultrasound: correlation between fibrous tissue and echo intensity. Ultrasound Med Biol 2009; 35: 443–46. [DOI] [PubMed] [Google Scholar]