

Abstract
Background
The increasing prevalence of obesity across all age groups has become a major health concern in China. Previous studies have found strong links between population density, sedentary lifestyle, and the risk of being overweight among adults and adolescents in Western countries. However, little research has been conducted to disentangle this relationship in China, which is rapidly urbanizing and densely populated. Compared to other age groups, middle-aged and older adults tend to have a higher risk of being overweight, which increases their risk of diabetes, high blood pressure, and other weight-related chronic diseases. In addition, they are especially sensitive to neighbourhood environmental factors such as population density. Therefore, we aimed to unravel the link between population density and the risk of being overweight among Chinese middle-aged and older adults, with a particular focus on the mediating role of lifestyle choices.
Methods
Data from the 2011 China Health and Retirement Longitudinal Study were analysed. Individuals (N = 5285) were sampled from 405 neighbourhoods nested within 150 cities. Body Mass Index (BMI) was calculated based on self-reported body weight and height (being overweight was defined as a BMI ≥ 24 kg/m2). Multilevel regression and mediation analyses were applied to explore associations between population density, a sedentary lifestyle, and the risk of being overweight.
Results
Middle-aged and older adults who lived in densely populated neighbourhoods had higher odds of being overweight. Further, this link was mediated by residents’ mode of travel and physical exercise; specifically, these residents had higher odds of owning a car and spending lesser time on weekly physical exercise, thereby increasing their risk of being overweight. Furthermore, the association between car ownership and the odds of being overweight varied by neighbourhood population density.
Conclusions
There was a positive association between neighbourhood population density and middle-aged and older adults’ risk of being overweight. This relationship may exist because people who live in densely populated neighbourhoods tend to lead a sedentary lifestyle. Our findings also suggest that, in rapidly urbanizing countries, a sedentary lifestyle may be especially harmful to middle-aged and older adults who live in densely populated neighbourhoods.
Keywords: Population density, Sedentary lifestyle, Overweight, Neighbourhood, China
Background
In China, the proportion of overweight adults increased from 22.8 to 30.1% between 2002 and 2012 [1]. Being overweight is associated with various diseases, including cardiovascular disease [2, 3], diabetes [2, 3], and cancer [4, 5], and it increases individuals’ mortality risk [4]. On the other hand, being overweight is related to psychological problems, such as low self-esteem [6]; it can result in negative emotions that may lead to chronic stress in their daily life or even suicide [7]. All these could affect individuals’ Health-related quality of life (HRQoL) which is defined as people’s subjective evaluation on different aspects of health status [8].
China has experienced a rapid process of urbanization over the last 40 years. The percentage of the total population that lived in cities was only 18% in 1978, and unprecedentedly increased to more than 56% in 2015 [9]. In addition, more than one billion people are expected to live in urban areas by 2030 [10]. Previous studies have shown that population density may be a double-edged sword to residents’ health in developing countries. On the one hand, high population density is normally associated with poor sanitation, shortage in public facilities and services, and environmental degradation [11]. On the other hand, high population density is conducive to the development of healthy lifestyles such as more physical activities and lower rates of car use, which could reduce the risk of being overweight [12–15]. Identifying the relationship between population density and being overweight may be necessary to improve people’s quality of life and an urgent public health issue in China.
Regarding mechanisms through which population density affects health, a significant body of research in developed countries has noted the importance of lifestyle as a mediating component of health protection [16–25]. Indeed, the healthy lifestyle theory states that lifestyle is a bridge between environmental and human factors that affects health outcomes [16]. Previous studies have concluded that there are two main lifestyle choices through which population density reduces the risk of being overweight in developed countries. First, ‘Transportation mode’ [14, 17–25] and the ‘3D’ theory (population Density, pedestrian-friendly Design, and a diversity of Destinations) claim that population density may increase the walkability of a neighbourhood [20, 25] and reduce the distance to amenities [14, 17, 18]. Therefore, residents living in communities with a higher population density would prefer walking and using public transport to private transport, thereby increasing their engagement in physical exercise, which invariably reduces the risk of being overweight [21, 24]. Second, a neighbourhood with high population density may also increase the time that residents spend on physical exercise [12, 13, 21, 24]. For instance, a high population density is closely related to a perceived level of safety (i.e. fewer crimes and gangs) and a heightened sense of safety [12, 13]. Therefore, middle-aged and older adults are more likely to engage in outdoor activities (including outdoor exercises) when their neighbourhood is perceived to be safe [12]. Thus, engaging in outdoor activities can potentially reduce their risk of being overweight. In addition, high population density may encourage people to connect with their neighbours, thereby increasing the level of neighbourhood social cohesion [12, 21]. Compared to younger residents, middle-aged and older residents are more afraid of being injured when exercising alone. Therefore, older residents are more willing to exercise in a cohesive neighbourhood, where people are likely to help each other in the event of an injury [12].
Although existing studies have found that living in a densely populated neighbourhood is associated with a decreased risk of being overweight in developed countries [16–25], only a few studies have attempted to unravel the relationship between population density and the risk of being overweight in China [26–39]. Further, these studies have focused only on a single city or region, thereby limiting the generalizability of the findings. Moreover, none of these studies has explored the mediating effect of lifestyle choices on the relationship between neighbourhood population density and the risk of being overweight.
To bridge these gaps in literature, we investigated the relationship between neighbourhood population density, individuals’ lifestyle, and the risk of being overweight in China, using data from the 2011 wave of China Health and Retirement Longitudinal Study (CHARLS). We particularly focused on the mediating effect of lifestyle choices on the relationship between population density and the risk of being overweight. This study contributes to the body of existing literature in two respects: first, it improves our understanding of how neighbourhood population density and a sedentary lifestyle influence middle-aged and older adults’ risk of being overweight in China; second, it offers a deeper understanding of the social and behavioural pathways that link urbanisation to the prevalence of being overweight in the Chinese context. The conceptual framework of the current research is shown in Fig. 1. We hypothesized that neighbourhood population density would directly affect residents’ risk of being overweight and indirectly affect the likelihood of being overweight through the prevalence of a sedentary lifestyle.
Fig. 1.
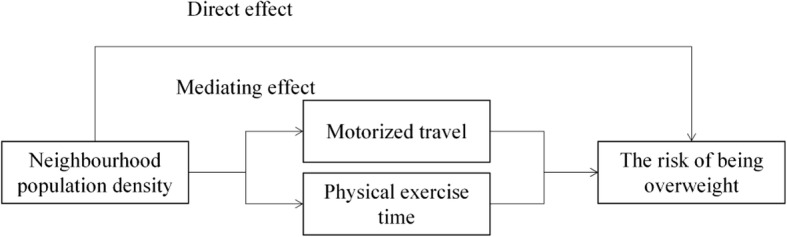
Framework of the relationship between neighbourhood population density, lifestyle, and being overweight
Methods
Data
We used data from the 2011 wave of CHARLS, which was conducted by the National Development Research Institute of Peking University in cooperation with the China Social Science Research Centre and the Youth League Committee of Peking University [30]. The study used a cross-sectional design wherein data was collected between the months of April and August 2011. Respondents were selected using the probability proportional to size (PPS) sampling technique in which the probability of selecting a sampling unit is directly proportional to its population size. The advantage of PPS is that it can generate representative sampling units without much cost and that the usage of auxiliary information can reduce sampling error. In the first stage of sampling, 150 prefecture-level divisions from 30 provinces were randomly selected depending on the population size of each prefecture-level division. In the second stage, 450 neighbourhoods were randomly selected from the sampled prefecture-level divisions, depending on the population size of each neighbourhood. The neighbourhood (she qu) that served as the basic sampling unit for CHARLS refers to the fifth-level of the basic administrative division with defined boundaries and elected heads. The data set included 17,587 individuals; however, a key question about ‘weekly physical exercise time’ was asked to a randomly chosen sub-sample of households. Therefore, the final data set included 5285 individuals nested within 405 neighbourhoods.
Variables
Outcome
Weight and height were measured in the CHARLS. BMI was calculated as the ratio of body weight to height squared (kg/m2). According to the ‘Nutrition improvement work management method’, enacted by the National Health and Family Planning Commission of the People’s Republic of China, being overweight was defined as a BMI ≥ 24 [31].
Predictor
Population density at the neighbourhood level
The number of residents per square kilometre (km2) at the neighbourhood level was used to measure neighbourhood population density. This predictor is a reflection of population agglomeration in the neighbourhood, which is one of the most widely used proxies of urbanity [26].
Lifestyle indicators
In this study, we considered sedentary lifestyle as a mediator, since it is directly related to calorie metabolism. Two kinds of sedentary lifestyle indicators were examined: residents’ transportation mode and weekly physical exercise time. People whose family owns a car may prefer driving instead of walking, which means that they may burn fewer calories during their daily commute. Therefore, we defined transportation mode based on whether or not their family owned a car (1 = with car ownership; 0 = without car ownership). Weekly physical exercise (including taking a walk) was self-reported by respondents; the number of hours spent on physical exercise was used as the unit of analysis.
Covariates
We controlled for a series of individual-level covariates including sex, age, marital status, education, and annual household income per capita [23, 27]. In addition, previous studies have indicated that people’s health-related habits and resources may also increase their risk of being overweight [14, 26]. Therefore, variables such as eating frequency (i.e. 1 if the respondent consumes meals more than three times a day; 0 if the respondent consumes meals no more than three times a day), smoking history, drinking history, medical insurance status, and physical health status (i.e. respondents who reported having any chronic disease were assigned a value of 1), were also controlled. Neighbourhood social and built environment have also been found to affect the likelihood of being overweight [14, 26]. Therefore, annual neighbourhood income per capita, neighbourhood sports facilities, and neighbourhood sports groups were also controlled. In China, there is a wide disparity between urban and rural areas in terms of lifestyle, provision of health-related facilities, and quality of life; such a disparity may pose different risks to being overweight. Therefore, urban-rural residents were also controlled. For continuous variables such as household income per household member and neighbourhood income per neighbourhood resident, we applied their logarithmic form, since the original form was not normally distributed and was affected by the existence of outliers. Summary statistics for the study variables are presented in Table 1. Specifically, we have reported the proportion of respondents across the categories of the binary variable and across the three quartiles for continuous variables.
Table 1.
Descriptive statistics for the study variables
| Variable | Total sample | Overweight sample | None-overweight sample |
|---|---|---|---|
| Proportion/median (P25-P75) | Proportion/median (P25-P75) | Proportion/median (P25-P75) | |
| Dependent variable | |||
| BMI status (ref: BMI < 24 kg/m2) | |||
| Overweight (BMI ≥ 24 kg/m2) | 0.41 | ||
| Independent variables | |||
| Motorized traveller (ref: No) | |||
| Yes | 0.09 | 0.16 | 0.04 |
| Time spent on weekly physical exercise (hours) | 28.50 (14.00–38.00) | 21.00 (3.00–29.00) | 28.00 (14.00–46.00) |
| Population density (person/km2) | 725.62 (257.31–71,392.85) | 897.88 (379.74–95,000.00) | 574.99 (221.02–15,000.00) |
| Control variables (demographic and socioeconomic variables) | |||
| Sex (ref: Female) | |||
| Male | 0.45 | 0.39 | 0.49 |
| Age (years) | 58.00 (51.00–68.00) | 57.00 (49.00–62.00) | 58.00 (52.00–69.00) |
| Marital status (ref: Single, divorced, or widowed) | |||
| Married | 0.88 | 0.91 | 0.86 |
| Education (ref: Primary school or below) | |||
| Junior high school | 0.20 | 0.23 | 0.19 |
| Senior high school or above | 0.11 | 0.14 | 0.08 |
| Living area (ref: Rural area) | |||
| Urban area | 0.38 | 0.46 | 0.32 |
| Eating frequency (ref: ≤ three times a day) | |||
| > three times a day | 0.87 | 0.89 | 0.86 |
| Smoking history (ref: Non-smoker) | |||
| Smoker | 0.38 | 0.31 | 0.42 |
| Drinking history (ref: Non-drinker) | |||
| Drinking | 0.32 | 0.29 | 0.35 |
| Medical insurance status (ref: No) | |||
| Yes | 0.93 | 0.93 | 0.94 |
| Physical health status (ref: Do not have a disease) | |||
| Have a disease | 0.65 | 0.71 | 0.61 |
| Annual household income per capita (Chinese Yuan) | 4794.00 (1210.00–57,926.39) | 4340.00 (1400–60,500.00) | 3410.00 (1040.00–20,200) |
| Annual neighbourhood income per capita (Chinese Yuan) | 3018.00 (1423.00–8800.00) | 3018.00 (1500.00–12,000) | 3000.00 (1400.00–20,000.00) |
| Neighbourhood sports facilities (ref: No) | |||
| Yes | 0.64 | 0.65 | 0.64 |
| Neighbourhood sports groups (ref: No) | |||
| Yes | 0.52 | 0.55 | 0.50 |
Data analysis
Due to the hierarchical structure of the data (individuals nested within neighbourhoods), multilevel models were deemed suitable for this research. We examined the effects of population density and lifestyle on respondents’ risk of being overweight, and whether a sedentary lifestyle mediates this relationship, using a two-level regression analysis.
We used multilevel regression analysis along with mediation analysis for the current study. First, we estimated the association between neighbourhood population density and the risk of being overweight using multilevel logistic regression analysis (Model 1). Second, we estimated the association between neighbourhood population density and the likelihood of owning a car using multilevel logistic regression analysis (Model 2). Subsequently, we estimated the linkage between neighbourhood population density and the amount of time spent on weekly physical exercise using multilevel liner regression analyses (Model 3). Third, following Baron and Kenny’s (1986) mediation analysis approach [32], we regressed the risk of being overweight on the level of neighbourhood population density, while controlling for the mediators (i.e., lifestyle choices); Sobel test and other mediation tests were used to test the significance of the mediation effect (Model 4a). Then, we added cross-level interaction effects to examine whether neighbourhood population density moderated the relationship between lifestyle choices and the risk of being overweight, using multilevel logistic regression analyses (Model 4b). All continuous variables were centred on the grand mean in the interaction. All analyses were conducted using STATA 15.0.
Results
Table 2 shows the results of the multilevel logistic regression analysis: Model 1 shows that the odds of being overweight increased with higher neighbourhood population density (OR = 1.103, 95% CI = 1.056–1.153). Further, the odds of being overweight decreased with age (OR = 0.972, 95% CI = 0.965–0.979), and married respondents were more likely to be overweight than their single, divorced, and widowed counterparts (OR = 1.231, 95% CI = 1.004–1.509). Respondents with higher educational attainment were also more likely to be overweight than those who were less educated (OR = 1.338, 95% CI = 1.096–1.633). Compared to rural respondents, urban respondents were more likely to be overweight (OR = 1.620, 95% CI = 1.363–1.926). Interestingly, both drinking (OR = 0.753, 95% CI = 0.639–0.889) and smoking (OR = 0.863, 95% CI = 0.748–0.997) were related to a decreased risk of being overweight. Lastly, respondents with a physical disease were more likely to be overweight (OR = 1.747, 95% CI = 1.535–1.988). Model 2 shows the results of the respective multilevel model on respondents’ lifestyle choices, which suggests that the odds of owning a car increases with neighbourhood population density (OR = 1.421, 95% CI = 1.260–1.604). Model 3, on the other hand, shows that the amount of time that respondents devoted to physical exercise decreased with higher neighbourhood population density (B = − 0.066, SE = 0.017).
Table 2.
Multilevel regression estimates for models with overweight respondents (Model 1), motorized travellers (Model 2), and the Logarithm of time spent on physical exercise (Model 3), as dependent variables
| Variable | DV: Overweight | DV: Motorized traveller | DV: Logarithm of time spent on physical exercise |
|---|---|---|---|
| Model 1 | Model 2 | Model 3 | |
| OR (95% CI) | OR (95% CI) | B (SE) | |
| Fixed part | |||
| Independent variable | |||
| Logarithm of neighbourhood population density | 1.103*** (1.056–1.153) | 1.421*** (1.260–1.604) | −0.066*** (0.017) |
| Individual-level attributes | |||
| Male (ref: female) | 0.885 (0.742–1.056) | 0.734* (0.532–1.013) | 0.142*** (0.042) |
| Age | 0.972*** (0.965–0.979) | 0.965*** (0.949–0.982) | −0.024** (0.002) |
| Married (ref: single, divorced, or widowed) | 1.231** (1.004–1.509) | 1.403 (0.870–2.262) | 0.109** (0.052) |
| Educational attainment (ref: ≤ primary school) | |||
| Junior high school | 1.152* (0.987–1.343) | 2.410*** (1.747–3.326) | −0.114*** (0.041) |
| ≥ Senior high school | 1.338*** (1.096–1.633) | 8.339*** (5.831–11.926) | −0.093 (0.060) |
| Living in an urban area (ref: rural) | 1.620*** (1.363–1.926) | 1.509** (1.012–2.250) | −0.225*** (0.073) |
| Having meals ≤ three times a day (ref: meals > three times a day) | 1.093 (0.889–1.345) | 1.327 (0.823–2.139) | 0.275*** (0.063) |
| Smoker (ref: non-smoker) | 0.753*** (0.639–0.889) | 1.195 (0.832–1.717) | 0.002 (0.039) |
| Drinking (ref: non-drinker) | 0.863** (0.748–0.997) | 1.009 (0.742–1.370) | 0.128*** (0.038) |
| Having medical insurance (ref: no) | 0.944 (0.748–1.192) | 1.274 (0.773–2.100) | 0.206*** (0.070) |
| Having a physical disease (ref: no) | 1.747*** (1.535–1.988) | 1.224 (0.937–1.600) | 0.017 (0.034) |
| Logarithm of household income per capita | 1.004 (0.979–1.030) | 1.062** (1.005–1.121) | 0.032*** (0.009) |
| Neighbourhood-level attributes | |||
| Logarithm of neighbourhood income per capita | 0.992 (0.960–1.024) | 1.015 (0.938–1.099) | 0.023 (0.015) |
| Neighbourhood sports facilities (ref: no) | 0.788* (0.610–1.019) | 1.832** (0.966–3.475) | −0.039 (0.105) |
| Neighbourhood sports groups (ref: no) | 1.089 (0.851–1.393) | 0.659 (0.359–1.213) | 0.054 (0.097) |
| Constant | 1.167* (0.617–2.209) | 0.003*** (0.001–0.016) | 3.857*** (0.236) |
| Random part | |||
| Variable (constant) | 0.178*** | 1.345*** | 0.259*** |
| Variable (residual) | 1.150*** | ||
| Number of individuals | 5285 | 5285 | 5285 |
| Number of neighbourhoods | 405 | 405 | 405 |
| AIC | 6759.609 | 2482.315 | 16,295.660 |
| Log likelihood | − 3361.8045 | − 1223.1574 | − 8128.8277 |
Note. DV dependent variable, OR odds ratio, CI confidence interval, B unstandardized coefficient, SE standard error, AIC Akaike information criterion. *p < .10, **p < .05, ***p < .01
We further examined whether a sedentary lifestyle mediates the relationship between neighbourhood population density and the risk of being overweight. The results of the analysis conducted with Model 4a, which is presented in Table 3, shows that the odds of being overweight decreased with higher amounts of time spent on physical exercise (OR = 0.903, 95% CI = 0.858–0.950). In addition, those owning a car were more likely to be overweight than those who did not own one (OR = 3.599, 95% CI = 2.833–4.571). The direct effect of neighbourhood population density on the risk of being overweight was significant (OR = 1.062, 95% CI = 1.019–1.108), even after controlling for the indirect effects of car ownership and time spent on exercise. However, results of the Sobel test and the multiple mediation test showed that both the amount of time spent on physical exercise and car ownership significantly mediated the relationship between neighbourhood population density and the risk of being overweight. Therefore, it can be inferred that these two indicators of a sedentary lifestyle partially mediated the relationship between neighbourhood population density and the risk of being overweight.
Table 3.
Multilevel logistic regression estimates of odds ratios of being overweight (Model 4) and the mediating effect of lifestyle choice on being overweight (Model 5)
| Variable | Model 4a | Model 4b |
|---|---|---|
| OR (95% CI) | OR (95% CI) | |
| Fixed part | ||
| Independent variable | ||
| Logarithm of neighbourhood population density | 1.062*** (1.019–1.108) | 1.027**(1.013–1.073) |
| Individual-level attributes | ||
| Logarithm of time spent on physical exercise | 0.903*** (0.858–0.950) | 0.901***(0.856–0.949) |
| Motorized traveller (ref: non-motorized traveller) | 3.599*** (2.833–4.571) | 2.667***(2.048–3.472) |
| Male (ref: female) | 0.921 (0.775–1.093) | 0.924 (0.777–1.098) |
| Age | 0.971*** (0.964–0.978) | 0.970***(0.963–0.977) |
| Married (ref: single, divorced, or widowed) | 1.220+ (1.000–1.488) | 1.218*(0.998–1.487) |
| Education (ref: ≤ primary school) | ||
| Junior high school | 1.070 (0.911–1.256) | 1.041 (0.886–1.223) |
| ≥ Senior high school | 1.001 (0.802–1.247) | 0.881 (0.702–1.107) |
| Living in an urban area (ref: rural) | 1.524*** (1.285–1.808) | 1.504***(1.266–1.786) |
| Having meals ≤ three times a day (ref: meals > three times a day) | 1.133 (0.933–1.376) | 1.157 (0.952–1.406) |
| Smoker (ref: non-smoker) | 0.741*** (0.626–0.877) | 0.741***(0.626–0.878) |
| Drinking (ref: non-drinker) | 0.871* (0.751–1.009) | 0.867*(0.747–1.006) |
| Having medical insurance (ref: no) | 0.943 (0.741–1.200) | 0.941 (0.738–1.199) |
| Having a physical disease (ref: no) | 1.751*** (1.538–1.993) | 1.759***(1.545–2.004) |
| Logarithm of household income per capita | 1.004 (0.978–1.030) | 1.005 (0.979–1.031) |
| Neighbourhood-level attributes | ||
| Logarithm of neighbourhood income per capita | 0.993 (0.959–1.027) | 0.991 (0.957–1.027) |
| Neighbourhood sports facilities (ref: no) | 0.741** (0.582–0.944) | 0.737**(0.578–0.941) |
| Neighbourhood sports groups (ref: no) | 1.154 (0.908–1.466) | 1.172 (0.920–1.494) |
| Cross-level interaction | ||
| Logarithm of neighbourhood population density × Logarithm of time spent on physical exercise | 1.001 (0.973–1.031) | |
| Logarithm of neighbourhood population density × Motorized traveller (ref: non-motorized traveller) | 1.476***(1.296–1.682) | |
| Constant | 2.016* (0.988–4.116) | 2.641***(1.280–5.448) |
| Random part | ||
| Variable (constant) | 0.129*** | 0.133*** |
| Number of individuals | 5285 | 5285 |
| Number of neighbourhoods | 405 | 405 |
| AIC | 6627.554 | 6591.104 |
| Log likelihood | − 3293.777 | − 3273.552 |
Note. OR odds ratio; CI = confidence interva; AIC = Akaike information criterion. *p < .10, *p < .05, ***p < .01
The partial mediation effects [33] of car ownership and time spent on physical exercise indicated that other bio-psychosocial pathways (e.g. dietary habits and health knowledge) might have played a role in the relationship between neighbourhood population density and the risk of being overweight. Accordingly, the results of an analysis conducted using Model 4b revealed that respondents whose family owned a car in densely populated neighbourhoods were more likely to be overweight than those living in less dense neighbourhoods. However, there was no evidence to suggest that the amount of time spent on physical exercise moderated the linkage between population density and the odds of being overweight.
Discussion
This study investigated the relationships between neighbourhood population density, a sedentary lifestyle, and the risk of being overweight in China which may help to improve people’s HRQoL. First, in contrast to previous studies that have focused on developed countries [22, 23], this study was conducted in a developing country. The findings of this study revealed that middle-aged and older people living in densely populated neighbourhoods have a higher risk of being overweight than those living in sparsely populated neighbourhoods in China. This relationship was found to be attributable in part to the former group’s greater likelihood of owning a car and spending less time on physical exercise. Population density was found to be negatively related to the risk of being overweight in Western developed countries. This may be the case because residents living in densely populated neighbourhoods are more likely to have low socioeconomic status, which renders them unable to afford cars [15, 17] and have more time for physical exercises such as walking [21, 24, 25]. However, this is not the case in China. One explanation for the detrimental effect of urbanization is related to the more frequent use of motorized private traffic and lower engagement in physical exercise among people living in densely populated urban areas in China (which is discussed in the following paragraphs). The other explanation is that rapid urbanization in China, which has resulted in cities becoming more heterogeneous, partitioned, and socially alienating, may make residents more stressed. Such a contention is consistent with the finding that rapid urbanization in China has increased citizens’ stress levels [34–42]. Given that increased stress is related to a higher risk of being overweight [30] such as by causing endocrine disorders [36, 42, 43], increased population density may increase the risk of being overweight by directly worsening residents’ anxiety. In addition, population density is positively associated with the density of fast-food restaurants in China; therefore, those living in densely populated neighbourhoods are more likely to consume high-calorie foods and have a higher BMI [44].
The results of our analysis showed that population density was positively associated with the odds of living a sedentary lifestyle (i.e. higher motorised private traffic and less physical exercise), which is inconsistent with those from developed countries [12–14, 17, 18, 21, 24]. Such a stark contrast between China and developed countries can be explained by cultural variations in the rural-urban divide and residential differentiation.
In China, high population density has made both public transport (e.g. overcrowded buses) and sidewalks inconvenient for middle-aged and older adults [27, 45, 46]. Thus, these individuals are more likely to drive a car and engage in less exercise in the form of walking, than those who live in less crowded areas. Furthermore, middle-aged and older adults typically do not prefer working out in a fitness centre [42, 43]; therefore, they may require open spaces and community-based sports facilities to engage in exercise. However, living in a densely populated neighbourhood makes this less likely and may cause older adults to stay indoors instead of exercising outside. In addition, in China, residents of a high socioeconomic status are more likely to live in densely populated neighbourhoods (which are normally located in inner-city areas), and are therefore, more likely to own private cars [47] and enjoy better facilities for physical exercise [26, 27, 48, 49].
In addition, consistent with previous studies, results from our analysis indicated that owning a car and spending less time on physical exercise might increase the risk of being overweight [17, 18, 26]. The emergence of an interaction effect also indicated that the effect of car ownership varied by neighbourhood population density. First, neighbourhood population density strengthened the effect of car ownership on respondents’ likelihood of being overweight, which may be accounted for by the reasons noted above. Interestingly, inconsistent with previous studies [2–5], we found that being a drinker and smoker increased the risk of being overweight in this study. The obesity paradox [50], which can be described as follows, is a possible explanation for this finding: Overweight people are more likely to be warned by doctors and are thus careful about their unhealthy lifestyles; this in turn may reduce the frequency of their drinking and smoking behaviours.
From a policy perspective, the present study findings suggest that, to reduce older residents’ risk of being overweight, government officials should pay attention to the rapid growth of population density. At the individual level, neighbourhood committees are advised to advertise more in order to inform middle-aged and older adults about the disadvantages of being overweight. At the neighbourhood and city level, environmental intervention measures (e.g. sports facilities, green space, more walkable sidewalks) should be implemented to encourage middle-aged and older people to actively engage in physical exercise. These could help to reduce the risk of being overweight and thus, improve individual’s HRQoL in their later life.
Despite the merits of this study, some limitations should be noted. First, we can neither infer the causality of the relationship between neighbourhood population density and the risk of being overweight, nor solve the selection bias that is implicit to the cross-sectional research design that was used in this study [51]. For example, in the case of China, wealthy people are more likely to live in densely populated neighbourhoods than poorer people, and the former group has a higher risk of being overweight than the latter group. Under such circumstances, there might be a bias in the estimated relationship between neighbourhood population density and the risk of being overweight. The problem of selection bias can be partially addressed by using advanced statistical techniques such as longitudinal data analysis and propensity score matching. Second, we demarcated the boundary of neighbourhoods based on the division of administrative areas, which may lead to a modifiable areal unit problem (MAUP) [52]. Third, the data used in the current study were collected in 2011; the neighbourhood environment as well people’s lifestyles may changed rapidly. For this reason, results from this study may not reflect the current situation in China. Fourth, the results of the regression analysis might have been influenced by self-report bias, as the time spent on physical exercise was reported by respondents themselves. Finally, although a larger dataset was available, only a subset of respondents was selected to answer questions about physical activities. Therefore, even though the CHARLS selected their respondents using random sampling method, there is a possibility of sampling bias in the present study. For example, some selected respondents, especially those who were overweight, might have refused to answer questions about their body weight, thereby excluding themselves from the study sample. If this is the case, the emergent relationship between population density and the risk of being overweight is likely to be an underestimate.
Conclusions
This study enhances our understanding of the linkages between population density, a sedentary lifestyle, and the risk of being overweight, among Chinese middle-aged and older adults. Living in a densely populated neighbourhood may increase their likelihood of following a sedentary lifestyle, and in turn increase their risk of being overweight. Further research is needed to examine other bio-psychosocial pathways (e.g. dietary habits, stress levels) that could link population density to the odds of being overweight in the Chinese context.
Acknowledgments
Data used in this study were derived from the 2011 CHARLS, which was conducted by the National Development Research Institute of Peking University in cooperation with the China Social Science Research Center and the Youth League Committee of Peking University. The opinions in this paper are those of the authors. An earlier version of this paper was presented at the 2018 Urban China Research Network Conference-Urban China Studies in a New Era held in Wuhan, China, June 23–25, 2018. The authors thank the conference organizers and participants for their comments and suggestions.
Abbreviations
- BMI
Body Mass Index
- CHARLS
China Health and Retirement Longitudinal Study
- PPS
Probability Proportional to Size
Authors’ contributions
Wang, DX, and YL conceived and designed this study. RW and ZF conducted the statistical analyses. RWu, YL, and ZF drafted and revised the manuscript. All authors have read and approved the final manuscript.
Funding
The National Natural Science Foundation of China (No. 41320104001 and 41871140) and Innovative R&D Team Introduction Program of Guangdong Province (No. 2017ZT07X355) supported this research.
Availability of data and materials
The datasets generated and/or analysed in the current study are available in the repository [http://charls.pku.edu.cn/zh-CN].
Ethics approval and consent to participate
Not applicable.
Consent for publication
Not applicable.
Competing interests
The authors declare that they have no competing interests.
Footnotes
Publisher’s Note
Springer Nature remains neutral with regard to jurisdictional claims in published maps and institutional affiliations.
Contributor Information
Ruoyu Wang, Email: wangry6@mail2.sysu.edu.cn.
Zhixin Feng, Email: Z.Feng@soton.ac.uk.
Desheng Xue, Email: eesxds@mail.sysu.edu.cn.
Ye Liu, Email: liuye25@mail.sysu.edu.cn.
Rong Wu, Email: 1563760395@qq.com.
References
- 1.National Health and Family Planning Commission. Chinese residents of nutrition and chronic disease status report (2015), 2015. Retrieve from: (http://www.nhc.gov.cn/jkj/s5879/201506/4505528e65f3460fb88685081ff158a2.shtml).
- 2.Mcpherson K. Reducing the global prevalence of overweight and obesity. Lancet. 2014;384(9945):728–730. doi: 10.1016/S0140-6736(14)60767-4. [DOI] [PubMed] [Google Scholar]
- 3.Egede LE, Zheng D. Modifiable cardiovascular risk factors in adults with diabetes: prevalence and missed opportunities for physician counseling. Arch Intern Med. 2002;162(4):427–433. doi: 10.1001/archinte.162.4.427. [DOI] [PubMed] [Google Scholar]
- 4.Solomon CG, Manson JE. Obesity and mortality: a review of the epidemiologic data. Am J Clin Nutr. 1997;66(4):1044S–1050S. doi: 10.1093/ajcn/66.4.1044S. [DOI] [PubMed] [Google Scholar]
- 5.Vainio H, Kaaks R, Bianchini F. Weight control and physical activity in cancer prevention: international evaluation of the evidence. Eur J Cancer Prev. 2002;11:S94–100. [PubMed] [Google Scholar]
- 6.Jalali-Farahani S, Abbasi B, Daniali M. Weight associated factors in relation to health-related quality of life (HRQoL) in Iranian adolescents. Health Qual Life Outcomes. 2019;17(1):3. doi: 10.1186/s12955-018-1074-9. [DOI] [PMC free article] [PubMed] [Google Scholar]
- 7.Dave D, Rashad I. Overweight status, self-perception, and suicidal behaviors among adolescents. Soc Sci Med. 2009;68(9):1685–1691. doi: 10.1016/j.socscimed.2009.02.015. [DOI] [PubMed] [Google Scholar]
- 8.Ravens-Sieberer U, Erhart M, Wille N, Wetzel R, Nickel J, Bullinger M. Generic health-related quality-of-life assessment in children and adolescents. Pharmacoeconomics. 2006;24(12):1199–1220. doi: 10.2165/00019053-200624120-00005. [DOI] [PubMed] [Google Scholar]
- 9.China National Bureau of Statistics. Statistical communique of China on 2015 National Economic and social development, 2016. Retrieve from: (http://www.stats.gov.cn/tjsj/zxfb/201602/t20160229_1323991.html).
- 10.Development Research Center of the State Council. Promoting Efficient, Comprehensive and Sustainable Urbanization in China, 2014. Retrieve from:(https://www.worldbank.org/content/dam/Worldbank/document/EAP/China/WEB-Urban-China.pdf).
- 11.Eckert S, Kohler S. Urbanization and health in developing countries: a systematic review. World Health Popul. 2014;15(1):7–20. doi: 10.12927/whp.2014.23722. [DOI] [PubMed] [Google Scholar]
- 12.Michael Y. Neighborhood-level influences on physical activity among older adults: a multilevel analysis. J Aging Phys Activ. 2004;12(1):45–63. doi: 10.1123/japa.12.1.45. [DOI] [PubMed] [Google Scholar]
- 13.Balfour JL, Kaplan GA. Neighborhood environment and loss of physical function in older adults: evidence from the Alameda County study. Am J Epidemiol. 2002;155(6):507–515. doi: 10.1093/aje/155.6.507. [DOI] [PubMed] [Google Scholar]
- 14.Lopez-Zetina J, Lee H, Friis R. The link between obesity and the built environment. Evidence from an ecological analysis of obesity and vehicle miles of travel in California. Health Place. 2006;12(4):656–664. doi: 10.1016/j.healthplace.2005.09.001. [DOI] [PubMed] [Google Scholar]
- 15.Cervero R. Built environments and mode choice: toward a normative framework. Transport Rest D-TRE. 2002;7(4):265–284. [Google Scholar]
- 16.Cockerham WC. Health lifestyle theory and the convergence of agency and structure. J Health Soc Behav. 2005;46(1):51–67. doi: 10.1177/002214650504600105. [DOI] [PubMed] [Google Scholar]
- 17.Frank LD, Saelens BE, Powell KE, Chapman JE. Stepping towards causation: do built environments or neighborhood and travel preferences explain physical activity, driving, and obesity? Soc Sci Med. 2007;65(9):1898–1914. doi: 10.1016/j.socscimed.2007.05.053. [DOI] [PubMed] [Google Scholar]
- 18.Lindström M. Means of transportation to work and overweight and obesity: a population-based study in southern Sweden. Prev Med. 2008;46(1):22–28. doi: 10.1016/j.ypmed.2007.07.012. [DOI] [PubMed] [Google Scholar]
- 19.Brown BB, Yamada I, Smith KR, Zick CD, Kowaleskijones L, Fan JX. Mixed land use and walkability: variations in land use measures and relationships with BMI, overweight, and obesity. Health Place. 2009;15(4):1130–1141. doi: 10.1016/j.healthplace.2009.06.008. [DOI] [PMC free article] [PubMed] [Google Scholar]
- 20.Smith KR, Brown BB, Yamada I, Kowaleskijones L, Zick CD, Fan JX. Walkability and body mass index density, design, and new diversity measures. Am J Prev Med. 2008;35(3):237–244. doi: 10.1016/j.amepre.2008.05.028. [DOI] [PubMed] [Google Scholar]
- 21.Sallis J, Saelens B, Ld CT, Slymen DJ, Cain KL, Chapman JE, Kerr J. Neighborhood built environment and income: examining multiple health outcomes. Soc Sci Med. 2009;68(7):1285–1293. doi: 10.1016/j.socscimed.2009.01.017. [DOI] [PMC free article] [PubMed] [Google Scholar]
- 22.Spence JC, Cutumisu N, Edwards J, Evans J. Influence of neighbourhood design and access to facilities on overweight among preschool children. Int J Pediatr Obes. 2008;3(2):109–116. doi: 10.1080/17477160701875007. [DOI] [PubMed] [Google Scholar]
- 23.Zick CD, Hanson H, Fan JX, Smith KR, Kowaleskijones L, Brown BB, Yamada L. Re-visiting the relationship between neighbourhood environment and BMI: an instrumental variables approach to correcting for residential selection bias. Int J Behav Nutr Phy. 2013;10(1):27–36. doi: 10.1186/1479-5868-10-27. [DOI] [PMC free article] [PubMed] [Google Scholar]
- 24.Frank LD, Engelke PO. The built environment and human activity patterns: exploring the impacts of urban form on public health. J Plan Literature. 2001;16(2):202–218. [Google Scholar]
- 25.Handy Susan L, Boarnet Marlon G, Ewing Reid, Killingsworth Richard E. How the built environment affects physical activity. American Journal of Preventive Medicine. 2002;23(2):64–73. doi: 10.1016/s0749-3797(02)00475-0. [DOI] [PubMed] [Google Scholar]
- 26.Xu F, Li JQ, Liang YQ, Wang ZY, Hong X, Ware RS, Leslie E, Sugiyama T, Owen N. Residential density and adolescent overweight in a rapidly urbanising region of mainland China. J Epidemiol Commun H. 2010;64(11):1017–1021. doi: 10.1136/jech.2009.094169. [DOI] [PubMed] [Google Scholar]
- 27.Sun B, Yan H, Zhang T. Built environmental impacts on individual mode choice and BMI: evidence from China. J Transp Geogr. 2017;63:11–21. [Google Scholar]
- 28.Ji CY. The prevalence of childhood overweight/obesity and the epidemic changes in 1985-2000 for Chinese school-age children and adolescents. Obes Rev. 2010;9(s1):78–81. doi: 10.1111/j.1467-789X.2007.00443.x. [DOI] [PubMed] [Google Scholar]
- 29.Fei X, Li JQ, Ware RS, Owen N. Associations of television viewing time with excess body weight among urban and rural high-school students in regional mainland China. Public Health Nutr. 2008;11(9):891–896. doi: 10.1017/S1368980007001280. [DOI] [PubMed] [Google Scholar]
- 30.China Health and Retirement Longitudinal Study. Secondary China Health and Retirement Longitudinal Study [http://charls.pku.edu.cn/zh-CN].Accessed 2011.
- 31.National Health and family planning commission. Nutrition improvement measures for the administration, 2010. Retrieve from: (http://www.nhc.gov.cn/wjw/gfxwj/201304/2d99c4ebe95047d28079d511e7582960.shtml).
- 32.Baron RM, Kenny DA. The moderator–mediator variable distinction in social psychological research: conceptual, strategic, and statistical considerations. J Pers Soc Psychol. 1986;51(6):1173. doi: 10.1037//0022-3514.51.6.1173. [DOI] [PubMed] [Google Scholar]
- 33.Iacobucci D. Mediation analysis and categorical variables: the final frontier. J Consum Psychol. 2012;22(4):582–594. doi: 10.1016/j.jcps.2012.03.009. [DOI] [PMC free article] [PubMed] [Google Scholar]
- 34.Graham S, Marvin S. Splintering urbanism: networked infrastructures, technological mobilities and urban condition. London: Rouledge; 2002. [Google Scholar]
- 35.Zhang L, Wang SX, Yu L. Is social capital eroded by the state-led urbanization in China? A case study on indigenous villagers in the urban fringe of Beijing. China Econ Rev. 2015;35:232–246. [Google Scholar]
- 36.Ozier AD, Kendrick OW, Leeper JD, Knol LL, Perko MA, Burnham J. Overweight and obesity are associated with emotion- and stress-related eating as measured by the eating and appraisal due to emotions and stress questionnaire. J Am Diet Assoc. 2008;108(1):49–56. doi: 10.1016/j.jada.2007.10.011. [DOI] [PubMed] [Google Scholar]
- 37.Liu Y, Zhang F, Wu F, Liu Y, Li Z. The subjective wellbeing of migrants in Guangzhou, China: the impacts of the social and physical environment. Cities. 2017;60:333–342. [Google Scholar]
- 38.Xiao Y, Wang Z, Li Z, Tang Z. An assessment of urban park access in Shanghai–implications for the social equity in urban China. Landscape Urban Plan. 2017;157:383–393. [Google Scholar]
- 39.Liu Ye, Xu Wei. Destination Choices of Permanent and Temporary Migrants in China, 1985-2005. Population, Space and Place. 2015;23(1):e1963. [Google Scholar]
- 40.Wang R, Xue D, Liu Y, Liu P, Chen H. The relationship between air pollution and depression in China: is Neighbourhood social capital protective? Inter J Env Res Pub Heal. 2018;15(6):1160. doi: 10.3390/ijerph15061160. [DOI] [PMC free article] [PubMed] [Google Scholar]
- 41.Wang R, Xue D, Liu Y, Chen H, Qiu Y. The relationship between urbanization and depression in China: the mediating role of neighborhood social capital. Int J Equity Health. 2018;17(1):105. doi: 10.1186/s12939-018-0825-x. [DOI] [PMC free article] [PubMed] [Google Scholar]
- 42.Lü J, Fu W, Liu Y. Physical activity and cognitive function among older adults in China: a systematic review. J Sport Health Sci. 2016;5(3):287–296. doi: 10.1016/j.jshs.2016.07.003. [DOI] [PMC free article] [PubMed] [Google Scholar]
- 43.Helbich M, Yao Y, Liu Y, et al. Using deep learning to examine street view green and blue spaces and their associations with geriatric depression in Beijing, China. Environ Int. 2019;126:107–117. doi: 10.1016/j.envint.2019.02.013. [DOI] [PMC free article] [PubMed] [Google Scholar]
- 44.Xu H, Short SE, Liu T. Dynamic relations between fast-food restaurant and body weight status: a longitudinal and multilevel analysis of Chinese adults. J Epidemiol Community Health. 2013;67(3):271–279. doi: 10.1136/jech-2012-201157. [DOI] [PMC free article] [PubMed] [Google Scholar]
- 45.Wang R, Lu Y, Zhang J, Liu P, Yao Y, Liu Y. The relationship between visual enclosure for neighbourhood street walkability and elders’ mental health in China: using street view images. J Transp Health. 2019;13:90–102. [Google Scholar]
- 46.Su S, Zhou H, Xu M, Ru H, Wang W, Weng M. Auditing street walkability and associated social inequalities for planning implications. J Transp Geogr. 2019;74:62–76. [Google Scholar]
- 47.Yin C, Sun B. Disentangling the effects of the built environment on car ownership: a multi-level analysis of Chinese cities. Cities. 2018;74:188–195. [Google Scholar]
- 48.Chen H, Liu Y, Zhu Z, Li Z. Does where you live matter to your health? Investigating factors that influence the self-rated health of urban and rural Chinese residents: evidence drawn from Chinese general social survey data. Health Qual Life Out. 2017;15(1):78. doi: 10.1186/s12955-017-0658-0. [DOI] [PMC free article] [PubMed] [Google Scholar]
- 49.Chen H, Liu Y, Li Z, et al. Urbanization, economic development and health: evidence from China’s labor-force dynamic survey. Int J Equity Health. 2017;16(1):207. doi: 10.1186/s12939-017-0705-9. [DOI] [PMC free article] [PubMed] [Google Scholar]
- 50.Gruberg L, Weissman NJ, Waksman R, Fuchs S, Deible R, Pinnow EE, Ahmed LM, Kent KM, Pichard AD, Suddath WO, Satler LF, Lindsay J. The impact of obesity on the short-term andlong-term outcomes after percutaneous coronary intervention: the obesity paradox? J Am Coll Cardiol. 2002;39(4):578–584. doi: 10.1016/s0735-1097(01)01802-2. [DOI] [PubMed] [Google Scholar]
- 51.Wingate MS, Alexander GR. The healthy migrant theory: variations in pregnancy outcomes among US-born migrants. Soc Sci Med. 2006;62(2):491–498. doi: 10.1016/j.socscimed.2005.06.015. [DOI] [PubMed] [Google Scholar]
- 52.Flowerdew R, Manley DJ, Sabel CE. Neighbourhood effects on health: does it matter where you draw the boundaries? Soc Sci Med. 2008;66(6):1241–1255. doi: 10.1016/j.socscimed.2007.11.042. [DOI] [PubMed] [Google Scholar]
Associated Data
This section collects any data citations, data availability statements, or supplementary materials included in this article.
Data Availability Statement
The datasets generated and/or analysed in the current study are available in the repository [http://charls.pku.edu.cn/zh-CN].