

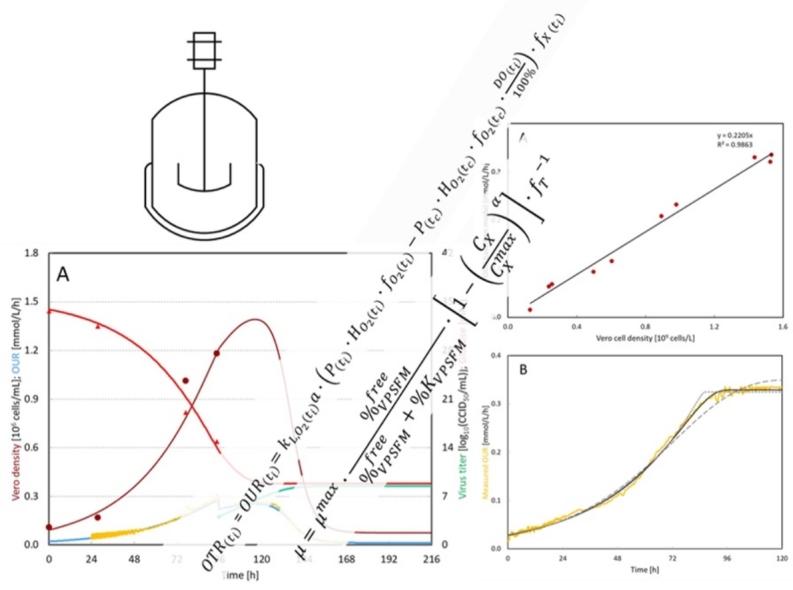
Graphical abstract
Keywords: Adherent cells, Virus infection, Model, Oxygen uptake rate
Highlights
-
•
Mathematical model for Vero cell growth in batch bioreactors.
-
•
Mathematical model for poliovirus proliferation on Vero cells.
-
•
Oxygen uptake rate as process analytical technology for simple process monitoring.
Abstract
The production of poliovirus vaccines in adherent Vero cells in batch bioreactors usually consists of a two-step upstream process: (1) Vero cell cultivation on microcarriers and (2) poliovirus proliferation. In this study we developed a mathematical model to describe this two-step process. We introduced the calculation of the oxygen uptake rate (OUR) and a correction of measurement for the sampling effect in order to ensure the high quality data sets. Besides the data of the OUR, we selected glucose concentration, Vero cell concentration and the virus titer for daily in process control to evaluate the progress of the process. With the selected data sets, the described model can accurately describe poliovirus production by Vero cells. Several other regular in process control samples (e.g. lactate concentration, ammonia concentration, and amino acids concentration) were excluded from the model, simplifying the process control analysis and minimizing labor.
Nomenclature
- OTR
oxygen transfer rate (mmol/L/h)
- OUR
oxygen uptake rate (mmol/L/h)
volumetric oxygen transfer coefficient (1/h)
- P
atmospheric pressure (bar)
Henry coefficient for oxygen (mmol/L/bar)
molar fraction of oxygen in the gas phase (%)
- DO
dissolved oxygen in liquid phase (%)
- fX
correction factor for sampling effects
- CX
Vero cell concentration in the bioreactor (106 cells/mL)
modeled maximum Vero cell concentration in the bioreactor (106 cells/mL)
virus concentration in the bioreactor (log10(CCID50/mL))
modeled maximum virus concentration in the bioreactor (log10(CCID50/mL))
- Ci
concentration of any growth-limiting nutrient (mmol/L)
- μ
Vero cell specific growth rate (1/h)
- μmax
modeled maximum Vero cell specific growth rate (1/h)
- kd
Vero cell specific decay rate (1/h)
- Ki
half-saturation constant for growth-limiting nutrient (mmol/L)
fraction of the free VP-SFM available for cell growth (%)
- %KVPSFM
relative half-saturation constant for VP-SFM (%)
- α
exponent of surface area limitation term
- fT
temperature impact factor on Vero cell growth rate
- β
exponent of virus concentration inhibition term
- qlysis
virus specific Vero cell lysis rate (cell/virus/h)
modeled maximum virus specific Vero cell lysis rate (cell/virus/h)
- qVPSFM
Vero cell specific VP-SFM consumption rate (L/109 cells/h)
- qglucose
Vero cell specific glucose consumption rate (mmol/109 cells/h)
Vero cell specific oxygen consumption rate (mmol/109 cells/h)
- Yi,j
yield of compound I on compound j
1. Introduction
The demand for affordable inactivated poliovirus vaccines (IPV) is increasing due to the global polio eradication efforts. With the purpose of reducing the current cost of IPV, the optimization of IPV production processes, including both poliovirus production and purification, has been constantly studied [1], [2]. The poliovirus production is usually performed in bioreactors and its production optimization is normally achieved by varying the operational parameters. In order to evaluate the process optimization results, it is crucial to calculate and compare cell specific rates and observed yields.
Poliovirus production is a two-step process. In the first step, Vero cells are cultivated on microcarriers in a bioreactor with batch mode. Once Vero cells reach the targeted concentration, which is normally in the exponential cell growth phase, the second step starts with adding poliovirus into the same bioreactor to infect the Vero cells. A similar process can be applied as the initial step for various viral vaccine productions. The general parameters, such as temperature, pH, dissolved oxygen and stirring speed are controlled by biocontrollers and are online monitored throughout the whole production process. In order to evaluate the performance of either cells or virus, offline samples have to be regularly taken to measure cell concentration, virus concentration and metabolite concentrations, like glucose, amino acids, and ammonia. The correlation between the operational parameters and measurement results of the offline samples can be a very useful tool for the design and optimization of a viral vaccine production processes. Therefore, many efforts have been made to develop a mathematical model as a tool for evaluation of all measurements involved in the viral vaccine production process [3], [4], [5], [6].
The current challenge for constructing a mathematical model for the viral vaccine production processes is the complicated culture medium composition. The culture medium used for both cell and virus culture usually contains multiple carbon, nitrogen and energy sources, which support many intracellular metabolisms. The complex medium composition therefore makes it very difficult to identify and predict the function of each chemical in the metabolism pathways. The construction of one structured metabolic model is out of scope in this study. Several unstructured mathematical models are already described and available from previous studies. Most of them focused on the viral infection step, using the standard model developed by Perelson et al. [4], which classified host cells into uninfected host cells and infected host cells during HIV-1 infection phase. Afterwards, this standard model has been widely applied to describe various virus production systems. Nelson et al. [7] introduced an age-structured function to the standard model, creating a more flexible framework for modeling HIV-1. Nelson and Perelson [8] developed a delayed model to describe the delayed time of initial infection until the production of new HIV-1 virus. Möhler et al. [5] extended the standard model to the large-scale production of influenza virus in a culture system, using microcarrier beads as a solid support for adherent cell culture, with considering the surface area limitation of the microcarriers. Schulze-Horsel et al. [9] intensified Mohler's model by also considering apoptotic uninfected cells and apoptotic infected cells. Besides the models focused only on the viral infection step, models for host cell growth dynamics are also available. Xing et al. [10] and Lopez-Meza et al. [11] described a kinetic model for the growth of CHO cells. A model for simulating the two-step virus production process is, however, not often described. Power et al. [3] and Ursache et al. [6] respectively reported a model for baculovirus production in insect cells and for poliovirus production in Vero cells. With the purpose of understanding the virus production process more thoroughly and developing a more adequate mathematical model, more off-line samples for cell metabolism analysis (e.g. amino acids samples) were taken from the bioreactor to study the functionality of different nutrients in Vero cells [6]. A direct consequence of this is that the model becomes more complicated. More off-line samples also generate more products for analysis, consuming more materials from the production process, and may potentially increase the risk of production process contamination. Moreover, the function of those additional amino acids samples on the viral vaccine production process is still elusive [6], [12], [13]. Here we aim to establish a simplified black box model that can predict cell growth and virus production based on a limited amount of parameters.
Bioreactors are currently widely implemented for vaccine production. On-line measurements in these bioreactors can be used as process analytical technology (PAT), providing the possibility of evaluating the production process without frequent sampling. Manufacturers are expected by regulatory agencies to apply such on-line process monitoring and control. Several operational parameters such as dissolved oxygen, are constantly monitored. The mathematical model developed in this study focuses on using on-line oxygen data for guiding and evaluating the poliovirus vaccine production process on non-chemical defined medium. Here we introduce the online measured oxygen uptake rate as the sole mean to predict cell growth, substrate consumption and product formation.
2. Material and methods
2.1. Cells and viruses
Vero cells obtained from WHO (10-87) originally derived from ATCC (CCL-81) were used as host for poliovirus production. Poliovirus seeds [14] Sabin type 2 ((P712 Ch2ab-KP2; SO+3) was used.
2.2. Precultures
Adherent Vero cells were cultivated at 37 °C; 5% CO2 in T-flasks and cell factories in VP-SFM (Thermo Fisher Scientific) supplemented with 2 mM l-glutamine (Invitrogen) and 20 mM glucose for cell expansion. For subcultivation, cells were washed with PBS and harvested by trypsinization with TrypLE select (Thermo Fisher Scientific). Once the cell number was sufficient, the harvested cells were used to inoculate the bioreactors.
2.3. Bioreactor Vero cell cultures
Bioreactors with 2.3 L working volume were used in this study to cultivate Vero cells growing adherent to microcarriers (3 g/L Cytodex 1, GE Healthcare) in VP-SFM (Thermo Fisher Scientific). The pH, temperature, dissolved oxygen (DO) and stirring speed were respectively maintained at the value of 7.2, 37 °C, 50% and 90 rpm. The flow of air to the headspace of the bioreactors was controlled with a mass flow controller and maintained at 1 L/min. Cultivations were controlled by Sartorius Biostat B-DCU-3 control unit and MFCS-win software (Sartorius AG, Göttingen, Germany). All of the bioreactors were operated in batch mode and inoculated at cell density of approximately 0.1 × 10⁶ cells/mL. The initial glucose and glutamine concentration were 35 mM and 4 mM.
2.4. Virus culture
The same bioreactors used for Vero cell culture were used for virus infection. Sabin type 2 poliovirus was used to infect the Vero cells. Prior to virus infection, the pH, temperature and DO settings were adjusted to 7.4, 32.5 °C and 25% as previously described for the cultivation of poliovirus [1], [2], [6]. In this study, different times of infection (TOI) and multiplicities of infection (MOI) were applied to the bioreactors. Table 1 shows the experimental setup in this study. Virus culture was considered complete when >95% of cytopathic effect (CPE) was observed under microscope.
Table 1.
The setup of the experiments in this study.
| Experiment # | TOI [h] | Growth phase | Cell densitya [106/mL] | MOI [–] | Purpose |
|---|---|---|---|---|---|
| 1 | 96 | Exponential | 1.2 | 0.01 | Parameter identification |
| 2 | 96 | Exponential | 1.1 | 0.0001 | Parameter identification |
| 3 | 120 | Stationary | 1.7 | 0.01 | Parameter identification |
| 4 | 120 | Stationary | 1.4 | 0.0001 | Parameter identification |
| 5 | 96 | Exponential | 1.2 | 0.001 | Model validation |
Measured cell density at the time of infection.
2.5. Analytical methods
1 mL cell culture was daily counted with a Nucleocounter NC-100 (Chemometec). 1 mL microcarrier free supernatant sample was taken for measurement of glucose and glutamine concentration by using a Bioprofile 100 plus (Nova Biomedical, Waltham, MA). Sabin type 2 poliovirus titer was quantified with a virus titration assay as described previously [15].
2.6. Modeling
The software Microsoft Excel was used for all data treatment and modeling. The solver function in Excel was used for parameter estimations based on fitting of the model to the measurements. The Microsoft Excel solver tool uses the Generalized Reduced Gradient (GRG2) nonlinear optimization code.
3. Data treatment and modeling
3.1. Oxygen uptake rate and correction factor
One of the major targets of this study is to implement oxygen uptake rate (OUR) to describe Vero cell activity during both cell growth phase and virus infection phase. Since oxygen is the only electron acceptor in this process, OUR in principle can be used to express cell activity. Therefore, the possibility of predicting cell activities based on online oxygen consumption instead of regular offline sampling was studied in this work.
During the bioreactor operation, DO in the bioreactor was maintained at set point by varying the gas composition in the headspace. This allowed us to calculate the oxygen transfer rate (OTR), which is equal to OUR of the cells in the bioreactor. Yamada et al. [16], Konstantinov et al. [17] and Wong et al. [18] have already demonstrated that OUR can accurately express cell activities. However, OUR was hardly used as guidance for viral production. This research created a tool of using OUR calculated from online DO monitoring for poliovirus production model development. Eq. (1) indicates the way of calculating the OUR in the bioreactor.
| (1) |
where is the volumetric oxygen transfer coefficient and was determined as described by van Eikenhorst et al. [19]. P stands for the atmospheric pressure, which is assumed to be 1 bar. is Henry coefficient for oxygen, which is assumed to be 1.02 mmol/L/bar at 37 °C. is the molar fraction of oxygen in the headspace of bioreactor and DO is dissolved oxygen in the liquid phase. tc represents the condition at the time of DO probe calibration, which was performed at 37 °C.
A number of Vero cell samples were taken for cell counting and metabolite analysis during the bioreactor operation. The more samples are taken, the more cells are lost, which leads to a underestimation of OUR. Depending on the frequency of sampling, the cells that were removed from the bioreactor could reach up to 10% of the overall biomass in the lab-scale bioreactor. In order to balance the OUR underestimation, a correction factor: was introduced to correct for the deviation caused by sampling. This correction factor was calculated according to the method described by Johnson et al. [20].
3.2. Kinetics for Vero cell growth phase
As the first step of viral vaccine production process, Vero cells were cultivated on microcarriers with VP-SFM as growth medium in this study. Cell growth can be described by Eq. (2):
| (2) |
where μ is the growth rate of Vero cells. CX is the cell concentration in the bioreactor. kd stands for the decay rate of cells, which usually is negligible as compared to the cell growth rate [6]. To simplify the model, the decay rate is assumed to be zero in this study.
In our bioreactor system, two factors, namely the growth-limiting nutrient concentration and surface area availability were assumed to have a direct impact on the cell growth rate. With the depletion of the growth-limiting nutrient in the medium, the cell growth rate approaches to zero and cells eventually reach the stationary phase. The Monod equation is widely used to describe the growth rate dynamics as a function of the concentration of the growth-limiting factor (Eq. (3)).
| (3) |
where μmax stands for the theoretical maximal Vero cell specific growth rate. Ci is the concentration of any growth-limiting nutrient and Ki is the half-saturation constant for the corresponding nutrient. It is, however, difficult to identify the actual growth-limiting nutrient in our case, because the medium composition of VP-SFM is unknown. Ursache et al. [6] attempted to determine if certain amino acids in VP-SFM constrained Vero cells growth, but the results were inconclusive. It was decided that VP-SFM could be considered as one growth-limiting factor. At the start of bioreactor operation, VP-SFM is considered as 100% for cell growth. With the growth of cells, VP-SFM is consumed and eventually reaches 0% when no cell number increase is observed. Therefore, Eq. (3) is modified to Eq. (4) by introducing the concept of relative half-saturation constant.
| (4) |
where stands for the fraction of the free VP-SFM available for cell growth. %KVPSFM is the relative half-saturation constant of VP-SFM.
For adherent cells growing on microcarriers, surface area availability could also be the growth-limiting factor. A sigmoid function was used to describe the surface limitation influence on cell growth rate (Eq. (5)).
| (5) |
where stands for the maximum cell concentration. Like Möhler et al. [5], Eq. (5) was constantly used for describing the surface area limiting effect on the cell growth rate. This equation assumes that the cell growth rate linearly decreases with the cell concentration increase. However, this linear correlation may not be true according to our experience from the bioreactors operated in the semi-batch mode (data not shown). A modified equation (Eq. (6)) is proposed for describing the surface area limitation (and nutrient limitation).
| (6) |
where α is the exponent of surface area limitation term. When α equals to 1, the surface area limitation is linear as in Eq. (5).
For other cell specific rates, such as VP-SFM uptake rate, glucose consumption rate and oxygen consumption rate can be calculated through Herbert-Pirt type of relationship (Eqs. (7), (8), (9)).
| (7) |
| (8) |
| (9) |
where qVPSFM, qglucose and respectively represent Vero cell specific VP-SFM consumption rate, glucose consumption rate and oxygen consumption rate. YX,VPSFM, YX,glucose and correspond to the yield of Vero cells on VP-SFM, on glucose and on oxygen.
3.3. Kinetics for virus infection phase
During the poliovirus infection phase, bioreactor operational temperature was reduced from 37 °C to 32.5 °C to minimize the mutation rate of Sabin type 2 poliovirus [21]. The lowered temperature could bring another side effect, which is a slower metabolism rate of the Vero cells. Next to the temperature effect, the added poliovirus also makes the process much more complex. The virus first enters the cell, subsequently alters the host cell metabolism in favor of virus proliferation and eventually new virus are released by lysis of the infected host cells. It is assumed that one single virus attacks one Vero cell at the time of infection. Once virus was added into the bioreactor, two groups of Vero cells can be defined:
-
1.Uninfected cells (CX,uninfected): Uninfected cells can continue grow by consuming medium, glucose and oxygen at a lower temperature (Eq. (10)).
(10) where fT indicates the impact of the reduced temperature on Vero cells growth rate.
-
2.Lysed cells (CX,lyzed): Lysed cells are assumed to have no biological activity and to be involved in cell infection and releasing poliovirus. The host cell infection and lysis were lumped together in term of virus specific cell lysis rate (qlysis), which was observed to be dependent on the virus concentration in this study. It was observed that virus specific cell lysis rate was inhibited by a high virus concentration (i.e. high virus titer value). Eq. (11) is therefore used to describe this phenomenon.
(11) where is the maximum virus specific cell lysis rate. represents the maximum virus concentration that can be reached. is the virus concentration in the bioreactor and β is the exponent of virus concentration inhibition term.
The kinetics of lysed cells is dependent on the virus specific cell lysis rate and virus concentration (Eq. (12)).
| (12) |
This equation is different from the equations originally derived from Power et al. [3], which stated that the lysed cell kinetics was dependent on uninfected cell concentration, virus concentration and virus specific infection. Although the equation used by Power et al. [3] can adequately describe the measurement, the definition of virus specific infection in their work is confusing from biological meaning perspective. The unit of virus specific infection rate in their work was liter per virus per hour, which can be literally translated to be how many liter of bioreactor can be infected by one virus in one hour. In our opinion, virus specific infection rate should be independent on bioreactor volume or cell concentration, and only be dependent of virus concentration. Therefore, Eq. (12) was used in this study.
In the model developed in this study, it is assumed that each Vero cell has the same yield of releasing poliovirus. Since virus is only released from the lysed cells, newly produced virus can be calculated as Eq. (13). The decay of poliovirus was not observed in our study, it was therefore excluded from the model.
| (13) |
where is the yield of virus produced on lysed cells.
During the virus infection phase, the uninfected cells encounter the competition between cell growth and virus infection. The uninfected cell concentration dynamics can be described by Eq. (14).
| (14) |
3.4. Parameter estimation
The mathematical model (see Table 2 for overview of model parameters) was used to calculate all rates and concentrations of all relevant compounds (glucose and oxygen) at time steps of 0.25 h. For each sampling time point, the modeled data for each compound were compared with the measured data and the relative errors were calculated, squared and summed up (Eq. (15)).
| (15) |
Table 2.
Model parameters.
| Parameter/initial conditions | Value | Constant or estimated |
|---|---|---|
| Half-saturation constant for VPSFM | %KVPSFM = 0.127 L/L | Constant |
| Yield of Vero cells on VPSFM | YX,VPSFM = 1.4 × 10⁶ cells/mL | Constant |
| Max. cell density on 3g/L cytodex-1 | Constant | |
| Exponent of surface area limitation term | α = 5 | Constant |
| Max. cell growth rate | μmax | Estimated |
| Exponent of virus concentration inhibition term | B | Estimated |
| Yield of Vero cells on glucose | YX,glucose | Estimated |
| Yield of Vero cells on O2 | Estimated | |
| Yield of virus on Vero cells | Yvirus,X | Estimated |
| Temperature factor on Vero cell growth rate | fT | Estimated |
| Max. virus specific cell lysis rate | Estimated |
Each sum of squared relative error for the different measurements was summed up to the total error between measurements and model (EM, Eq. (16)) which was computed with the aim to minimize this error.
| (16) |
With i = glucose, oxygen, Vero cells, virus.
4. Results and discussion
4.1. Comparison of the model and experiments
Several experiments performed under different conditions have been evaluated with the model developed in this study. Fig. 1 shows the model fitting to the measurements for all the experiments performed in this study. The detailed operational parameters for four bioreactors shown in Fig. 1 can be found in Table 1. The model was able to describe the initial Vero cell exponential growth phase in all cases. Dependent of the applied time of infection, Vero cells entered the stationary phase in some cases (Fig. 1C and D), which could also be simulated by the model. After addition of Sabin type 2 poliovirus to the bioreactor, the virus started to replicate and induced lysis of host cells. Although no off-line samples were taken during the virus infection phase due to biosafety reasons, the on-line monitored OUR could represent cell activity very accurately. After the virus addition, one relative stable phase was observed based on OUR data. The duration of this phase was mainly dependent on the MOI used. The lower MOI resulted in a longer stable phase. This stable phase was a result of dynamic equilibrium between uninfected Vero cells and the lysed Vero cells. After this stable period during the virus infection phase, OUR declined dramatically and the bioreactors were stopped when >95% CPE was observed, which in general was when OUR reached about 0.01 mmol/L/h.
Fig. 1.

Overview of experimental results of Vero cells grown on microcarriers infected with Sabin type 2 poliovirus in four bioreactors. A: bioreactor 1 (TOI = 96 h and MOI = 0.01); B: bioreactor 2 (TOI = 96 h and MOI = 0.0001); C: bioreactor 3 (TOI = 120 h and MOI = 0.01) and D: bioreactor 4 (TOI = 120 h and MOI = 0.0001). (●) indicates the measured Vero cell density. (▴) indicates the measured glucose concentration. (♦) indicates the measured virus titer. Yellow lines are the measured OUR. Brown lines are the modeled Vero cell density. Red lines are the modeled glucose concentration, blue lines are the modeled OUR and the green lines are the modeled virus titer. (For interpretation of the references to color in this figure legend, the reader is referred to the web version of this article.).
Irrespective of the operational conditions employed, all relevant measurements (i.e. Vero cell density, OUR, glucose concentration and virus titer) showed a very high coefficient of determination (R2) between the measurement and the predictions generated by the model (Fig. 2). The rates and yields estimated by the model from all the experiments are listed in Table 3. It was observed that most of the relevant parameters were highly consistent, independent on the MOI and TOI applied in this study. On average, the maximum Vero cell growth rate was 0.032 h−1, which was comparable to the literature [6], [12], [13]. Sabin type 2 poliovirus showed a cell lysis rate of approximately 0.0012 cell/virus/h and each lysed cell released around 225 infectious virus particles. For the purpose of model validation, the averaged parameters from bioreactor 1 to 4 were applied to predict the performance of bioreactor 5. With those averaged parameter values, the activity of bioreactor 5 could also be adequately described (Fig. 3). The R2 value of each parameter in this validation bioreactor was very close to 1 (Appendix A).
Fig. 2.

Modeling results. Figures show the correlation between the experimental data and the modeled data. (●) indicates the results from bioreactor 1. (♦) indicates the results from bioreactor 2. (▴) indicates the results from bioreactor 3. (■) indicates the results from bioreactor 4. (×) indicates the results from bioreactor 5.
Table 3.
Overview of parameters, variables and model derived yields and rates in this study.
| Parameters Variables |
Unit | 1 | 2 | 3 | 4 | 5a | Reference |
|---|---|---|---|---|---|---|---|
| TOI | H | 96 | 96 | 120 | 120 | 96 | N.A |
| MOI | – | 0.01 | 0.0001 | 0.01 | 0.0001 | 0.001 | N.A |
| μmax | h−1 | 0.032 | 0.031 | 0.032 | 0.032 | 0.032 | 0.036b |
| Xstart | 106 cells/mL | 0.093 | 0.089 | 0.102 | 0.095 | 0.107 | N.A |
| mmol/109 cells/h | 0.23 | 0.23 | 0.23 | 0.22 | 0.23 | 0.24c | |
| fT | – | 1.3 | 1.3 | 1.3 | 1.3 | 1.3 | N.A |
| qinfection | cell/virus/h | 0.0012 | 0.0014 | 0.0012 | 0.0012 | 0.0013 | N.A |
| Yvirus,X | virus/cell | 236 | 225 | 225 | 225 | 228 | N.A |
| YX,glucose | 109 cells/mmol | 0.055 | 0.048 | 0.053 | 0.049 | 0.051 | 0.039d |
| α | – | 5 | 5 | 5 | 5 | 5 | N.A |
| β | – | 11.6 | 10.3 | 11.6 | 10.3 | 11.0 | N.A |
Fig. 3.

Modeling results from validation experiment (bioreactor 5). (●) indicates the measured Vero cell density. (▴) indicates the measured glucose concentration. (♦) indicates the measured virus titer. Yellow lines are the measured OUR. Brown lines are the modeled Vero cell density. Red lines are the modeled glucose concentration and blue lines are the modeled OUR. (For interpretation of the references to color in this figure legend, the reader is referred to the web version of this article.)
The amount of mathematical models to predict viral vaccine production kinetics, including both cell culture and virus culture, is very limited to our knowledge. Power et al. [3] developed one model, describing the overall process for baculovirus production in suspension insect cell culture. The kinetics used in that study to simulate the cell-virus interaction was similar to that used later on by Perelson et al. [4] and Möhler et al. [5]. The model constructed by Möhler et al. [5] specifically focused on the virus infection phase in cells grown as a microcarrier culture. Several derivative models were adapted based on those two articles, but the major structure of the models were very comparable [7], [9]. Ursache et al. [6] is the only model that was specifically constructed for the production of poliovirus. As compared to the abovementioned models, the model developed in this study is much more simplified in terms of removing all factors irrelevant to cell growth and only considering uninfected cells and lysed cells during the virus infection phase.
In order to understand the metabolism kinetics of cell growth, some studies intended to seek the essential nutrients for cells [6], [12], [13], [22], but no strong conclusions could be generated. A cell growth experiment with additional amino acids and vitamins was carried out to determine if an amino acid or vitamin could be the growth limiting factor. No improvements in terms of increased growth rate or increased maximum cell density were observed (data not shown). This observation implied that some other unknown compound must be the growth limiting factor. We decided to lump all the potential growth essential compounds in the medium together by associating cell activity to medium consumption. The transition from cell exponential phase to stationary phase could still be described by the medium availability in the bioreactor without knowing the exact growth limiting factor in the medium (Eq. (4)). With the new model, it is possible to predict the medium availability at any time point, which is associated with cell status and the model can be potentially used for further process optimization. For instance, cells could still grow slightly in our case after the moment of infection (96 h) when medium was still available (Fig. 4). According to the model, the medium was predicted to be depleted at around 120 h. At that time, the cells entered the stationary phase and the cell metabolism could be changed due to this growth phase switch. Considering the fact that viruses are preferably to be produced in the cell exponential growth phase throughout the whole process, the process parameters have to be modified. It could be an option of using either a higher MOI with the same infection time or one earlier infection time with the same MOI in order to ensure that no medium depletion occurs before full CPE is observed.
Fig. 4.

The examples of medium consumption (green dot line) and CPE calculation (black dashed line) according to the model. The blue line indicates uninfected Vero cell density in the bioreactor and the red line indicates the lysed cell density in the bioreactor. The gray dashed line indicated the TOI, which equals to 96 h. The MOI was 0.01. (For interpretation of the references to color in this figure legend, the reader is referred to the web version of this article.)
The other model simplification was achieved by taking only uninfected cells and lysed cells into account during the infection phase. Ursache et al. [6] considered three cell populations during the virus infection phase: uninfected, infected, lysed cells. Although this model can very nicely describe cell lysis, quantification between those cell populations is still difficult. The determination of kinetics (e.g. OUR) of those three cell populations is even more challenging. Therefore, it was decided to only consider two cell populations: uninfected cells, which could still contribute to oxygen consumption and lysed cells, which were infected, lysed and ceased all biological activities. These two cell populations could be reflected by cell viability measurement and OUR measurement. The direct impact of shrinking cell population number was minimizing the amount of parameters in the model, from seven parameters to three parameters (μ, qlysis and ) used in this study.
4.2. Application of OUR for process evaluation
OUR is a helpful tool for process control. As compared to offline sampling, the DO probe records data with much higher frequency than offline samples without consuming any cell culture. Moreover, the OUR of Vero cells in the bioreactors showed a linear relationship with cell density (Fig. 5A), which allows it to calculate the cell density at any time point during the process. The observed cell specific oxygen uptake rate was on average 0.23 mmol/109 cells/h with VP-SFM as medium (Table 3). This rate is dependent on the type of cell line and type of electron source. It is unfair to directly compare oxygen uptake rate data with literature data without knowing the electron donor in the medium. Nevertheless, the reported Vero cell oxygen uptake rate was about 0.24 mmol/109 cells/h in DMEM [23], which is in the same order of magnitude as our measurement.
Fig. 5.

An example of OUR application. (A) The relationship between cell density and OUR. (B) The half-saturation constant estimation for VP-SFM. The yellow line indicates the measured OUR. The solid black line indicates the best fitting to the measurement with . The black dashed line indicates the fitting with 10 times higher of best fitting value with , whereas the black dot line indicates the fitting with 10 times lower of best fitting value with . (For interpretation of the references to color in this figure legend, the reader is referred to the web version of this article.)
Since the OUR data can reflect the cell concentration, it could possibly be extended to estimate the amount of CPE (lysed cell). CPE is normally observed under microscope by daily manual sampling. From a biosafety viewpoint, sampling during the virus infection phase is undesired due to the risk of bioreactor contamination and virus spill. OUR allows CPE estimation without sampling. Fig. 4 shows the example of implementing OUR to calculate the CPE development during the virus infection. In this example, the calculated CPE according to OUR was 95% at the time of stopping the bioreactor operation, which was in agreement with our visual observation.
During OUR monitoring for CPE estimation, an interesting phenomenon was observed. The volumetric cell lysis rate is expected to be proportional to the virus concentration. CPE should be in principle buildup faster with increasing virus concentration. However, the observed virus specific Vero cell lysis rate surprisingly decreased dramatically at the end of the virus infection phase in all cases in this study (Figs. 1, 3 and 4). Power et al. [3], Perelson et al. [4] and Möhler et al. [5] attributed this phenomenon to the decline of cell concentration. It could be expected that the virus infection process would be prolonged by infecting cells at low cell concentration based on their hypothesis. However, Ursache et al. [6] reported no impact from different time of infection on the process in the range of 0.5 × 10⁶ cells/mL and 0.9 × 10⁶ cells/mL. An empirical equation (Eq. (11)) was therefore used in this study to demonstrate this observation as virus inhibition. A hypothesis for this phenomenon could be that a sub-population of the Vero cells is less susceptible to lysis.
Besides allowing to estimate the cell density during the process, OUR also provided the possibility to calculate the half-saturation constant of VP-SFM (% KVPSFM). The decreased cell growth rate during the transition from cell exponential phase to the stationary phase can be explained by either medium limitation or surface area limitation in our study. With the microcarrier concentration used in this study, the maximal cell density was expected to be around 3 × 10⁶ cells/mL [2]. Compared to the cell density observed in this study, which was less than 1.5 × 10⁶ cells/mL, the surface area was excluded as the limiting factor in this work. Therefore, the decreased cell growth rate can be attributed to the medium limitation. Fig. 5B shows one example of OUR development during a Vero cell growth experiment, where cells were not infected with virus. %KVPSFM can be estimated by data fitting by using Eq. (4). The best fit was obtained with the value of %KVPSFM at 0.127 L/L, which suggested that the Vero cell growth rate was halved when around 87% of the medium was consumed.
Due to the application of OUR in cell density estimation, CPE estimation and half-saturation constant estimation of medium, the calculation of OUR based on the online monitored DO can be potentially used as PAT in pharmaceutical manufacturing to define for instance the infection time point or harvest moment. We showed that the online measured oxygen uptake rate can be used as the sole mean to predict cell growth, substrate consumption and product formation, making it a widely available and affordable PAT tool compared to other more complex on-line measurement systems, such as capacitance, that have been described to also monitor cell growth and virus production [24], [25], [26]. On the other hand, using capacitance probes allow to follow the cell and virus culture in more detail as also parameters like cell size could be monitored [24]. The use of OUR is applicable to different cell based production systems [27], [28].
4.3. Model limitation
There is no perfect model but only an adequate model. Each model has assumptions and its own limitations. The current model based on OUR can very well describes the cellular exponential phase, stationary phase and virus infection phase. However, the cell decay in the death phase was excluded from this model, because the process was designed with the aim of using each Vero cell for virus production. Allowing cells to reach their death phase during the viral vaccine production is bound to waste raw materials and should be avoided during the process design. Cellular decay may still occur when a combination of late TOI and low MOI is used. The longer the process lasts, the higher the chance for cells to reach their death phase. The kinetics of cell decay is closely related with the specific cell line and growth medium used. It was observed that additional amino acids to VP-SFM had no impact on cell growth rate or maximum cell density but could prolong the stationary phase and delay the death phase of Vero cells (data not shown). However, the specific amino acids responsible for this remain unclear. It is therefore difficult to include cell decay during the death phase in the current model.
The second part that can be improved in the current model is the differentiation of Vero cells during the virus infection phase. In reality, the performance of host cells during virus infection phase should be a dynamic of uninfected cells, infected cells and lysed cells. However, the infected cells and lysed cells were combined in this model due to the difficulty to quantify the fraction of infected cells and to determine the kinetics of the infected cells. The Nucleocounter NC-100 could only quantify intact cells and lysed cells. Due to the low MOI used in this study, uninfected cells and infected cells were already generated at the start of virus infection, making it impossible to fractionate the uninfected cells and the infected cells based on OUR without knowing the OUR kinetics of infected cells. In order to determine the OUR of infected cells, uninfected cells can be eliminated by implementing a relatively high MOI (e.g. MOI = 10), which infects all cells at once at the start of infection. Based on the different OUR of uninfected cells and infected cells, there is a possibility of estimating the fraction of those two groups of cells from the overall measured OUR.
5. Conclusions
The aim of this study was to develop a simplified unstructured model as a tool to identify both cell specific and virus specific rates and yields at any time point of an experiment. The accurately estimated rates and yields can be used for process comparison, especially for the process optimization purpose. OUR is a powerful tool to monitor viral vaccine production processes. The developed model is competent for all the conditions in this work, implying a good understanding of our process. The current model is batch mode based but can be extended for semi-batch, perfusion or recirculation mode for viral vaccine production.
Conflicts of interest
None declared.
Acknowledgments
We thank Andre Hijweegen for the practical work and Dinja Oosterhoff for scientific discussion on cell biology of virus infection. This work was partially supported by the World Health Organization in the project “Sabin-IPV Animal Component Free process development and optimization (PO201545143)”.
Footnotes
Supplementary data associated with this article can be found, in the online version, at https://doi.org/10.1016/j.procbio.2019.03.010.
Appendix A. Supplementary data
The following are the supplementary data to this article:
References
- 1.Thomassen Y.E., van 't Oever A.G., van Oijen M.G.C.T., Wijffels R.H., van der Pol L.A., Bakker W.A.M. Next generation inactivated polio vaccine manufacturing to support post polio-eradication biosafety goals. PLoS One. 2013;8(12):e83374. doi: 10.1371/journal.pone.0083374. [DOI] [PMC free article] [PubMed] [Google Scholar]
- 2.Thomassen Y.E., Rubingh O., Wijffels R.H., van der Pol L.A., Bakker W.A.M. Improved poliovirus D-antigen yields by application of different Vero cell cultivation methods. Vaccine. 2014;32(24):2782–2788. doi: 10.1016/j.vaccine.2014.02.022. [DOI] [PMC free article] [PubMed] [Google Scholar]
- 3.Power J., Greenfield P.F., Nielsen L., Reid S. Modelling the growth and protein production by insect cells following infection by a recombinant baculovirus in suspension culture. Cytotechnology. 1992;9(1):149–155. doi: 10.1007/BF02521742. [DOI] [PubMed] [Google Scholar]
- 4.Perelson A.S., Neumann A.U., Markowitz M., Leonard J.M., Ho D.D. HIV-1 dynamics in vivo: virion clearance rate, infected cell life-span, and viral generation time. Science. 1996;271(5255):1582. doi: 10.1126/science.271.5255.1582. [DOI] [PubMed] [Google Scholar]
- 5.Mohler L., Flockerzi D., Sann H., Reichl U. Mathematical model of influenza A virus production in large-scale microcarrier culture. Biotechnol. Bioeng. 2005;90(1):46–58. doi: 10.1002/bit.20363. [DOI] [PubMed] [Google Scholar]
- 6.Ursache R.V., Thomassen Y.E., van Eikenhorst G., Verheijen P.J.T., Bakker W.A.M. Mathematical model of adherent Vero cell growth and poliovirus production in animal component free medium. Bioprocess Biosyst. Eng. 2015;38(3):543–555. doi: 10.1007/s00449-014-1294-2. [DOI] [PubMed] [Google Scholar]
- 7.Nelson P.W., Gilchrist M.A., Coombs D., Hyman J.M., Perelson A.S. An age-structured model of HIV infection that allows for variations in the production rate of viral particles and the death rate of productively infected cells. Math. Biosci. Eng. 2004;1(2):267–288. doi: 10.3934/mbe.2004.1.267. [DOI] [PubMed] [Google Scholar]
- 8.Nelson P.W., Perelson A.S. Mathematical analysis of delay differential equation models of HIV-1 infection. Math. Biosci. 2002;179(1):73–94. doi: 10.1016/s0025-5564(02)00099-8. [DOI] [PubMed] [Google Scholar]
- 9.Schulze-Horsel J., Schulze M., Agalaridis G., Genzel Y., Reichl U. Infection dynamics and virus-induced apoptosis in cell culture-based influenza vaccine production—flow cytometry and mathematical modeling. Vaccine. 2009;27(20):2712–2722. doi: 10.1016/j.vaccine.2009.02.027. [DOI] [PubMed] [Google Scholar]
- 10.Xing Z., Bishop N., Leister K., Li Z.J. Modeling kinetics of a large-scale fed-batch CHO cell culture by Markov chain Monte Carlo method. Biotechnol. Prog. 2009;26(1):208–219. doi: 10.1002/btpr.284. [DOI] [PubMed] [Google Scholar]
- 11.López-Meza J., Araíz-Hernández D., Carrillo-Cocom L.M., López-Pacheco F., Rocha-Pizaña M.D.R., Alvarez M.M. Using simple models to describe the kinetics of growth, glucose consumption, and monoclonal antibody formation in naive and infliximab producer CHO cells. Cytotechnology. 2016;68(4):1287–1300. doi: 10.1007/s10616-015-9889-2. [DOI] [PMC free article] [PubMed] [Google Scholar]
- 12.Petiot E., Guedon E., Blanchard F., Geny C., Pinton H., Marc A. Kinetic characterization of vero cell metabolism in a serum-free batch culture process. Biotechnol. Bioeng. 2010;107(1):143–153. doi: 10.1002/bit.22783. [DOI] [PubMed] [Google Scholar]
- 13.Quesney S., Marc A., Gerdil C., Giminez C., Marvel J., Richard Y., Meignier B. Kinetics and metabolic specificities of Vero cells in bioreactor cultures with serum-free medium. Cytotechnology. 2003;42(1):1–11. doi: 10.1023/A:1026185615650. [DOI] [PMC free article] [PubMed] [Google Scholar]
- 14.Bakker W.A.M., Thomassen Y.E., van 't Oever A.G., Westdijk J., van Oijen M.G.C.T., Sundermann L.C., van 't Veld P., Sleeman E., van Nimwegen F.W., Hamidi A., Kersten G.F.A., van den Heuvel N., Hendriks J.T., Van der Pol L.A. Inactivated polio vaccine development for technology transfer using attenuated Sabin poliovirus strains to shift from Salk-IPV to Sabin-IPV. Vaccine. 2011;29(41):7188. doi: 10.1016/j.vaccine.2011.05.079. [DOI] [PubMed] [Google Scholar]
- 15.Thomassen Y.E., van der Welle J.E., van Eikenhorst G., van der Pol L.A., Bakker W.A.M. Transfer of an adherent Vero cell culture method between two different rocking motion type bioreactors with respect to cell growth and metabolic rates. Process Biochem. 2012;47(2):288–296. [Google Scholar]
- 16.Yamada K., Furushou S., Sugahara T., Shirahata S., Murakami H. Relationship between oxygen consumption rate and cellular activity of mammalian cells cultured in serum-free media. Biotechnol. Bioeng. 1990;36(7):759–762. doi: 10.1002/bit.260360715. [DOI] [PubMed] [Google Scholar]
- 17.Konstantinov K., Chuppa S., Sajan E., Tsai Y., Yoon S., Golini F. Real-time biomass-concentration monitoring in animal-cell cultures. Trends Biotechnol. 1994;12(8):324–333. doi: 10.1016/0167-7799(94)90049-3. [DOI] [PubMed] [Google Scholar]
- 18.Wong T.K.K., Nielsen L.K., Greenfield P.F., Reid S. Relationship between oxygen uptake rate and time of infection of Sf9 insect cells infected with a recombinant baculovirus. Cytotechnology. 1994;15(1):157–167. doi: 10.1007/BF00762390. [DOI] [PubMed] [Google Scholar]
- 19.van Eikenhorst G., Thomassen Y.E., van der Pol L.A., Bakker W.A. Assessment of mass transfer and mixing in rigid lab-scale disposable bioreactors at low power input levels. Biotechnol. Prog. 2014;30(6):1269–1276. doi: 10.1002/btpr.1981. [DOI] [PubMed] [Google Scholar]
- 20.Johnson K., Kleerebezem R., van Loosdrecht M.C.M. Model-based data evaluation of polyhydroxybutyrate producing mixed microbial cultures in aerobic sequencing batch and fed-batch reactors. Biotechnol. Bioeng. 2009;104(1):50–67. doi: 10.1002/bit.22380. [DOI] [PubMed] [Google Scholar]
- 21.Taffs R.E., Chumakov K.M., Rezapkin G.V., Lu Z., Douthitt M., Dragunsky E.M., Levenbook I.S. Genetic stability and mutant selection in Sabin 2 strain of oral poliovirus vaccine grown under different cell culture conditions. Virology. 1995;209(2):366–373. doi: 10.1006/viro.1995.1268. [DOI] [PubMed] [Google Scholar]
- 22.Mendonça R.Z., Arrózio S.J., Antoniazzi M.M., Ferreira J.M.C., Pereira C.A. Metabolic active-high density VERO cell cultures on microcarriers following apoptosis prevention by galactose/glutamine feeding. J. Biotechnol. 2002;97(1):13–22. doi: 10.1016/s0168-1656(02)00048-2. [DOI] [PubMed] [Google Scholar]
- 23.Oller A.R., Buser C.W., Tyo M.A., Thilly W.G. Growth of mammalian cells at high oxygen concentrations. J. Cell Sci. 1989;94(Pt 1):43–49. doi: 10.1242/jcs.94.1.43. [DOI] [PubMed] [Google Scholar]
- 24.Zeiser A., Bédard C., Voyer R., Jardin B., Tom R., Kamen A.A. On-line monitoring of the progress of infection in Sf-9 insect cell cultures using relative permittivity measurements. Biotechnol. Bioeng. 1999;63:122–126. doi: 10.1002/(sici)1097-0290(19990405)63:1<122::aid-bit13>3.0.co;2-i. [DOI] [PubMed] [Google Scholar]
- 25.Petiot E., Ansorge S., Rosa-Calatrava M., Kamen A.A. Critical phases of viral production processes monitored by capacitance. J. Biotechnol. 2017;242:19–29. doi: 10.1016/j.jbiotec.2016.11.010. [DOI] [PubMed] [Google Scholar]
- 26.Petiot E., El-Wajgali A., Esteban G., Gény C., Pinton H., Marc A. Real-time monitoring of adherent Vero cell density and apoptosis in bioreactor processes. Cytotechnology. 2012;64:429–441. doi: 10.1007/s10616-011-9421-2. [DOI] [PMC free article] [PubMed] [Google Scholar]
- 27.Kamen A.A., Bédard C., Tom R., Perret S., Jardin B. On-line monitoring of respiration in recombinant-baculovirus infected and uninfected insect cell bioreactor cultures. Biotechnol. Bioeng. 1996;50:36–48. doi: 10.1002/(SICI)1097-0290(19960405)50:1<36::AID-BIT5>3.0.CO;2-2. [DOI] [PubMed] [Google Scholar]
- 28.Eyer K., Heinzle E. On-line estimation of viable cells in a hybridoma culture at various DO levels using ATP balancing and redox potential measurement. Biotechnol. Bioeng. 1996;49:277–283. doi: 10.1002/(SICI)1097-0290(19960205)49:3<277::AID-BIT5>3.0.CO;2-H. [DOI] [PubMed] [Google Scholar]
Associated Data
This section collects any data citations, data availability statements, or supplementary materials included in this article.