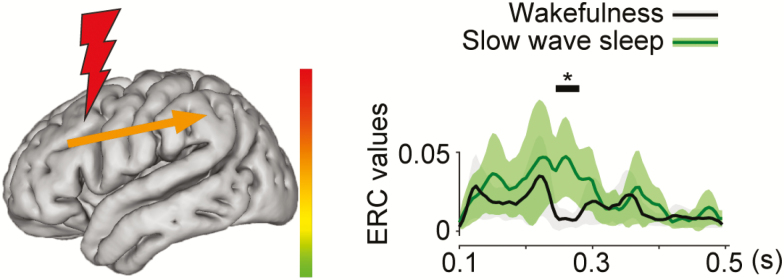
Figure 3.
Schematic illustrates a category of neural propagation, induced by SPES (frontal or parietal stimulation), that was significantly different between sleep stages. Stimulation sites are shown by a red lightning bolt. Right graphs depict the time course in unit of seconds after stimulation (x-axis) of ERC values (y-axis) of each specific propagation within or between regions. Each waveform is shown by mean ± 1.96*S.E.M. Black bar with an asterisk above the waveforms shows the period that showed significant difference by permutation test using cluster-level statistics. The average magnitude of significant differences (min = −0.246, max = 0.085), during the time interval marked with black line and asterisk, is shown by the color and thickness (same thickness for the positive and negative changes) of the arrow in the left figure. Note that herein we found that sleep stage changed ERC values in frontal to parietal propagation after frontal stimulation (N = 82) and that it significantly occurred between wakefulness and slow-wave sleep.

