

SUMMARY
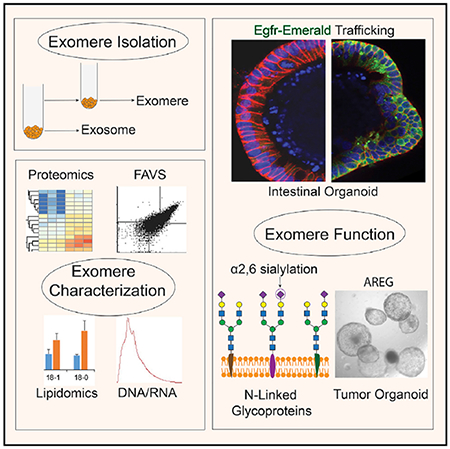
Exomeres are a recently discovered type of extracellular nanoparticle with no known biological function. Herein, we describe a simple ultracentrifugation-based method for separation of exomeres from exosomes. Exomeres are enriched in Argonaute 1–3 and amyloid precursor protein. We identify distinct functions of exomeres mediated by two of their cargo, the β-galactoside α2,6-sialyltransferase 1 (ST6Gal-I) that α2,6- sialylates N-glycans, and the EGFR ligand, amphiregulin (AREG). Functional ST6Gal-I in exomeres can be transferred to cells, resulting in hypersialylation of recipient cell-surface proteins including β1-integrin. AREG-containing exomeres elicit prolonged EGFR and downstream signaling in recipient cells, modulate EGFR trafficking in normal intestinal organoids, and dramatically enhance the growth of colonic tumor organoids. This study provides a simplified method of exomere isolation and demonstrates that exomeres contain and can transfer functional cargo. These findings underscore the heterogeneity of nanoparticles and should accelerate advances in determining the composition and biological functions of exomeres.
Graphical Abstract
In Brief
Exomeres are nanoparticles recently identified by asymmetric flow field-flow fractionation. Zhang et al. develop a simplified method for exomere isolation and confirm that exomeres have unique protein and lipid profiles. They show that two exomere cargos, ST6Gal-I and AREG, are biologically active in recipient cells.
INTRODUCTION
There has been an ever-increasing appreciation for the heterogeneous nature of secreted nanoparticles (Kowal et al., 2016; Zhang et al., 2018a). A type of small (<50 nm), non-membranous nanoparticle, termed exomere, was recently identified by asymmetric flow field-flow fractionation (AF4). Exomeres are highly enriched in metabolic enzymes and signature proteins involved in glycolysis and mTORC1 signaling (Zhang et al., 2018a). In addition to proteins, nucleic acids and lipids are also selectively secreted in exomeres.
Progress in the field of extracellular vesicles (EVs) has been hampered by the lack of simple methods to separate the various secreted vesicles from non-vesicular components. AF4 represents a step forward by fractionating such components based on their size and hydrodynamic properties; however, the technique relies on specialized equipment that is not widely available (Willms et al., 2018). Here, we have developed a simple but high-yield method of separating exomeres from exosomes. The molecular composition of distinct nanoparticles we isolated by sequential high-speed ultracentrifugation is nearly identical to that recently published for exomeres isolated by AF4 (Zhang et al., 2018a).
Moreover, we provide evidence that exomeres are functional, containing both β-galactoside α2,6-sialyltransferase 1 (ST6Gal-I), which adds α2-6 sialic acid to N-glycosylated proteins, and the epidermal growth factor receptor (EGFR) ligand, amphiregulin (AREG). ST6Gal-I in exomeres is transferred to recipient cells and sialylates cell-surface proteins including β1-integrin. This is significant given the pro-neoplastic activities demonstrated for ST6Gal-I and the role of integrins in regulating metastasis (Dall’Olio and Chiricolo, 2001; Hoshino et al., 2015; Hsieh et al., 2017; Lise et al., 2000; Lu and Gu, 2015; Recchi et al., 1998; Schultz et al., 2012, 2016). We demonstrate that AREG-containing exomeres and exosomes have potent signaling and growth-promoting activities that are distinct from mature soluble AREG.
RESULTS
Biophysical Properties of Secreted Small EVs and Distinct Nanoparticles
The initial identification of exomeres relied on AF4, a methodology that requires extensive optimization and is not widely available (Willms et al., 2018). We sought to devise a simpler method to isolate exomeres. We reasoned that these nanoparticles might not completely co-sediment with the contents of a 120,000 × g pellet that is often the final step in the isolation of exosomes. Based on this reasoning, we modified our previously published exosome isolation procedure, as depicted in Figure 1A (Higginbotham et al., 2016). Conditioned media from a human colorectal cancer (CRC) cell line (DiFi), a glioblastoma cell line (Gli36 and a clone stably overexpressing mutant EGFRvlll), and a canine kidney cell line (MDCK) were depleted for larger vesicles and then subjected to a 4-h high-speed ultracentrifugation, leading to an “exosomal” pellet. The supernatant then underwent an additional high-speed ultracentrifugation for 16 h, resulting in a second pellet. Given the recognition that the initial 4-h pellet is a complex mixture of small EVs (Kowal et al., 2016), we will refer to this pellet as small EVs (sEVs).
Figure 1. Biophysical Properties of Secreted sEVs and DNPs.
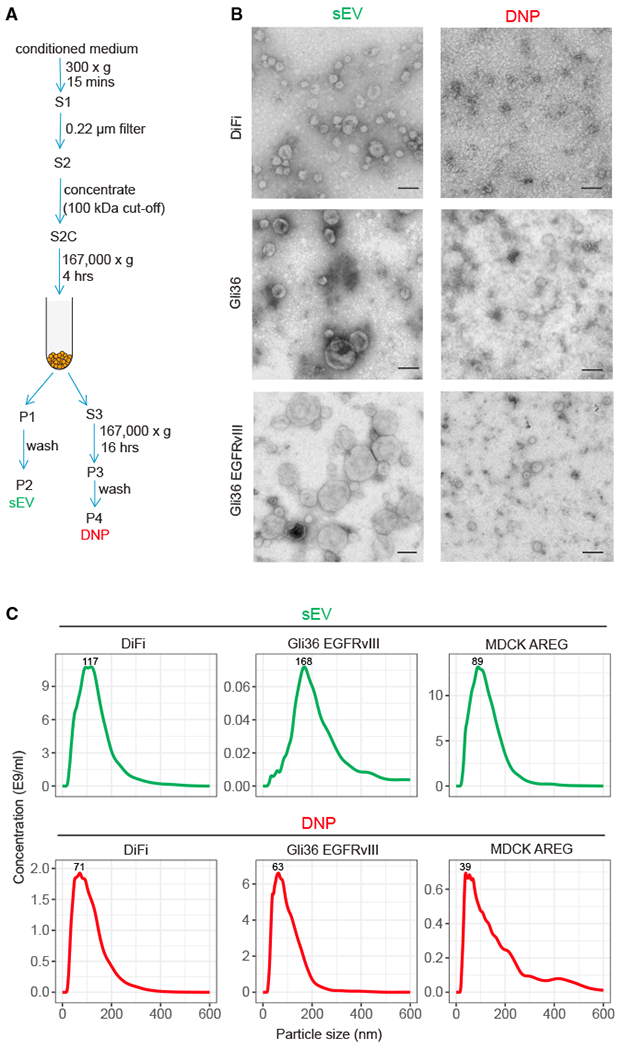
(A) Schema for isolation of small extracellular vesicles (sEVs) and distinct nanoparticles (DNPs) using differential ultracentrifugation. S, supernatant; P, pellet.
(B) Negative stain transmission electron microscopy (TEM) imaging of DNPs and sEVs. Representative images are shown. Scale bars: 100 nm.
(C) Size distribution profiles of DNPs and sEVs by nanoparticle tracking analysis (NTA).
See also Figures S1 and S2.
To compare these two pellets, transmission electron microscopy (TEM) was used to examine their structural features. As expected, sEVs exhibited a cup-shaped morphology typical of exosomes with a size range of 50–150 nm (Figures 1B and S1). In contrast, the second pellet contained distinct nanoparticles (DNPs) smaller than 50 nm with a dot-shaped morphology. By nanoparticle tracking analysis (NTA), DNPs contained nanoparticles ranging in size from 39 to 71 nm, whereas sEVs contained vesicles ranging in size from 94 to 173 nm (Figures 1C and S2). Concentrations of sEV and DNPs also varied based on cell of origin. Lower concentrations of nanoparticles were present in DNPs than sEVs from DiFi cells and MDCK cells stably overexpressing AREG (MDCK AREG) (Figures 1C and S2). However, glioblastoma cells (Gli36 and Gli36 EGFRvlll) secrete higher levels of DNPs than sEVs (Figures 1C and S2). A cell line-dependent difference in nanoparticle secretion is similar to what has been previously reported (Tkach et al., 2018; Zaborowski et al., 2015). Thus, sEVs exhibit the biophysical properties of exosomes and DNPs resemble what has been described for exomeres (Zhang et al., 2018a).
DNPs Display Proteomic Profiles Distinct from sEVs
To further characterize these two populations, we performed proteomics of DiFi cell-derived DNPs and sEVs using liquid chromatography-coupled tandem mass spectrometry (LC-MS/MS). A Venn diagram analysis of the identified proteins revealed 1,741 proteins were detected in both DNPs and sEVs, while 322 proteins were solely present in sEVs and 40 proteins were solely present in DNPs (Figure 2A; Tables S1 and S2). Next, we determined the differential expression between proteins in DNPs and sEVs. Proteins with a fold-change of more than 2 and a false discovery rate (FDR) of <0.05 were considered to be significantly differentially expressed. Principal-component analysis (PCA) of the results from three biological replicates showed clear separation of DNPs and sEVs (Figure 2B), suggesting they represent distinct populations.
Figure 2. Proteomic Profiling of sEVs and DNPs.
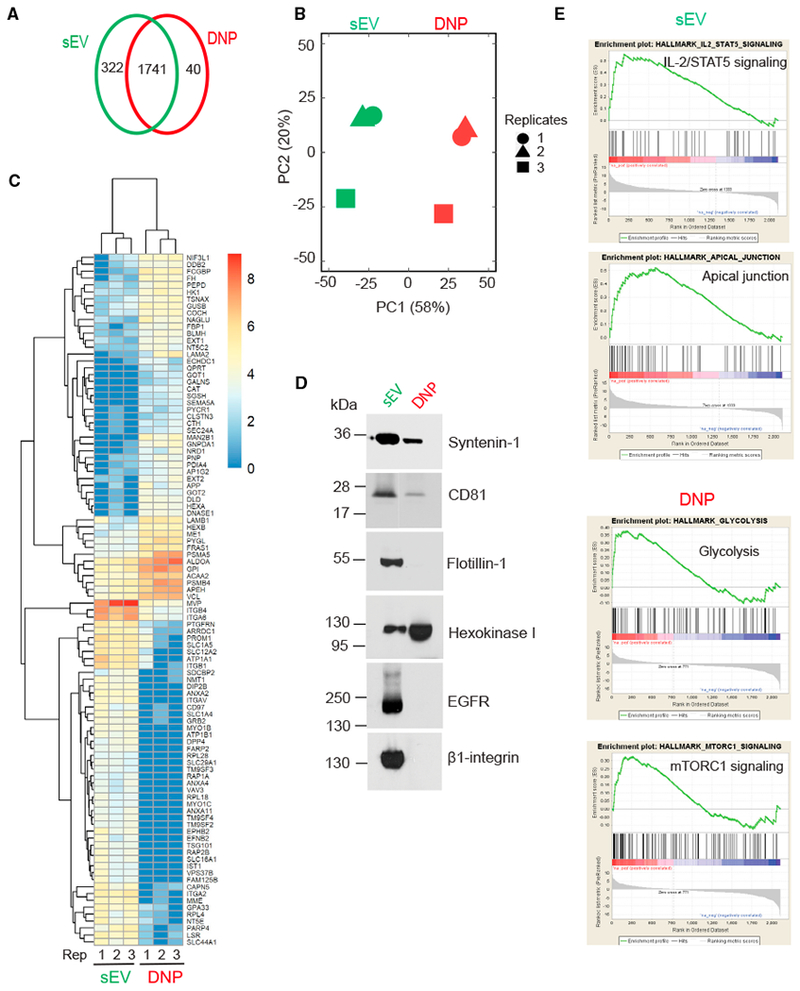
(A) Venn diagram of unique and common proteins identified in DNPs and sEVs isolated from DiFi cell conditioned medium. Data represent three independent biological replicates. Equal amounts of protein in sEVs and DNPs were used for the analysis.
(B) Principal-component analysis (PCA) of normalized proteins.
(C) Heatmap of top 100 proteins differentially expressed by sEVs and DNPs.
(D) Immunoblot of representative proteins identified in DNPs and sEVs with the indicated antibodies. Equal amounts of protein were loaded.
(E) Representative GSEA analyses showing signaling pathways in sEVs and DNPs.
The 100 most differentially expressed proteins between the two populations were used to generate a heatmap (Figure 2C; Tables S1 and S2). DNPs were significantly enriched in proteins involved in metabolism (e.g., hexokinase 1 [HK1], glucose 6-phosphate isomerase [GPI], aldolase A [ALDOA], glutamic-oxaloacetic trans-aminase 1 [GOT1], GOT2,fumate hydrotase [FH]), suggesting that these nanoparticles are equipped to possibly modulate the metabolic state of recipient cells (Zhang et al., 2018b). Also enriched in DNPs were proteins involved in glycan processing (e. g., hexoaminidase A [HEXA], HEXB, glycogen phosphorylase L [PYGL], glucuronidase beta [GUSB], fructose-bisphosphatase 1 [FBP1], galactosamine-6-sulfatase [GALNS]), raising the possibility that exomeres may post-translationally modify proteins in recipient cells.
Overall, the proteomic profiles of DNPs resembled what Lyden and co-workers have reported to be in exomeres (Zhang et al., 2018a). Of interest, the DNPs we isolated had a dramatic enrichment of amyloid precursor protein (APP) and components involved in its processing (β-site APP-cleaving enzyme [BACE1]) and trafficking (calsyntenin family members [CLSTN1,2, and 3]); in addition, amyloid beta precursor-like protein 2 (APLP2) was one of the 40 proteins found only in DNPs (Figure 2A; Table S2). sEVs contained classic exosomal components, including CD81, syntenin-1, TSG101, and ALIX, as well as proteins commonly identified in proteomic profiling of exosomes, including integrins (ITGB1, ITGB4, ITGA6), annexins (ANXA2, ANXA4), and EGFR. Proteins common to both fractions included the adaptor-related protein complex 1 (AP1, AP2, and AP3), coatomer protein complex subunits G1 and 2, a number of Rab GTPases (including Rab5, 7, 8, 25, and 35), and vacuolar protein-associated proteins linked to the retromer complex (VPS 26, 29, and 35), suggesting utilization of a common machinery in the biogenesis and trafficking of both types of nanoparticles. Select proteins were validated by immunoblotting; Flotillin-1, EGFR, and β1-integrin were detected only in sEVs, CD81 and syntenin-1 were enriched in sEVs, and HK1 was enriched in DNPs (Figure 2D).
We next examined the 50 most abundant proteins in DNPs and sEVs (Table S3). There was a large degree of overlap with 23 proteins appearing in both populations. This was not surprising in light of recent work by our group (Jeppesen et al., 2019) in which sEV pellets were fractionated into a light fraction (bona fide sEVs) and a heavy fraction that contained many of the proteins found on this list. It is likely that the heavy fraction is largely made up of exomeres, although this remains to be formally proven.
We also performed gene set enrichment analysis (GSEA) in the two populations, using three collections of gene sets in the Molecular Signatures Database (MSigDB): Hallmark, Kyoto Encyclopedia of Genes and Genomes (KEGG), and Gene Ontology (GO). A full list of overrepresented functions in DNPs or sEVs is found in Figure 2E and Table S4. Samples of sEVs contained proteins enriched in IL2-STAT5 signaling and apical junction, whereas DNP samples contained proteins enriched in glycolysis and mTORC1 signaling. These same pathways have previously been reported to be enriched in exosomes and exomeres, respectively (Zhang et al., 2018a).
Distinct Nucleic Acid and Lipid Composition of sEVs and DNPs
To further characterize these two populations, we examined their nucleic acid composition. RNA was detected in both DNPs and sEVs derived from DiFi, a second CRC cell line (DKO-1) and parental MDCK cells; small RNAs were the dominant species (Figures 3A, 3B, S3A, and S3B). Although levels of total RNA in DNPs were significantly lower than in sEVs (Figures 3A and S3A), DNPs contained more small RNAs than the sEVs (Figures 3B and S3B). By proteomic analysis, Argonaute proteins (Ago1, Ago2, and Ago3) were enriched in DNPs (Table S1); the presence of Ago1 and Ago2 was confirmed by immunoblotting (Figure 3C). This was not surprising in that Agos 1–4 were highly enriched in the heavy fraction reported by Jeppesen et al. (2019). Co-enrichment of small RNAs and Argonaute proteins in DNPs suggests that microRNAs (miRNAs) may be enriched in this population. DNA was detected in both sEVs and DNPs from these cell lines (Figure 3D), consistent with previous findings for exosomes and exomeres (Zhang et al., 2018a).
Figure 3. Distinct Nucleic Acid and Lipid Composition of sEVs and DNPs.
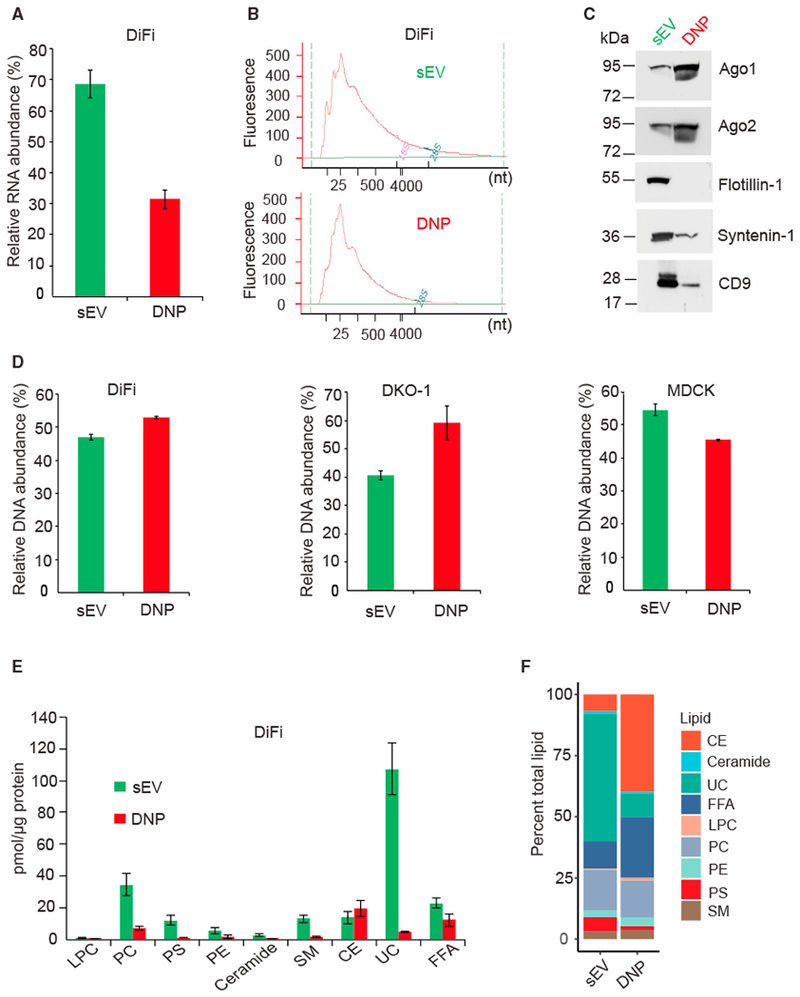
(A) Relative abundance of RNA isolated from DNPs and sEVs derived from DiFi cells. One biological experiment was performed in triplicate. Data are presented as mean ± SEM. RNA was isolated from equal amounts of total protein in sEVs and DNPs.
(B) Size distribution of RNA isolated as shown in (A).
(C) Immunoblot for Argonaute proteins and exosomal markers in DNPs and sEVs derived from DiFi cells. Equal amounts of proteins were loaded.
(D) Relative abundance of DNA isolated from DNPs and sEVs derived from cell lines indicated. Three independent biological experiments were performed for DKO-1 cells. For DiFi and MDCK parental cells, one biological experiment with three technical replicates was performed. Data are presented as mean ± SEM. DNA was isolated from equal amounts of total protein in sEVs and DNPs.
(E) Amount of each lipid class detected in DiFi cell-derived DNPs and sEVs. Lipidomic analysis was performed by ESI-MS. Two biological experiments were performed. Data are presented as mean ± SEM. Equal amounts of total protein in sEVs and DNPs were used for the analysis.
(F) Individual lipid molecular species were quantified by comparisons to the internal standards (see STAR Methods).LPC, lysophosphatidylcholine; PC, choline glycerophospholipid; PE, ethanolamine glycerophospholipid; PS, serine glycerophospholipid; CE, cholesteryl ester; SM, sphingomyelin; Cer, ceramide; UC, unesterified cholesterol; FFA, free fatty acid.
See also Figures S3 and S4.
Next, we examined the lipid profile of DNPs and sEVs derived from DiFi cells. Electrospray ionization-mass spectrometry (ESI-MS) was employed to quantify the lipid profiles of these fractionated nanoparticles relative to internal standards. We observed a 4-fold reduction in total lipid content in DNPs relative to sEVs (Figure 3E). All major classes of lipids associated with EVs, including phospholipids, sterols, sphingolipids, and non-esterified fatty acids (NEFAs), were detected in both populations, although ceramide and lysophosphatidylcholine represented less than 2% of the total lipid mass. Sterols were the predominant lipid species in both populations, accounting for nearly 50% and 60% of the total lipid mass, respectively (Figure 3F). However, DNPs were enriched with esterified cholesterol (4:1 esterified/unesterified), whereas sEVs contained predominantly unesterified cholesterol (10:1 unesterified/esterified). Sphingomyelin levels were similar between DNPs and sEVs (~3.5%). Percent phospholipid content was also comparable between DNPs and sEVs (21.3% and 25.7%, respectively). Phosphatidylcholine was the dominant phospholipid of both particle populations, accounting for ~15% of the total lipid mass. Phosphatidyl-serine was relatively enriched in sEVs (5.8%) compared to DNPs (1.5%). Phosphatidylethanolamine contributed more to DNPs (3.6%) than to sEVs (2.7%). NEFA contributed a substantial mass to sEVs (11%) and were the second most abundant lipid in DNPs (~25%). Overall, individual lipid species profiles were consistent between subpopulations within lipid classes (Figure S4). Thus, DNPs and sEVs exhibit distinct nucleic acid and lipid profiles, as previously reported (Zhang et al., 2018a).
In summary, based on biophysical properties, lipid, protein, and nucleic acid content, DNPs largely resemble exomeres. Hereafter, DNPs and sEVs will be referred to as exomeres and exosomes, respectively.
Detection of ST6Gal-I in Exomeres and in a Subset of Exosomes
Exomeres are enriched in N-glycosylated proteins including α2,6-sialylated glycoproteins (Zhang et al., 2018a); however, whether ST6Gal-I, the enzyme catalyzing the α2,6-sialylation of N-glycoproteins, is present in exomeres or exosomes is unknown. We now show that both membrane-bound and soluble forms of ST6Gal-I are present in DiFi cell-derived exomeres and exosomes (Figure 4A; Table S1). Also present is BACE1, the enzyme that cleaves ST6Gal-I, yielding a soluble protein (Kitazume et al., 2005). As noted above, BACE1 is greatly enriched in exomeres, which likely explains the higher levels of the cleaved, soluble form of ST6Gal-I in these nanoparticles (Figure 4A). α2,6-Sialylated N-glycans are one of the most prevalent glycan modifications found in cancer cells, and ST6Gal-I is itself upregulated in a wide range of cancers, including CRC (Dall’Olio and Chiricolo, 2001; Lu and Gu, 2015; Schultz et al., 2012). Consistent with this literature, in Figure S5, we show upregulation of ST6Gal-I in a duodenal tumor harvested from a Lrig1-null mouse (Powell et al., 2012; Wang et al., 2015).
Figure 4. ST6Gal-I Is Present in Exomeres and in a Subset of Exosomes.
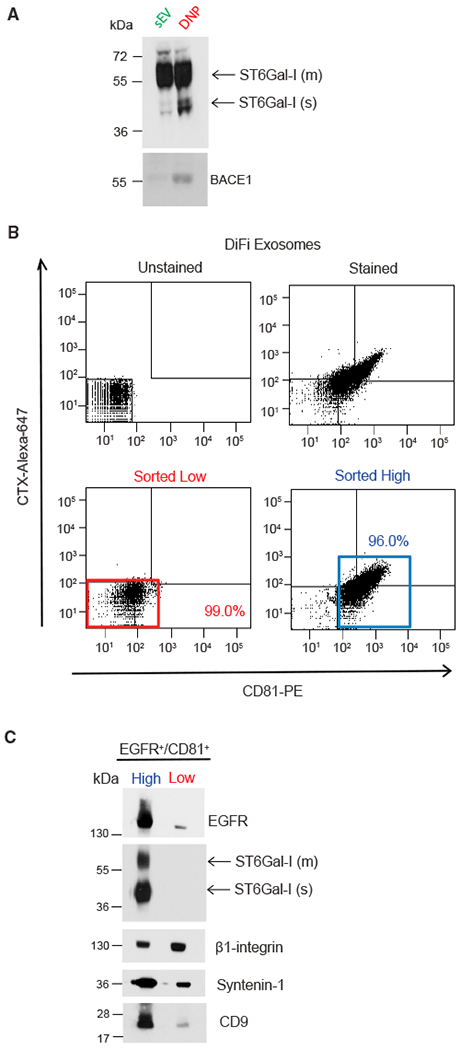
(A) Immunoblot of ST6Gal-I and BACE1 in exosomes and exomeres with the indicated antibodies. Equal amounts of proteins from exosomes and exomeres were loaded. m, membrane; s, soluble.
(B) FAVS analysis of exosomes derived from DiFi cells. Dot plot of baseline fluorescent intensities from FAVS analysis of exosomes. No stain (upper left). Total fluorescent intensities from FAVS analysis of exosomes stained with a phycoerythrin-labeled CD81 antibody (x axis) and an Alexa 647-labeled EGFR antibody (cetuximab [CTX]) (y axis) (upper right). Percentages of gated populations from 10,000 total events are shown. Post-sort analysis of double-stained low-intensity (red box, lower left) and high-intensity (blue box, lower right) events.
(C) Immunoblot of flow-sorted exosomes. The same number of sorted vesicles were lysed, separated on a SDS/PAGE gel, and immunoblotted with the indicated antibodies. m, membrane; s, soluble.
See also Figure S5.
We have previously developed a flow-cytometric method, fluorescence-activated vesicle sorting (FAVS) (Higginbotham et al., 2016), to subset individual exosomes based on cell-surface EGFR and the tetraspanins CD81, CD9, and CD63. We considered that ST6Gal-1 might vary in its distribution among different populations of exosomes. To that end, we performed FAVS on the 4-h exosomal pellet using fluorescently labeled antibodies to EGFR and CD81. Double-stained populations were analyzed and sorted into EGFR/CD81 high and low subpopulations (Figure 4B). By immunoblot validation, both EGFR and CD9 were enriched in the EGFR/CD81 high population (Figure 4C). Both membrane and soluble forms of ST6Gal-I were detected only in the EGFR/CD81 high population, suggesting ST6Gal-I is present in a subpopulation of exosomes. In marked contrast, equivalent levels of β1-integrin, a recognized constituent of exosomes, were detected in both high and low populations, suggesting that β1-integrin may be a more ubiquitous exosomal marker (Figure 4C). These results support the notion that there are heterogeneous and distinct classes of exosomes and underscore the utility of FAVS for analyzing and sorting distinct vesicle populations.
ST6Gal-I in Exomeres and Exosomes Is Functional in Recipient Cells
To determine whether ST6Gal-I in exomeres and exosomes is functional in recipient cells, we first tested the intrinsic sialyl-transferase activity of ST6Gal-I-containing nanoparticles isolated from DiFi cell conditioned medium (Figure 5A). Exomeres and exosomes were incubated with CMP-sialic acid and a sialic acid acceptor substrate, and sialylation was measured using a spectrophotometric enzyme assay. Both exomeres and exosomes exhibited substantial sialyltransferase activity, although the activity was greater in exomeres. To examine whether functional ST6Gal-I can be delivered to recipient cells, SW948 and SW48 cells were selected as recipients since they have non-detectable levels of ST6Gal-I (Figure 5B). DiFi cell-derived ST6Gal-I-positive exomeres and exosomes were added to these cells for 3 or 24 h. Both membrane and soluble forms of ST6Gal-1 were detected in both SW48 and SW948 cells at 3 h, and levels were markedly diminished at 24 h (Figure 5C). By qRT-PCR, we excluded that addition of these nanoparticles induced mRNA expression of endogenous ST6Gal-I in SW948 cells (Figure S6). Thus, the increased levels of ST6Gal-I protein in recipient cells were exclusively from direct nanoparticle delivery. These results clearly demonstrate that functional ST6Gal-I in exomeres and exosomes can be delivered to recipient cells.
Figure 5. ST6Gal-I in Exomeres and Exosomes Is Functional in Recipient Cells.
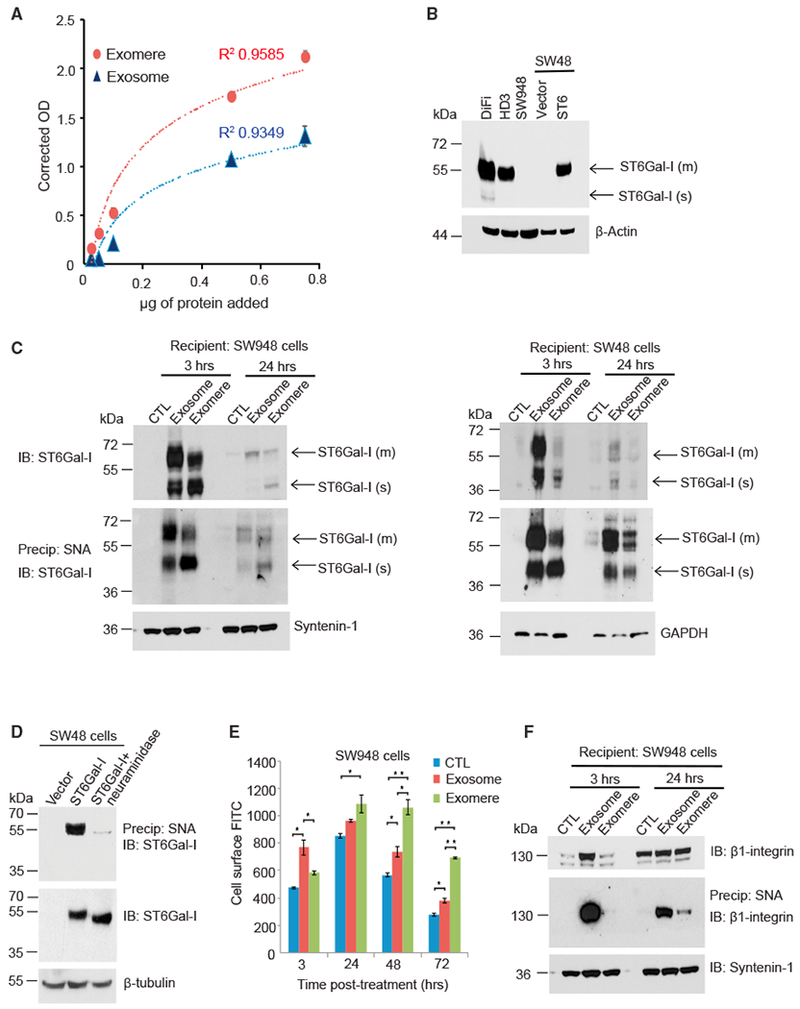
(A) Exosomes and exomeres contain sialyltransferase activity. Varying amounts of DiFi cell-derived exosomes or exomeres were added to a sialyltransferase activity kit (R&D Systems), which measures the transfer of sialic acid from CMP-sialic acid to an acceptor substrate. Three independent biological experiments were performed, and data are presented as mean ± SEM.
(B) Immunoblot analysis of ST6Gal-I levels in colon cancer cell lines. SW48 cells were stably transduced with control vector or with ST6Gal-I expression construct lentiviral particles. m, membrane; s, soluble.
(C) ST6Gal-I in exomeres and exosomes is delivered to recipient cells. Exosomes and exomeres derived from DiFi cells were applied to SW948 and SW48 cells and cells were harvested at different time points. Lysates were either directly used for immunoblotting to detect ST6Gal-I (top), or incubated with agarose-conjugated Sambucus nigra agglutinin (SNA) lectin (bottom). α2,6-Sialylated proteins were precipitated and immunoblotted for ST6Gal-I. Both membrane and cleaved soluble forms of ST6Gal-I were transferred to SW948 and SW48 cells, as denoted by arrows. m, membrane; s, soluble.
(D) SNA recognizes α2,6-sialylated ST6Gal-I. To verify that SNA pull-down experiments precipitated the sialylated ST6Gal-I form, pull-downs were conducted with parental SW48 cells that lack endogenous ST6Gal-I or SW48 cells stably expressing ST6Gal-I. Pull-downs were also conducted with neuraminidase-treated lysates from ST6Gal-I-overexpressing SW48 cells. The SNA pull-downs, as well as whole-cell lysates, were immunoblotted for ST6Gal-I.
(E) ST6Gal-I in exosomesand exomeres is functional in recipient cells. SW948 cells were treated with exosomesor exomeres isolated from DiFi cells or untreated control. At different time points, cells were stained with FITC-SNA and then assessed for total cell-surface levels of α2,6-sialylation by flow cytometry. Data are presented as mean ± SEM; n = 3; *p < 0.05, **p < 0.01.
(F) SW948 cells were treated with either exosomes or exomeres. Lysates were incubated with agarose-conjugated SNA lectin. α2,6-Sialylated proteins were precipitated and blotted for β1-integrin.
See also Figure S6.
Furthermore, both forms of transferred ST6Gal-I were auto-sialylated as demonstrated by pull-down experiments using Sambucus nigra agglutinin (SNA) (Figure 5C), a lectin that specifically recognizes α2,6-linked sialic acid. ST6Gal-I is known to be α2,6-sialylated in vivo (Miyagi and Tsuiki, 1982). SNA was able to precipitate ST6Gal-I from SW48 cells stably overexpressing ST6Gal-1 but not from parental SW48 cells. We confirmed that the recognition by SNA is dependent on the α2,6-sialic acid modification as pretreatment of whole-cell lysates with neuraminidase prevented a successful pull-down of ST6Gal-1 by SNA (Figure 5D). Immunoblots of whole-cell lysates used for the SNA pull-downs show that neuraminidase treatment did not affect the abundance of ST6Gal-I, but it did reduce the size of ST6Gal-I, consistent with loss of sialic acid.
To determine whether transferred ST6Gal-I is functional in recipient cells, we used fluorescein isothiocyanate (FITC)-labeled SNA and flow cytometry to examine cell-surface α2,6- sialylation in SW948 cells treated with ST6Gal-I-bearing exomeres and exosomes. Compared to control, cells incubated with either exomeres or exosomes had higher amounts of cell-surface α2,6-linked sialic acid (Figure 5E). At 48- and 72-h exposure, cells treated with exomeres had significantly higher levels of α2,6-linked sialic acid on their cell surface than cells treated with exosomes, a finding consistent with the greater sialyltransferase activity detected in exomeres compared to exosomes (Figure 5A).
To confirm that nanoparticle-containing ST6Gal-I can actively sialylate specific targets on recipient cells, we examined the sialylation status of β1-integrin, a well-established ST6Gal-I substrate (Seales et al., 2005), in ST6Gal-I non-expressing SW948 cells. β1-integrin is non-detectable in DiFi exomeres (Figure 2D) so these nanoparticles will deliver only ST6Gal-I, whereas exosomes will deliver both ST6Gal-I and sialylated β1-integrin. Equal amounts of exomeres and exosomes were added to SW948 cells, and the sialylation status of β1-integrin was monitored at 3 and 24 h (Figure 5F). At 3 h following exosome treatment, a substantial amount of α2,6-sialylated β1-integrin was found in SW948 cells, suggesting that direct transfer of α2,6-sialylated β1-integrin had occurred. These data are consistent with SNA staining experiments (Figure 5E), which showed significantly higher surface α2,6-sialylation at 3 h after exosome treatment compared to control. Levels of α2,6-sialylated β1-integrin in exosome-treated cells decreased from 3 to 24 h, likely reflecting degradation of the transferred integrin. In contrast to exosome treatment, no detectable α2,6-sialylated β1-integrin was present in cells treated for 3 h with exomeres. However, at 24 h following exomere treatment, β1-integrin had clearly acquired α2,6-sialylation, indicating that exomere-derived ST6Gal-I actively sialylated endogenous β1-integrin in SW948 cells. Taken together, these results demonstrate that both exomeres and exosomes contain functional ST6Gal-I that can sialylate targets in recipient cells and exosomes can transfer sialylated proteins to recipient cells.
AREG-Containing Exomeres and Exosomes Are Potent Inducers of EGFR Activation and Downstream Signaling
To identify additional functional cargo in exomeres, we chose the EGFR ligand AREG for further analysis since we had previously detected AREG in exosomes (Higginbotham et al., 2011). AREG is produced as a type I transmembrane protein that is delivered to the basolateral surface of polarized epithelial cells whereupon it undergoes ectodomain cleavage by ADAM17 to release mature soluble AREG (Brown et al., 1998; Gephart et al., 2011). Recombinant AREG (rAREG) is mature soluble AREG; hereafter, the two terms are used interchangeably. We previously demonstrated a mode of EGFR ligand signaling through exosomal AREG composed of the proform of AREG with its transmembrane domain and cytoplasmic tail (Higginbotham et al., 2011). To examine whether exomeres also contain AREG and whether AREG in exomeres can function in recipient cells, we isolated exomeres and exosomes from parental and AREG-overexpressing MDCK cells (Higginbotham et al., 2011). All of the different isoforms of AREG were detected in both exomeres and exosomes in AREG-overexpressing MDCK cells, although exomeres contained lower levels of AREG than exosomes when equal amounts of total protein were analyzed by AREG immunoblotting (Figure 6A).
Figure 6. AREG-Containing Exomeres and Exosomes Activate EGFR and Increase Downstream Signaling.
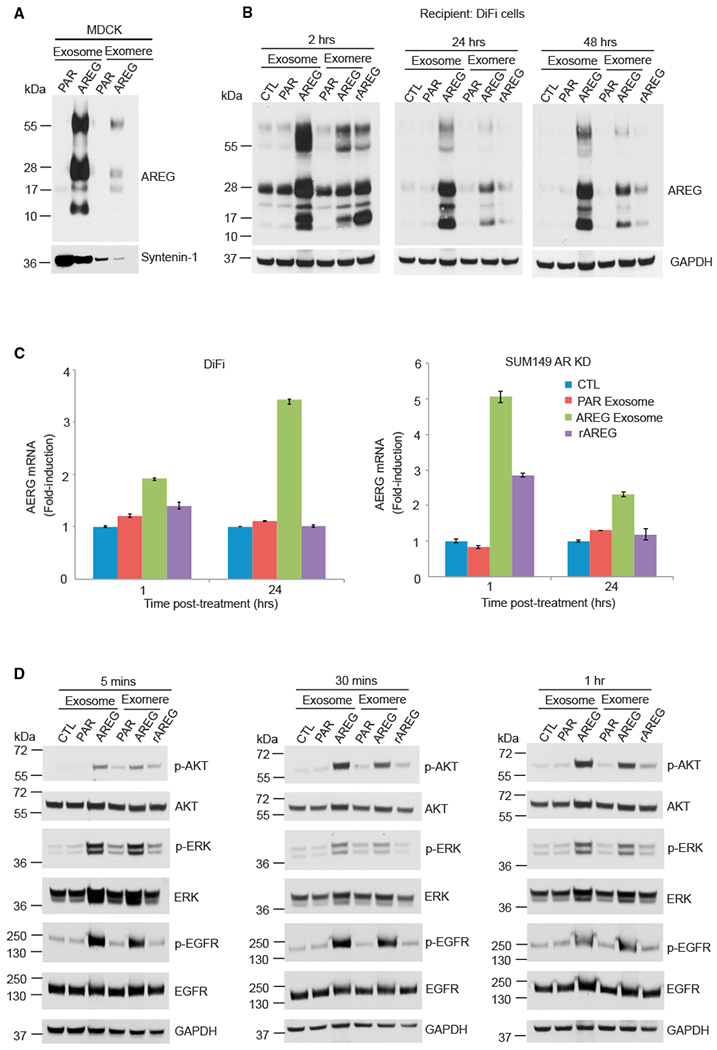
(A) Immunoblot analysis of AREG levels in exosomes and exomeres isolated from MDCK cells expressing either empty vector or human AREG. Equal amounts of protein were loaded in each lane. Syntenin-1 was used as an exosomal marker. PAR exosome, exosomes derived from parental (PAR) MDCK cells; rAREG, recombinant human AREG.
(B) Immunoblot analysis of AREG levels in DiFi cells treated once with 20 μg/mL exosomes or exomeres (equivalent to 10 pg/mL rAREG), 100 ng/mL rAREG, or untreated control, and harvested at the times indicated. Equal amounts of protein were loaded in each lane.
(C) Analysis of AREG mRNA expression by qRT-PCR in DiFi cells and Sum149 AREG knockdown cells treated for 1 and 24 h with the treatments indicated. Data are presented as mean ± SEM. Actin was used as an internal control.
(D) Immunoblot for total and phosphorylated (p) EGFR (tyrosine 1068), AKT, and ERK in DiFi cells treated as shown in (B). The same amount of protein was loaded in each lane.
See also Figure S7.
To determine whether AREG in exomeres and exosomes can be transferred to recipient cells, we treated DiFi cells with MDCK cell-derived parental and AREG-containing exomeres and exosomes (equivalent to 10 pg/mL rAREG as measured by ELISA) and rAREG (100 ng/mL) for different amounts of time (Figure 6B). All isoforms of AREG were easily detected in DiFi cells treated for 2 h with AREG-containing exomeres and exosomes with levels gradually decreasing at 24 and 48 h. The presence of all the AREG isoforms 2 h after addition of rAREG is most likely due to induction of endogenous AREG that is rapidly disposed of. Thus, AREG-containing exomeres and exosomes can be transferred to recipient cells, and it appears that AREG is processed differently when packaged and delivered in exomeres and exosomes compared to when it is expressed endogenously.
We next tested whether AREG promoted its own expression in recipient cells through a self-amplifying loop (Zuo et al., 2017). As expected, stimulation of DiFi cells with AREG exosomes resulted in a 2-fold increase in AREG gene expression at 1 h (Figure 6C), which continued to increase to 3.5-fold at 24 h compared to control. In contrast, exposure of DiFi cells to rAREG slightly induced AREG gene expression at 1 h, and this decreased gradually to control levels at 24 h, suggesting that AREG-containing exosomes are a more potent inducer of its own expression than mature soluble AREG. Treatment of AREG knockdown (KD) SUM-149 cells (Baillo et al., 2011) with AREG exosomes induced AREG gene expression 5-fold at 1 h and this decreased to 2-fold induction at 24 h, whereas rAREG treatment only caused a 2-fold increase at 1 h and this returned to control levels at 24 h (Figure 6C).
We next examined the signaling capabilities of AREG-containing exomeres and exosomes on recipient cells (Figure 6D). Exosomes and exomeres derived from parental (PAR) or AREG-overexpressing MDCK cells were added to serum-starved DiFi cells. Compared to their PAR counterparts, both AREG exosomes and exomeres dramatically increased phosphorylation (p) of EGFR tyrosine 1068 (p-EGFR), p-AKT and p-ERK at 5 min, and these increased levels persisted at 30 min and 1 h (Figure 6D). rAREG led to much lower levels of p-EGFR and less activation of downstream signaling, demonstrating the greater potency of AREG exomeres and exosomes compared to rAREG. Levels of p-EGFR, p-AKT, and p-ERK remained increased at 2 h but fluctuated at 24 and 48 h (Figure S7), possibly due to the phenomena of auto- and cross-induction of EGFR ligands (Barnard et al., 1994; Coffey et al., 1987), as well as turnover and recycling of EGFR.
AREG-Containing Exomeres and Exosomes Alter EGFR Trafficking and Enhance Growth of Colonic Tumor Organoids
To monitor the dynamics and trafficking of EGFR in real time, we took advantage of our recently published Egfr reporter mouse model (Yang et al., 2017). Using CRISPR/Cas9 gene editing, a bright green fluorescent tag Emerald (Em) was appended to the C terminus of the Egfr protein within the endogenous mouse locus, thus allowing direct visualization of Egfr. Intestinal organoids were generated from homozygous EgfrEm mice; in growth factor-depleted medium, EgfrEm fluorescence was barely detected in cells within the organoid (data not shown). There was no appreciable difference upon administration of exosomes isolated from parental MDCK cells (CTL) (Figures 7A, 7A′, 7B, and 7B′). However, 5 min following treatment with AREG-containing exomeres or exosomes (equivalent to 5 pg/mL rAREG as determined by ELISA), there was a marked enrichment of membranous and somewhat diffuse cytoplasmic EgfrEm fluorescence in many of the cells within the organoid (arrowhead in Figures 7C, 7C′, 7E, and 7E′). By 30 min, there was reduced membranous and cytoplasmic fluorescence and appearance of punctate cytosolic fluorescence, consistent with receptor internalization (Figures 7D, 7D′, 7F, and 7F′). In contrast, 5 min after addition of rAREG, we did not observe the membranous and diffuse cytoplasmic EgfrEm fluorescence seen with AREG-containing exomeres and exosome. Rather, there was cytosolic punctate fluorescence (Figures 7G and 7G′) and this was much reduced at 30 min (Figures 7H and 7H′), suggesting rapid internalization and degradation of the receptor; these findings are similar to what we observed in hepatocytes after systemic administration of EGF (Yang et al., 2017). Thus, distinct dynamics of Egfr trafficking are induced by AREG in the context of nanoparticles compared to mature soluble AREG.
Figure 7. AREG-Containing Exomeres and Exosomes Alter EGFR Trafficking and Enhance the Growth of Colonic Tumor Organoids.
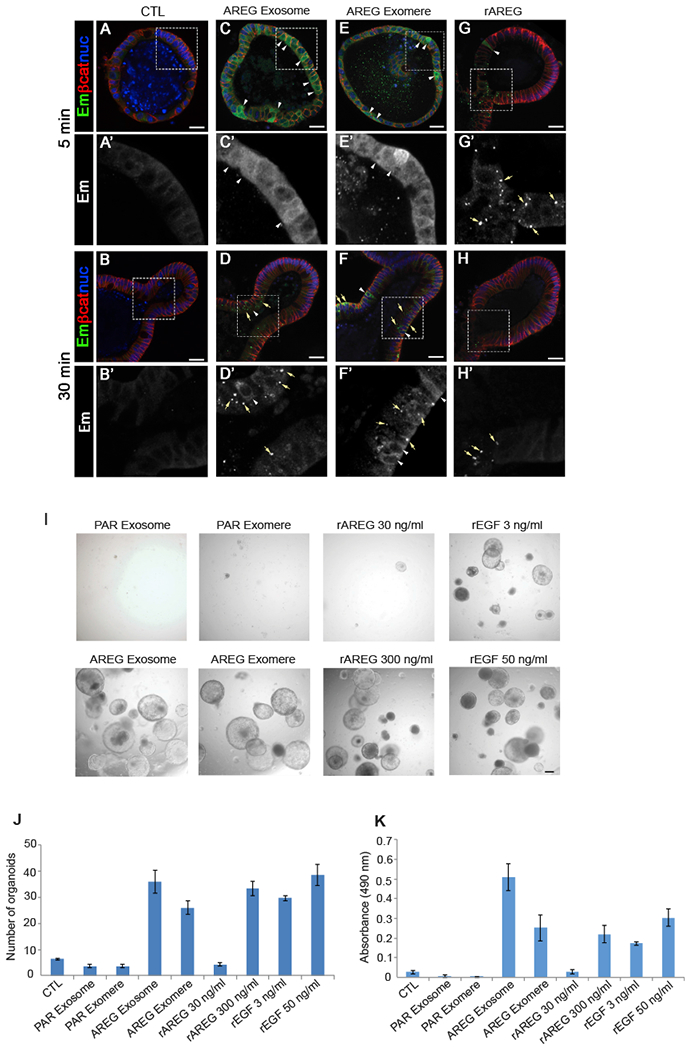
(A–H′) Immunostaining of Egfr-Emerald (Em) in EgfrEm/Em intestinal organoids 5 and 30 min after treatment with exosomes derived from parental MDCK cells (CTL) (A, A′, B, and B′), exosomes and exomeres derived from MDCK cells stably overexpressing AREG (AREG Exosome, C, C′, D, and D′, or AREG Exomere, E, E′, F, and F′, respectively), or rAREG (300 ng/mL) (G, G′, H, and H′). Exosomes and exomeres were added at a concentration of 10 μg/mL total protein. The amount of AREG in AREG exosomes and exomeres was calculated to be 1.5 pg/mL.
(A–H) Low-power images of whole organoids.
(A′–H′) High-magnification single-channel images of inserts in (A)′(H) indicated by white rectangle. Egfr-Em (green); β-catenin (red); nuclei (blue). See text for details. Scale bars: 25 μm.
(I) Equal numbers of Lrig1CreER/+;Apcflox/+ colonic tumor organoids were seeded and treated for 10 days with the conditions indicated. Representative phase-contrast bright-field images are shown; 4× magnification. Scale bars: 100 μm.
(J and K) The number (J) and viability (K) of tumor organoids were determined 10 days after exposure to the treatments indicated. Cell viability was measured using a MTS assay. Data are presented as mean ± SEM.
See also Figure S8.
Since AREG delivered by exosomes or exomeres showed a long-lasting induction of EGFR signaling in 2D cell culture and also in 3D ex vivo intestinal organoids compared to rAREG (Figures 6 and 7), we sought to further test the influence of this prolonged signaling activation on cell behavior in a tumor context. To this end, we used colonic tumor organoids generated from a stem cell-driven model of colonic neoplasia previously developed in our lab (Powell et al., 2012). Tumor organoids were treated with AREG-containing exosomes and exomeres or rAREG for 10 days, at which time their effects on growth were measured. Treatment with exosomes or exomeres isolated from parental MDCK cells had no effect on size or number of tumor organoids (Figures 7I–7K and S8). rAREG (30 ng/mL) increased the size but not number of tumor organoids. However, treatment with AREG carried in exomeres (equivalent to 1.5 pg/mL rAREG) resulted in a marked increase in size and number of tumor organoids. Similar results were obtained with AREG-containing exosomes. Thus, like the signaling results, the growth-promoting effects of AREG-containing exomeres and exosomes are far greater than mature soluble AREG.
DISCUSSION
A major challenge in the field of EVs is the heterogeneity of nanoparticles and methods to isolate and purify distinct populations (Kowal et al., 2016; van Niel et al., 2018; Willms et al., 2018). David Lyden’s group recently identified a type of nanoparticle they have termed exomeres using AF4 (Zhang et al., 2018a). A recent review that included an assessment of different methods for EV isolation noted that AF4 is difficult to use and requires substantial experimental optimization (Willms et al., 2018). In this study, we successfully separated exomeres from exosomes by using a simple, sequential ultracentrifugation method. Our characterization of these nanoparticles is consistent with the findings of Lyden and co-workers.
Similar to the findings of Zhang et al., we found that many proteins previously reported to be associated with exosomes are enriched in exomeres. For example, metabolic enzymes involved in various pathways, including glycolysis, are highly enriched in exomeres. However, we identified additional factors enriched in exomeres, including Argonaute proteins Ago1, Ago2, and Ago3. Exomeres were also enriched in proteins involved in Alzheimer’s disease; these include APP, APPL2, BACE-1 (the rate-limiting enzyme in cleavage of APP), and CLSTN1, 2, and 3, which are involved in APP trafficking. Interestingly, the sialylation of APP by ST6Gal-I is known to enhance APP cleavage and secretion, promoting extracellular accumulation of amyloid-β peptide (McFarlane et al., 1999; Nakagawa et al., 2006). There has been some debate whether APP is released in exosomes (Laulagnier et al., 2018; Lim and Lee, 2017; Miranda et al., 2018). Our results establish that both APP and its cleaving enzyme, BACE-1, are enriched in exomeres. Future studies will be needed to determine whether APP and BACE-1 carried in exomeres contribute to the pathogenesis of neurodegenerative diseases like Alzheimer’s disease and Parkinson’s disease.
Our studies also demonstrate that both membrane-anchored and cleaved, soluble forms of ST6Gal-I are present in exomeres and exosomes, and they can be transferred to recipient cells, leading to active sialylation of targets such as β1-integrin. Furthermore, exosomes directly transfer α2,6-sialylated β1-integrin. The sialylation of β1-integrin by ST6Gal-I potentiates metastatic cell behavior such as cell migration and invasion (Lin et al., 2002; Seales et al., 2005; Shaikh et al., 2008). The presence of β1-integrin in exosomes is well-documented (Clayton et al., 2004), and tumor-secreted exosomal integrins contribute to organ-specific metastasis (Hoshino et al., 2015). ST6Gal-I present in exomeres and exosomes could influence integrin-mediated metastasis by modifying integrins in the tumor environment. In addition to β1-integrin, ST6Gal-I is known to sialylate several other critical receptors involved in metastasis. For example, ST6Gal-I-mediated sialylation of FAS and TNFR1 death receptors blocks cell apoptosis by preventing receptor internalization (Holdbrooks et al., 2018; Swindall and Bellis, 2011), whereas α2,6-sialylation of EGFR activates its tyrosine kinase activity (Britain et al., 2018). Hence, nanoparticle-derived ST6Gal-I likely alters the activity of multiple cell-surface receptors to modulate cell behavior.
Future studies will be needed to elucidate the functional effects of transferred ST6Gal-I. One important question centers on the trafficking of ST6Gal-I following uptake from exosomes or exomeres. It is possible that membrane-bound ST6Gal-I, which has a Golgi retention signal (Fenteany and Colley, 2005), and cleaved soluble ST6Gal-1 traffic to different subcellular compartments. In turn, differential subcellular localization could influence the kinetics, efficiency, and/or substrate specificity of membrane-bound versus soluble enzyme. Nonetheless, despite these unknowns, the current study provides a conceptual advance by highlighting a glycosylation-dependent mechanism by which exosomes and exomeres may remodel the activity of receptors expressed by recipient cells.
We also have discovered that AREG is carried in exomeres, in addition to exosomes as previously reported by our group (Higginbotham et al., 2011). AREG-containing exomeres and exosomes elicit prolonged EGFR and downstream signaling in recipient cells, modulate EGFR trafficking in intestinal organoids, and dramatically enhance the growth of colonic tumor organoids. The increased activity of nanoparticle AREG in these contexts is dramatic, eliciting effects at 1:1,000th of the concentration of rAREG. Why is such nanoparticle AREG so much more potent than mature soluble AREG? We previously calculated that a single exosome contains an average of 24 AREG molecules per vesicle such that these vesicles can act as signaling payloads (Higginbotham et al., 2011). Furthermore, AREG is present in both exosomes and exomeres in its proform that includes the transmembrane domain and cytosolic tail; post-translational modifications of proAREG may further enhance its activity. Differences in EGFR trafficking induced by AREG-containing exomeres and exosomes, compared to rAREG, may be due to this distinct packaging of AREG in nanoparticles that may lead to a “reservoir” of EGFRs with perdurance of signaling. Organoid technology has been rapidly adopted as a model system in both basic and translational research (Drost and Clevers, 2018; Dutta et al., 2017), and our results provide an example of how organoids can be used to examine biological properties of exosomes and exomeres.
There are several caveats to our results. We have examined a limited number of cell lines, so going forward it will be important to examine additional cell lines, normal and neoplastic, as well as samples derived from tissues. A direct comparison between our ultracentrifugation-based method of isolation and AF4 using the same starting material, would confirm that the “exomere-like” particles we purify match the exomeres obtained with AF4. We cannot exclude that there may be additional nanoparticles within our exomere preparation, or that there may be subpopulations of exomeres. It is also possible that not all exosomes are removed with the initial 4-h ultracentrifugation step and that the pellet from the second prolonged high-speed ultracentrifugation may contain some degree of sEV/exosomal contamination. As shown in the immunoblots in Figure 2D, we do detect syntenin-1 and CD81 in exosomes; however, their levels are much lower in exomeres. Moreover, proteins commonly found in exosomes (Flotillin-1, EGFR, β1-integrin) are not detected in exomeres. Thus, in our judgement, it is unlikely there is substantial exosomal contamination in our exomere preparation.
As noted in Results, there was a large degree of overlap for the 50 most abundant proteins found in both sEVs and DNPs. Our companion manuscript in Cell provides a likely explanation for this overlap. Gradient fractionation of the initial sEV/exosome ultracentrifugation (4 h) pellet shows it contains low-density fractions corresponding to bona fide sEV/exosomes and high-density fractions made up of many proteins identified in exomeres (Jeppesen et al., 2019). These high-density fractions were non-membranous, which is consistent with the distinct depletion of lipids in the exomeres compared to the exosomes that we have observed here (Figure 3E). We also demonstrate that Argonaute 1–3 are enriched in exomeres, which is consistent with our recent report of exosome-independent Argonaute release and substantial non-sEV-mediated miRNA secretion (Jeppesen et al., 2019).
In summary, we provide a simple method to isolate exomeres and show that they contain and can transfer functional cargo. This simplified method of isolation should facilitate further work toward a deeper understanding of the nature and properties of exomeres, especially in the context of what is known about other populations of EVs. Such work will be necessary to identify biological roles for these nanoparticles and their potential use as biomarkers and in therapeutic applications.
STAR★METHODS
CONTACT FOR REAGENT AND RESOURCE SHARING
Further information and requests for resources and reagents should be directed to and will be fulfilled by the Lead Contact, Robert Coffey (robert.coffey@vumc.org).
EXPERIMENTAL MODEL AND SUBJECT DETAILS
Mice
Egfrtm1(EmeraldV5)Rjc (EgfrEm [Yang et al., 2017]), Lrig1tm1.1(cre/ERT)Rjc (Lrig1CreERT2 [Powell et al., 2012]) Apctm1Tno (Apcfl) (Shibata et al., 1997) were used, and all animals were PCR-genotyped. Animal handling was under protocols (M1800064 and M1600155) approved by Vanderbilt University Medical Center Institutional Animal Care and Use Committee. Normal Intestinal organoids were generated from the small intestine of an 8-month old EgfrEm/EM female mouse as described (Yang et al., 2017). Tumors were induced in Lrig1CreERT2/+;Apcfl/+ female mice as previously described (Powell et al., 2012) and colonic tumor organoids were generated 6 months after tumor induction (Yang et al., 2017).
Cell Culture
HD3 cells were grown in DMEM low glucose (1 g/L) medium supplemented with 7% fetal bovine serum (FBS) and 1% penicillin/streptomycin. SW948 cells were maintained in DMEM:Liebovitz’ L-15 media in a 3:1 ratio with 10% FBS, 1% glutamine, 1% non-essential amino acids and 1% penicillin/streptomycin. SW48 cells were grown in Leibovitz’ L15 medium containing 10% FBS, 2mM glutamine and gentamicin. DiFi cells, MDCK parental cells, MDCK AREG cells, Gli36 parental, and Gli36 EGFRvIII cells were cultured in DMEM medium supplemented with 10% bovine growth serum, 1% glutamine, 1% non-essential amino acids, and 1% penicillin/streptomycin. SUM149- shAREG cells were cultured in Ham’s F-12 mediaum supplemented with 5% fetal bovine serum, 5 μg/ml insulin, 2 μg/ml hydrocortisone, 5 μg/ml gentamicin and 1ug/ml puromycin as described (Baillo et al., 2011). All cell culture medium was purchased from Corning Cellgro (Manassas, VA), and all cell culture supplements were from Hyclone (Logan, UT) unless stated otherwise. To modulate ST6Gal-I expression in the various cell lines, lentiviral vectors were used to either overexpress ST6Gal-I (human st6gal1 vector from Genecopoeia) or introduce ST6Gal-I-targeting shRNA (Sigma, St. Louis, MO, TRCN00000035432). Stable pools were obtained following puromycin selection. All cells were grown at 37°C with 5% CO2.
METHOD DETAILS
Isolation of sEVs and DNPs
sEVs and DNPs were isolated from cell-conditioned medium as previously described (Higginbotham et al., 2011,2016) with modifications. Cells were cultured in specific medium as described above until 80% confluent. The cells were then washed three times with PBS and cultured for 48 h in serum-free medium. The serum-free conditioned medium was removed and centrifuged for 15 mins at 300 × g to remove cellular debris, and the resulting supernatant was then filtered through a 0.22-μm polyethersulfone filter (Nalgene, Rochester, NY) to reduce microparticle contamination. The filtrate was concentrated with a 100,000 molecular-weight cutoff centrifugal concentrator (Millipore). The concentrate was then subjected to high-speed centrifugation at 167,000 × g for 4 h, and the resulting sEV-enriched pellet was resuspended in PBS containing 25 mM HEPES (pH 7.2) and washed by centrifuging again at 167,0000 × g for 3 h. The washed pellet was designated as sEVs. To isolate DNPs, the supernatant collected from the 4-h ultracentrifugation was ultracentrifuged at 167, 000 xg for 16 h. The resulting pellet was resuspended in PBS containing 25 mM HEPES (pH 7.2) and washed by centrifuging again at 167,000 × g for 4 h. The washed pellet was designated as DNP. Both the sEV and DNP pellets were resuspended and stored in PBS containing 25 mM HEPES (pH 7.2). The protein concentrations of the nanoparticles were determined with a Direct Detect™ (Millipore, Burlington, MA). The size, number, and morphology of sEVs and DNPs were characterized by nanoparticle tracking (NanoSight, Wiltshire, UK) and TEM.
Nanoparticle tracking analysis (NTA)
DNPs and sEVs were analyzed by NTA using a NanoSight LM10 system (NanoSight Ltd, Amesbury, UK) configured with a 405 nm laser and a high-sensitivity sCMOS camera (OrcaFlash 2.8, Hamamatsu C11440, NanoSight Ltd). Analysis using the NTA-software (version 2.3, build 0006 beta 2) was as previously described (Higginbotham et al., 2016). In brief, each sample was diluted 1,000-fold in particle-free PBS and introduced manually. The detection threshold was 10, blur and minimum expected particle size were set to “auto,” and minimum track length set to 10. The ambient temperature was recorded manually and did not exceed 25°C. Five videos of 60 s duration were recorded for each sample. Calibrations were performed using polystyrene latex microspheres with sizes of 100, 200, and 400 nm.
Transmission electron microscopy (TEM)
TEM was carried out as previously described (Higginbotham et al., 2011,2016) with slight modifications. DNPs and sEVs were fixed with 2.5% glutaraldehyde in 0.1 M sodium cacodylate buffer for 30 mins at room temperature (RT). Samples then were incubated on formvar carbon-coated grids for 1 min followed by negative staining with 2% uranyl acetate for 30 s. Imaging was performed on a Philips/FEI T-12 transmission electron microscope.
FAVS staining and analysis of exosomes
Exosomes were stained and sorted as previously described (Higginbotham et al., 2016). Briefly, 5 mgs of DiFi-derived exosomes were blocked with 100 μg/ml of human IVIG for 4 hr under constant rotation at RT and washed 3 times with PBS containing 20 mM HEPES (PBS-H). All washes, unless stated otherwise, were performed in triplicate with a S100-AT4 fixed angle rotor at 228,000 × g (65,000 rpm, effective k factor of 38 with 1.5 mL ultramicrofuge tubes filled to capacity) for 30 mins. Samples were suspended and processed as above. DiFi cell-derived exosomes, processed as above, were then stained simultaneously with CD81 (0.14 μg/ml) (BD) directly conjugated to PE and cetuximab (CTX) directly conjugated to Alexa-647 (0.25 μg/ml) for 4 h under constant rotation at 4°C and washed 3 times with PBS-H. All subsequent staining reactions, unless noted otherwise, were performed for 4 h under constant rotation at 4°C in PBS-H with 100 μg/ml of IVIG. To establish an unstained baseline, 100 μg of DiFi cell-derived exosomes were blocked with 100 μg/ml human IVIG as above and diluted to a final concentration of 1 ng/ml and FAVS was performed as previously described (Higginbotham et al., 2016). All FAVS analysis and sorting were performed on a FACS Aria IIIu flow cytometer customized with a forward scatter PMT.
Treatment of recipient cells with exosomes and exomeres
Cells were serum starved for 24 h, then trypsinized and suspended in serum-free DMEM. One million cells were incubated with 100 μg exosomes or exomeres derived from DiFi cells or 25 μg exosomes or exomeres derived from MDCK cells for the indicated times at 37°C with rotation. Samples at the earlier time points were harvested and pelleted and other parallel samples (after 3 h) were plated on tissue culture dishes in DMEM containing 10% fetal calf serum and harvested at times indicated.
Immunoblotting
Cells, exosomes and exomeres were lysed in ice-cold RIPA buffer: 50 mM Tris-HCl pH 7.5,150 mM NaCl, 1% Triton X-100, 1% de-oxycholate, 0.1% SDS, 1 mM PMSF containing a complete protease inhibitor tablet and PhosSTOP tablet (Roche, Indianapolis IN). Lysates were sonicated 3 times and were cleared by centrifugation at 14,000 rpm for 5 mins. Supernatant fractions were quantified using direct Detect and used for immunoblotting. Proteins were resolved by SDS-PAGE under reducing conditions, except for CD81 and AREG immunoblots, which were resolved under non-reducing conditions, and transferred to nitrocellulose membranes (GE Healthcare, Pittsburgh, PA). Membranes were blocked with 5% (w/v) skim milk powder in Tris-buffered saline for 1 h and incubated with primary antibodies overnight at 4°C. After incubation with HRP-coupled secondary antibodies for 1 h, immunoblots were developed using chemiluminescence (Western Lightning Plus-ECL, PerkinElmer, Waltham, MA).
Lectin assays
Lectin precipitation was carried out as described (Shaikh et al., 2008). Briefly, total cell lysate was incubated overnight with 50 μL agarose-conjugated SNA-1 lectin with rotation at 4°C (EY Laboratories, San Mateo, CA). α2,6 sialylated proteins were pelleted with the SNA lectin by brief centrifugation and washed 3 times with lysis buffer, followed by one wash with phosphate-buffered saline (PBS). Sialylated proteins were released from the complexes by boiling in SDS-PAGE sample buffer. The glycoproteins were resolved by SDS-PAGE, then immunoblotted to detect β1-integrin and ST6Gal-I. For some experiments, lysates were treated with neuraminidase prior to SNA pulldowns. Briefly, lysates were incubated for 90 mins at RT with Arthrobacter ureafaciens neuraminidase in accordance with the vendor protocol (Sigma).
Fluorescent tag modification of primary antibody
CTX (2 μg/μl, 250μl) was transferred to a 2 mL Zeba Spin desalting column (Thermo Fischer Scientific, Waltham, MA). PBS was used to rinse out the antibody source vial; it was added to the column, which was then spun at 1,000 × g for 5 mins. All purified antibody from the column was added to NHS-ester Alexa-647 (Thermo Fisher Scientific, Waltham, MA). Reactions were performed at RT for 2 h. After the reaction, the mixture was purified through another 2 mL Zeba Spin desalting column to remove unconjugated dye.
Quantification of total cell surface sialylation by flow cytometry
Total α2,6 linked sialic acid on the surface of cells was determined by flow cytometry. Cells were harvested from tissue culture dishes by trypsinization and then re-suspended to a concentration of 1×10⁶ cells/ml in staining buffer (10 μg/ml IVIG, 2% FBS in PBS supplemented with 10mM HEPES, pH 7.2). SNA-FITC (Vector Labs) was added at a 1:200 dilution to the cells in staining buffer. The cells were incubated on ice for 1 h, washed 3 times with staining buffer and then resuspended in PBS containing 2% FBS and 1 μg/ml propidium iodide (PI) for analysis. A total of 10,000 living cells were acquired per sample using LSRII (BD), and data was analyzed using FACS DiVa 6.1 software.
Proteomics
Exosomes and exomeres derived from DiFi cells were lysed in RIPA buffer, and equal amounts of protein were run on a NuPAGE Bis-Tris gel. The gel was stained with Novex colloidal Coomassie stain (Invitrogen) and destained in water. Coomassie-stained gel regions then were cut from the gel and diced into 1mm3 cubes. Proteins were treated for 30 mins with 45 mM DTT at 55°C, and available Cys residues were carbamidomethylated for 30 mins with 100 mM iodoacetamide at RT in the dark. Gel pieces were further destained with 50% MeCN in 25 mM ammonium bicarbonate, and proteins were digested with trypsin (10 ng/uL) in 25 mM ammonium bicarbonate overnight at 37°C. Peptides were extracted by gel dehydration with 60% MeCN, 0.1% TFA; extracts were dried by speed vac centrifugation and reconstituted in 0.1% formic acid. Peptides were analyzed by LC-coupled tandem mass spectrometry (LC-MS/ MS). An analytical column was packed with 20 cm of C18 reverse phase material (Jupiter, 3 μm beads, 300Å, Phenomenox) directly into a laser-pulled emitter tip. Peptides were loaded on the capillary reverse phase analytical column (360 μm O.D. × 100 mm I.D.) using a Dionex Ultimate 3000 nanoLC and autosampler. The mobile phase solvents consisted of 0.1% formic acid, 99.9% water (solvent A) and 0.1% formic acid, 99.9% acetonitrile (solvent B). Peptides were gradient-eluted at a flow rate of 350 nL/min using a 180-minute gradient. The gradient consisted of the following: 1–3 mins, 2% B (sample loading from autosampler); 3–155 mins, 2%−40% B; 155–165 mins, 40%−90% B; 165–169 mins, 90% B; 169–170 mins, 90%−2% B; 170–180 mins (column re-equilibration), 2% B. A Q Exactive Plus mass spectrometer (Thermo Scientific) (Eng et al., 1994), equipped with a nanoelectrospray ionization source, was used to mass analyze the eluting peptides using a data-dependent method. The instrument method consisted of MS1 using an MS AGC target value of 3e6, followed by up to 20 MS/MS scans of the most abundant ions detected in the preceding MS scan. A maximum MS/MS ion time of 80 ms was used with a MS2 AGC target of 5e4. Dynamic exclusion was set to 30 s, HCD collision energy was set to 27 nce, and peptide match and isotope exclusion were enabled. For identification of peptides, tandem mass spectra were searched with Sequest (Thermo Fisher Scientific) against a Homo sapiens database created from the UniprotKB protein database (https://www.uniprot.org/). Variable modifications of +15.9949 on Met (oxidation) and +57.0214 on Cys (carbamidomethylation) were included for database searching. Search results were assembled using Scaffold 4.3.2. (Proteome Software).
Analysis of proteomic profiling data
Spectral counts of proteins were normalized by the total spectral counts. Principle component analysis was performed to assess the similarity between samples. Differential expression between sEVsand DNPs was identified using the ‘Limma’ package. Proteins with a fold change of > 2 and a false discovery rate (FDR) < 0.05 were considered to be significantly differentially expressed. The top 50 most differentially expressed proteins in either direction (a total of 100) were used to generate the heatmap. All proteomic data analysis was performed in the R 3.4.4.
Gene set enrichment analysis (GSEA) was implemented against three reference gene sets from the Molecular Signatures database (MSigDB v6.1, http://software.broadinstitute.org/gsea/msigdb/index.jsp): (H) hallmark gene sets (50 gene sets); (C2) KEGG gene sets (186 gene sets), and (C5) all gene ontology (GO) gene sets (5,917 gene sets). Default parameters were used to identify significantly enriched gene sets (min size 15, max size 500, FDR q < 0.25).
Quantitative RT-PCR
SW948 cells were either not treated or treated with DiFi exosomes and harvested at the indicated times as described in “Treatment of recipient cells with exosomes.” Total RNA was isolated and purified with RNeasy Mini Kit (QIAGEN, Germantown, MD) with on-column DNase treatment according to the manufacturer’s instructions. cDNA synthesis was performed using the iScript cDNA synthesis kit (Bio-Rad, Hercules, CA). Quantitative real-time PCR was performed on Bio-Rad CFX96 C1000 Touch Thermal cycler by using iQ SYBR Green supermix (Bio-Rad). Relative measurement of gene expression was calculated following manufacturer’s instructions using the ΔΔCt method. Actin was used to calculate normalized fold-change. The specific human ST6Gal-I primer sequences are: Forward: 5′-CAAGGAGAGCATTAGGACCAAG-3′; Reverse: 5′-CCCCATTAAACCTCAGGACTG-3′. The specific human AREG primer sequences are: Forward: 5′-GTGTGGGGAAAAGTCCATGA- 3′; Reverse: 5′-CTGGAAAGAGGA CCGACTCA-3′.
In vitro sialyltransferase assay
Exosomes and exomeres were lysed in tris-buffered saline containing 1% Triton X-100. Protein concentration was quantified using BCA (Thermo Fischer Scientific/Pierce, Waltham, MA). Sialyltransferase activity present in the lysates was determined using the Sialyltransferase Activity Kit from R&D Systems (cat# EA002) according to the vendor protocol with a few modifications Briefly, CMP-Sialic Acid (Sigma, cat# C8271) was used at a final concentration of 2.5 mM, N-acetyl-D-lactosamine (Sigma, cat# A7791) was used at a final concentration of 2.5 mM, the coupling phosphatase was used at a final concentration of 10 ng/μL, and CMP was used at a final concentration of 0.1 mM. Samples were incubated at 37°C for 1 hr, and optical density was determined using a BioTek Synergy H1 plate reader. This assay employs a detection step involving the release of inorganic phosphate following transfer of sialic acid from CMP-sialic acid to the acceptor substrate. Values were corrected by subtracting the optical density of a negative control reaction with no sialyltransferase, plotted against the amount of protein lysate added to each reaction.
Lipidomic analysis
Lipids from sEVs or DNPs were extracted by the method of Bligh and Dyer(Bligh and Dyer, 1959) in the presence of internal standards including eicosanoic acid, 1–0-heptadecanoyl-LPC, dieicosanoyl-PC, ditetradecanoyl-PE, ditetradecanoyl-PS, N-heptadecanoyl-SM, N-heptadecanoyl-Cer, cholesteryl heptadecanoate, and cholesterol-d4. Extracted lipids were resuspended in chloroform/methanol (2:1, by vol.) and analyzed by ESI-MSat a flow rate of 3 μL/min using a Thermo Electron TSQ Quantum Ultra® instrument. Samples were analyzed in both the positive and negative ion mode using a shotgun lipidomics approach (Han and Gross, 2005). For LPC, neutral loss scanning (NLS) of 59.1 was monitored in the positive ion mode for sodiated molecular ions. NLS of 368.5 was performed for sodiated CE molecular species in the positive ion mode (Bowden et al., 2011). PE was derivatized to fMOC-PE species and monitored in negative ion mode using NLS 222.2 (Han et al., 2005). NLS 256.2, 50, 50, and 87 for ceramide, PC, SM and PS, respectively, was performed in the negative ion mode (Han and Gross, 2005). Free cholesterol was converted to cholesteryl acetate using acetyl chloride and monitored using product ion scanning of 83 in the positive ion mode (Brown et al., 2013). Fatty acids were converted to pentafluorobenzyl esters and quantified using negative ion chemical ionization detection and gas chromatography (Quehenberger et al., 2010). Spectra were averaged over 3–5 min and processed utilizing Xcalibur® software (Thermo Electron). Individual molecular species were quantified by comparing the ion intensity of individual molecular species to that of the appropriate internal standards following corrections for type I and type II 13C isotope effects (Han and Gross, 2005). Additional corrections were made from response curves for CE molecular species (Bowden et al., 2011). Each sample was normalized to protein content, and values are expressed per microgram protein.
Organoid culture, tissue fixation, and immunohistochemistry
Normal intestinal organoid culture and tumor organoid culture were maintained and passaged as described (Shimokawa et al., 2017; Yang et al., 2017). Intestinal organoids were fixed and prepared for immunohistochemistry as described (Yang et al., 2017). Primary antibody used for immunostaining: β-catenin (1:1000, BD Bioscience), GFP (1:400, Thermofisher). Images were taken using a Nikon A1R confocal microscope. Data processing and presentation were performed using Adobe Photoshop (CS6).
QUANTIFICATION AND STATISTICAL ANALYSIS
Quantification of total cell -sialylation by flow cytometry was analyzed using FACS DiVa 6.1 software. Means of fluorescent intensity and error bars were calculated and the difference between treatments were compared using ANOVA analysis as indicated in the figure legends. For proteomic analysis, spectral counts of proteins were normalized by the total spectral counts. Principle component analysis was performed to assess the similarity between samples. Differential expression between sEVs and DNPs was identified using the ‘Limma’ package. Proteins with a fold-change of > 2 and a false discovery rate (FDR) < 0.05 were considered to be significantly differentially expressed. The top 50 most differentially expressed proteins in either direction (a total of 100) were used to generate the heatmap. All proteomic data analysis was performed in R 3.4.4. The number of biological and/or technical replicates are described in the figure legends and/or specific methods.
Supplementary Material
KEY RESOURCES TABLE
| REAGENT or RESOURCE | SOURCE | IDENTIFIER |
|---|---|---|
| Antibodies | ||
| Mouse monoclonal anti-CD81 | R&D Systems | Cat#MAB4615; RRID: AB_920544 |
| Goat polyclonal anti-ST6Gal-I | R&D Systems | Cat#AF5924; RRID: AB_2044637 |
| Mouse monoclonal anti-CD81 (PE) | R&D Systems | Cat#FAB4615P; RRID: AB_2076386 |
| Mouse monoclonal anti-CD29 | BD | Cat#610467; RRID: AB_2128060 |
| Rabbit polyclonal anti-EGFR | Millipore | CaT#06-847; RRID: AB_2096607 |
| Rabbit monoclonal anti-Syntenin-1 | Abcam | CaT#AB133267; RRID: AB_11160262 |
| Mouse monoclonal anti-CD9 | R&D Systems | CaT#MAB1880; RRID: AB_2075900 |
| Moue monoclonal anti-FLOT1 | BD | CaT#610820; RRID: AB_398139 |
| Rabbit monoclonal anti-HK1 | Cell Signaling Technology | Cat#2024; RRID: AB_2116996 |
| Rabbit monoclonal anti-BACE1 | Cell Signaling Technology | Cat#5606; RRID: AB_1903900 |
| Rabbit monoclonal anti-AGO1 | Cell Signaling Technology | Cat#5053; RRID: AB_2616013 |
| Rabbit monoclonal anti-AGO2 | ABCAM | Cat#AB186733; RRID: AB_2713978 |
| Mouse monoclonal anti-β-Actin | Sigma | Cat#A5316; RRID: AB_476743 |
| Mouse monoclonal anti-GAPDH | Sigma | Cat#G8795; RRID: AB_1078991 |
| Rabbit polyclonal anti-Akt | Cell Signaling Technology | CaT#9272; RRID: AB_329827 |
| Rabbit polyclonal anti-P-Akt | Cell Signaling Technology | CaT#9271; RRID: AB_329825 |
| Rabbit polyclonal anti-Erk1/2 | Cell Signaling Technology | CaT#9102; RRID: AB_330744 |
| Rabbit polyclonal anti-P-Erk1/2 | Cell Signaling Technology | CaT#9101; RRID: AB_331646 |
| Mouse monoclonal anti-AREG (6R1C2.4) | Gregory D. Plowman, Bristol-Myers Squibb Research Institute | N/A |
| Mouse monoclonal Cetuximab (CTX) | Lilly, Indianapolis | N/A |
| Mouse monoclonal Anti-Catenin, beta | BD | Cat#610154; RRID: AB_397555 |
| Rabbit polyclonal anti-GFP | Life Technologies | Cat# A-11122; RRID: AB_221569 |
| Chemicals, Peptides, and Recombinant Proteins | ||
| Human Intravenous Immune Globulin (IVIG) | CLS Behring | Cat#NDC44206417 |
| phosSTOP tablet | Roche | Cat#04906837001 |
| Proteasome Inhibitor tablet | Sigma | P2714 |
| SNA-1 Lectin | Vector Laboratories | Cat#AL-1303 |
| Neuraminidase | Roche | Cat#10269611001; Lot# 29869420 |
| Fluorescein labeled SNA | Vector Laboratories | Cat#FL-1301 |
| CMP-Sialic Acid | Sigma | Cat#C8271 |
| W-acetyl-D-lactosamine | Sigma | Cat# A7791 |
| Alexa Fluor 647 NHS Ester (Succinimidyl Ester) | Thermo Fisher Scientific | Cat#A20106 |
| ST6Gal-I shRNA | Sigma | Cat#TRCN00000035432; Lot# 01041315MN |
| Human soluble AREG | R&D | Cat#262-AR-100 |
| mouse soluble EGF | R&D | Cat#2028-EG |
| Critical Commercial Assays | ||
| RNeasy Mini Kit | QIAGEN | Cat#74104 |
| iScript cDNA Synthesis Kit | Bio-Rad | Cat#170-8890 |
| DNeasy Blood and Tissue Kit | QIAGEN | Cat#69504 |
| miCURY RNA Isolation Kit | Exiqon | Cat#300110 |
| SYBR Green Master Mix | Thermo Fisher Scientific | Cat#A25742 |
| Sialyltransferase Activity Kit | R&D | Cat#EA002 |
| Experimental Models: Cell Lines | ||
| Human: SW948 | ATCC | Cat# CCL-237 |
| Human: SW48 | ATCC | Cat# CCL-231 |
| Human: HD3 | Dr. Eileen Friedman, SUNY Syracuse | N/A |
| Human: DiFi | Dr. Coffey Lab | N/A |
| Human: MDCK Parental | Dr. Enrique Rodriguez-Boulan, Cornell University Medical College | N/A |
| Human: MDCK AREG | Coffey Lab; Brown et al., 1998 | N/A |
| Human: Gli36 Parental | Dr. Xandra O. Breakefield, Harvard Medical School | N/A |
| Human: Gli36 EGFRvIII | Dr. Xandra O. Breakefield, Harvard Medical School | N/A |
| Human: SUM149-shAREG | Dr. Stephen P. Ethier, University of South Carolina; Baillo et al., 2011 | N/A |
| Experimental Models: Organisms/Strains | ||
| Mouse: EgfrEm/Em | Yang et al., 2017 | N/A |
| Mouse: Lrig1CreER/+Apcflox/+ | Powell et al., 2012 | N/A |
| Oligonucleotides | ||
| ST6Gal-I F: 5′-CAAGGAGAGCAT TAGGACCAAG −3′ | Sigma | N/A |
| ST6Gal-I R: 5′-CCCCATTAAACCT CAGGACTG −3′ | Sigma | N/A |
| AREG F: 5′-GTGTGGGGAAAAGT CCATGA −3′ | RealTimePrimers | RealTimePrimers.com |
| AREG R: 5′-CTGGAAAGAGGACC GACTCA −3′ | RealTimePrimers | RealTimePrimers.com |
| Recombinant DNA | ||
| Human st6gal1 Vector | Genecopoeia | Cat# LPP-M0351-Lv105-200-S; Lot# GC07062K1505 |
| Software and Algorithms | ||
| NTA version 2.3 build 0006 beta 2 software (old software version) | Malvern Panalytical | https://www.malvernpanalytical.com/en/support/product-support/nanosight-range/nanosight-lm10/index.html |
| FACS DiVa 6.1 software | B.D biosciences | https://www.bdbiosciences.com/in/instruments/software/facsdiva/resources/overview.jsp |
| Sequest software | Thermo Fisher Scientific; Eng et al., 1994 | https://www.thermofisher.com/order/catalog/product/OPTON-30795 |
| Proteomics software Scaffold 4.3.2 | Proteome Software | http://www.proteomesoftware.com/products/scaffold/ |
| Proteomic analysis R software | https://cran.r-project.org/ | |
| Lipidomics software Xcalibur | Thermo Scientific (Thermo Electron) | http://tools.thermofisher.com/content/sfs/manuals/XCALI-Library-0606.pdf |
Highlights.
Exomeres can be isolated using a simplified ultracentrifugation method
Exomeres are enriched for Argonaute proteins and APP
ST6Gal-I in exomeres sialylates recipient cell-surface targets including β1-integrin
AREG in exomeres modulates EGFR trafficking and increases tumor organoid growth
ACKNOWLEDGMENTS
This publication is part of the NIH Extracellular RNA Communication Consortium paper package and was supported by the NIH Common Fund’s ex-RNA Communication Program. This work was supported by NIH grant R01 GM111093 (S.L.B.) and NCI P50 CA095103, R35 CA197570, U19 CA179514, R01CA163563, and R01 CA046413 (R.J.C.). We thank Xandra O. Breakefield at Harvard Medical School for providing the glioblastoma cell lines and Stephen P. Ethier at Medical University of South Carolina for providing parental and AREG KD SUM-149 cells. Flow cytometry experiments were performed in the Vanderbilt University Flow Cytometry Shared Resource, which is supported by the Vanderbilt-Ingram Cancer Center P30 CA68485 and the Vanderbilt Digestive Disease Research Center P30 DK058404. We thank Kristie Lindsey Rose and Salisha Hill at the Vanderbilt Proteomics Shared Resource for performing the proteomic analysis. We acknowledge the support of the Vanderbilt Cell Imaging Shared Resource and the Vanderbilt Technologies for Advanced Genomics Shared Resource. We acknowledge the generous support of the Welborn Memorial Fund.
Footnotes
DECLARATION OF INTERESTS
The authors declare no competing interests.
SUPPLEMENTAL INFORMATION
Supplemental Information can be found online at https://doi.org/10.1016/j.celrep.2019.01.009.
REFERENCES
- Baillo A, Giroux C, and Ethier SP (2011). Knock-down of amphiregulin inhibits cellular invasion in inflammatory breast cancer. J. Cell. Physiol 226, 2691–2701. [DOI] [PMC free article] [PubMed] [Google Scholar]
- Barnard JA, Graves-Deal R, Pittelkow MR, DuBois R, Cook P, Ramsey GW, Bishop PR, Damstrup L, and Coffey RJ (1994). Auto- and cross-induction within the mammalian epidermal growth factor-related peptide family. J. Biol. Chem 269, 22817–22822. [PubMed] [Google Scholar]
- Bligh EG, and Dyer WJ (1959). A rapid method oftotal lipid extraction and purification. Can. J. Biochem. Physiol 37, 911–917. [DOI] [PubMed] [Google Scholar]
- Bowden JA, Shao F, Albert CJ, Lally JW, Brown RJ, Procknow JD, Stephenson AH, and Ford DA (2011). Electrospray ionization tandem mass spectrometryofsodiated adducts ofcholesteryl esters. Lipids 46,1169–1179. [DOI] [PMC free article] [PubMed] [Google Scholar]
- Britain CM, Holdbrooks AT, Anderson JC, Willey CD, and Bellis SL (2018). Sialylation of EGFR by the ST6Gal-I sialyltransferase promotes EGFR activation and resistance to gefitinib-mediated cell death. J. Ovarian Res 11, 12. [DOI] [PMC free article] [PubMed] [Google Scholar]
- Brown CL, Meise KS, Plowman GD, Coffey RJ, and Dempsey PJ (1998). Cell surface ectodomain cleavage of human amphiregulin precursor is sensitive to a metalloprotease inhibitor. Release of a predominant N-glyco-sylated 43-kDa soluble form. J. Biol. Chem 273, 17258–17268. [DOI] [PubMed] [Google Scholar]
- Brown RJ, Shao F, Baldan A, Albert CJ, and Ford DA (2013). Cholesterol efflux analyses using stable isotopes and mass spectrometry. Anal. Bio chem 433, 56–64. [DOI] [PMC free article] [PubMed] [Google Scholar]
- Clayton A, Turkes A, Dewitt S, Steadman R, Mason MD, and Hallett MB (2004). Adhesion and signaling by B cell-derived exosomes: the role of integrins. FASEB J. 18, 977–979. [DOI] [PubMed] [Google Scholar]
- Coffey RJ Jr., Derynck R, Wilcox JN, Bringman TS, Goustin AS, Moses HL, and Pittelkow MR (1987). Production and auto-induction of transforming growth factor-alpha in human keratinocytes. Nature 328, 817–820. [DOI] [PubMed] [Google Scholar]
- Dall’Olio F, and Chiricolo M (2001). Sialyltransferases in cancer. Glycoconj. J 18, 841–850. [DOI] [PubMed] [Google Scholar]
- Drost J, and Clevers H (2018). Organoids in cancerresearch. Nat. Rev. Cancer 18, 407–418. [DOI] [PubMed] [Google Scholar]
- Dutta D, Heo I, and Clevers H (2017). Disease modeling in stem cell-derived 3D organoid systems. Trends Mol. Med 23, 393–410. [DOI] [PubMed] [Google Scholar]
- Eng JK, McCormack AL, and Yates JR (1994). An approach to correlate tandem massspectral data ofpeptides with aminoacid sequences in a protein database. J. Am. Soc. Mass Spectrom 5, 976–989. [DOI] [PubMed] [Google Scholar]
- Fenteany FH, and Colley KJ (2005). Multiple signals are required for alpha2,6-sialyltransferase (ST6Gal I) oligomerization and Golgi localization. J. Biol. Chem 280, 5423–5429. [DOI] [PubMed] [Google Scholar]
- Gephart JD, Singh B, Higginbotham JN, Franklin JL, Gonzalez A, Folsch H, and Coffey RJ (2011). Identification of a novel mono-leucine basolateral sorting motif within the cytoplasmic domain of amphiregulin. Traffic 12, 1793–1804. [DOI] [PMC free article] [PubMed] [Google Scholar]
- Han X, and Gross RW (2005). Shotgun lipidomics: electrospray ionization mass spectrometric analysis and quantitation of cellular lipidomes directly from crude extracts of biological samples. Mass Spectrom. Rev 24,367–412. [DOI] [PubMed] [Google Scholar]
- Han X, Yang K, Cheng H, Fikes KN, and Gross RW (2005). Shotgun lipidomics of phosphoethanolamine-containing lipids in biological samples after one-step in situ derivatization. J. Lipid Res 46, 1548–1560. [DOI] [PMC free article] [PubMed] [Google Scholar]
- Higginbotham JN, Demory Beckler M, Gephart JD, Franklin JL, Bogatcheva G, Kremers GJ, Piston DW, Ayers GD, McConnell RE, Tyska MJ, and Coffey RJ (2011). Amphiregulin exosomes increase cancer cell invasion. Curr. Biol 21, 779–786. [DOI] [PMC free article] [PubMed] [Google Scholar]
- Higginbotham JN, Zhang Q, Jeppesen DK, Scott AM, Manning HC, Ochieng J, Franklin JL, and Coffey RJ (2016). Identification and characterization of EGF receptor in individual exosomes by fluorescence-activated vesicle sorting. J. Extracell. Vesicles 5, 29254. [DOI] [PMC free article] [PubMed] [Google Scholar]
- Holdbrooks AT, Britain CM, and Bellis SL (2018). ST6Gal-I sialyltransferase promotes tumor necrosis factor (TNF)-mediated cancer cell survival via sialylation of theTNF receptor 1 (TNFR1) death receptor. J. Biol. Chem 293, 1610–1622. [DOI] [PMC free article] [PubMed] [Google Scholar]
- Hoshino A, Costa-Silva B, Shen TL, Rodrigues G, Hashimoto A, Tesic Mark M, Molina H, Kohsaka S, Di Giannatale A, Ceder S, et al. (2015). Tumour exosome integrins determine organotropic metastasis. Nature 527, 329–335. [DOI] [PMC free article] [PubMed] [Google Scholar]
- Hsieh CC, Shyr YM, Liao WY, Chen TH, Wang SE, Lu PC, Lin PY, Chen YB, Mao WY, Han HY, et al. (2017). Elevation of β-galactoside a2,6-sialyltransferase 1 in a fructoseresponsive manner promotes pancreatic cancer metastasis. Oncotarget 8, 7691–7709. [DOI] [PMC free article] [PubMed] [Google Scholar]
- Jeppesen DK, Fenix AM, Franklin JL, Higginbotham JN, Zhang Q, Zimmerman LJ, Liebler DC, Ping J, Liu Q, Evans R, et al. (2019). Reassessment of exosome composition. Cell 177, Published online April 4, 2019. https://doi.org/10.10167j.cell.2019.02.029. [DOI] [PMC free article] [PubMed] [Google Scholar]
- Kitazume S, Nakagawa K, Oka R, Tachida Y, Ogawa K, Luo Y, Citron M, Shitara H, Taya C, Yonekawa H, et al. (2005). In vivo cleavage of alpha2,6-sialyltransferase by Alzheimer beta-secretase. J. Biol. Chem 280, 8589–8595. [DOI] [PubMed] [Google Scholar]
- Kowal J, Arras G, Colombo M, Jouve M, Morath JP, Primdal-Bengtson B, Dingli F, Loew D, Tkach M, and Thery C (2016). Proteomic comparison defines novel markersto characterize heterogeneous populations ofextracellular vesicle subtypes. Proc. Natl. Acad. Sci. USA 113, E968–E977. [DOI] [PMC free article] [PubMed] [Google Scholar]
- Laulagnier K, Javalet C, Hemming FJ, Chivet M, Lachenal G, Blot B, Chatellard C, and Sadoul R (2018). Amyloid precursor protein products concentrate in a subset of exosomes specifically endocytosed by neurons. Cell. Mol. Life Sci 75, 757–773. [DOI] [PMC free article] [PubMed] [Google Scholar]
- Lim YJ,and Lee SJ (2017).Areexosomesthevehicleforprotein aggregate propagation in neurodegenerative diseases? Acta Neuropathol. Commun. 5, 64. [DOI] [PMC free article] [PubMed] [Google Scholar]
- Lin S, Kemmner W, Grigull S, and Schlag PM (2002). Cell surface alpha 2,6 sialylation affects adhesion of breast carcinoma cells. Exp. Cell Res 276, 101–110. [DOI] [PubMed] [Google Scholar]
- Lise M, Belluco C, Perera SP, Patel R, Thomas P, and Ganguly A (2000). Clinical correlations of alpha2,6-sialyltransferase expression in colorectal cancer patients. Hybridoma 19, 281–286. [DOI] [PubMed] [Google Scholar]
- Lu J, and Gu J (2015). Significanceof β-galactoside a2,6sialyltranferase 1 in cancers. Molecules 20, 7509–7527. [DOI] [PMC free article] [PubMed] [Google Scholar]
- McFarlane I, Georgopoulou N, Coughlan CM, Gillian AM, and Breen KC (1999). The role of the protein glycosylation state in the control ofcellular transport of the amyloid beta precursor protein. Neuroscience 90, 15–25. [DOI] [PubMed] [Google Scholar]
- Miranda AM, Lasiecka ZM, Xu Y, Neufeld J, Shahriar S, Simoes S, Chan RB, Oliveira TG, Small SA, and Di Paolo G (2018). Neuronal lysosomal dysfunction releases exosomes harboring APP C-terminal fragments and unique lipid signatures. Nat. Commun 9, 291. [DOI] [PMC free article] [PubMed] [Google Scholar]
- Miyagi T, and Tsuiki S (1982). Purification and characterization of beta-galactoside (alpha 2 leads to 6)sialyltransferase from rat liver and hepatomas. Eur. J. Biochem 126, 253–261. [PubMed] [Google Scholar]
- Nakagawa K, Kitazume S, Oka R, Maruyama K, Saido TC, Sato Y, Endo T, and Hashimoto Y (2006). Sialylation enhances the secretion of neurotoxic amyloid-beta peptides. J. Neurochem 96, 924–933. [DOI] [PubMed] [Google Scholar]
- Powell AE, Wang Y, Li Y, Poulin EJ, Means AL, Washington MK, Higginbotham JN, Juchheim A, Prasad N, Levy SE, et al. (2012). The pan-ErbB negative regulator Lrig1 is an intestinal stem cell marker that functions as a tumor suppressor. Cell 149, 146–158. [DOI] [PMC free article] [PubMed] [Google Scholar]
- Quehenberger O,Armando AM, Brown AH, Milne SB, Myers DS, Merrill AH, Bandyopadhyay S, Jones KN, Kelly S, Shaner RL, et al. (2010). Lipidomics reveals a remarkable diversity of lipids in human plasma. J. Lipid Res 51, 3299–3305. [DOI] [PMC free article] [PubMed] [Google Scholar]
- Recchi MA, Hebbar M, Hornez L, Harduin-Lepers A, Peyrat JP, and Delannoy P (1998). Multiplex reversetranscription polymerase chain reaction assessment of sialyltransferase expression in human breast cancer. Cancer Res. 58, 4066–4070. [PubMed] [Google Scholar]
- Schultz MJ, Swindall AF, and Bellis SL (2012). Regulation ofthe metastatic cell phenotype by sialylated glycans. Cancer Metastasis Rev. 31, 501–518. [DOI] [PMC free article] [PubMed] [Google Scholar]
- Schultz MJ, Holdbrooks AT, Chakraborty A, Grizzle WE, Landen CN, Buchsbaum DJ, Conner MG, Arend RC, Yoon KJ, Klug CA, et al. (2016). The tumor-associated glycosyltransferase ST6Gal-I regulates stem cell transcription factors and confers a cancer stem cell phenotype. Cancer Res. 76, 3978–3988. [DOI] [PMC free article] [PubMed] [Google Scholar]
- Seales EC, Jurado GA, Brunson BA, Wakefield JK, Frost AR, and Bellis SL (2005). Hypersialylation of beta1 integrins, observed in colon adenocarcinoma, may contribute to cancer progression by up-regulating cell motility. Cancer Res. 65, 4645–4652. [DOI] [PubMed] [Google Scholar]
- Shaikh FM, Seales EC, Clem WC, Hennessy KM, Zhuo Y, and Bellis SL (2008). Tumor cell migration and invasion are regulated by expression of variant integrin glycoforms. Exp. Cell Res 314, 2941–2950. [DOI] [PMC free article] [PubMed] [Google Scholar]
- Shibata H, Toyama K, Shioya H, Ito M, Hirota M, Hasegawa S, Matsumoto H, Takano H, Akiyama T, Toyoshima K, et al. (1997). Rapid colorectal adenoma formation initiated by conditional targeting of the Apc gene. Science 278, 120–123. [DOI] [PubMed] [Google Scholar]
- Shimokawa M, Ohta Y, Nishikori S, Matano M, Takano A, Fujii M, Date S, Sugimoto S, Kanai T, and Sato T (2017). Visualization and targeting of LGR5+ human colon cancer stem cells. Nature 545, 187–192. [DOI] [PubMed] [Google Scholar]
- Swindall AF, and Bellis SL (2011). Sialylation ofthe Fas death receptor by ST6Gal-I provides protection against Fas-mediated apoptosis in colon carcinoma cells. J. Biol. Chem 286, 22982–22990. [DOI] [PMC free article] [PubMed] [Google Scholar]
- Tkach M, Kowal J, and Thery C (2018). Whythe need and howtoapproach the functional diversity of extracellular vesicles. Philos. Trans. R. Soc. Lond. B Biol. Sci 373, 20160479. [DOI] [PMC free article] [PubMed] [Google Scholar]
- van Niel G, D’Angelo G, and Raposo G (2018). Shedding light on the cell biology of extracellular vesicles. Nat. Rev. Mol. Cell Biol 19, 213–228. [DOI] [PubMed] [Google Scholar]
- Wang Y, Shi C, Lu Y, Poulin EJ, Franklin JL, and Coffey RJ (2015). Loss of Lrig1 leads to expansion of Brunner glands followed by duodenal adenomas with gastric metaplasia. Am. J. Pathol 185, 1123–1134. [DOI] [PMC free article] [PubMed] [Google Scholar]
- Willms E, Cabahas C, Mager I, Wood MJA, and Vader P (2018). Extracellular vesicle heterogeneity: subpopulations, isolation techniques, and diverse functions in cancer progression. Front. Immunol, 9, 738. [DOI] [PMC free article] [PubMed] [Google Scholar]
- Yang YP, Ma H, Starchenko A, Huh WJ, Li W, Hickman FE, Zhang Q, Franklin JL, Mortlock DP, Fuhrmann S, et al. (2017). A chimeric Egfr protein reporter mouse reveals Egfr localization and trafficking in vivo. Cell Rep. 19, 1257–1267. [DOI] [PMC free article] [PubMed] [Google Scholar]
- Zaborowski MP, Balaj L, Breakefield XO, and Lai CP (2015). Extracellular vesicles: composition, biological relevance, and methods of study. Bioscience 65, 783–797. [DOI] [PMC free article] [PubMed] [Google Scholar]
- Zhang H, Freitas D, Kim HS, Fabijanic K, Li Z, Chen H, Mark MT, Molina H, Martin AB, Bojmar L, et al. (2018a). Identification of distinct nanoparticles and subsets of extracellular vesicles by asymmetric flow field-flow fractionation. Nat. Cell Biol 20, 332–343. [DOI] [PMC free article] [PubMed] [Google Scholar]
- Zhang Q, Jeppesen DK, Higginbotham JN, Demory Beckler M, Poulin EJ, Walsh AJ, Skala MC, McKinley ET, Manning HC, Hight MR, et al. (2018b). Mutant KRAS exosomes alter the metabolic state of recipient colonic epithelial cells. Cell Mol. Gastroenterol. Hepatol 5, 627–629.e6. [DOI] [PMC free article] [PubMed] [Google Scholar]
- Zuo WL, Yang J, Gomi K, Chao I, Crystal RG, and Shaykhiev R (2017). EGF-amphiregulin interplay in airwaystem/progenitor cells linksthe pathogenesis of smoking-induced lesions in the human airway epithelium. Stem Cells 35, 824–837. [DOI] [PMC free article] [PubMed] [Google Scholar]
Associated Data
This section collects any data citations, data availability statements, or supplementary materials included in this article.