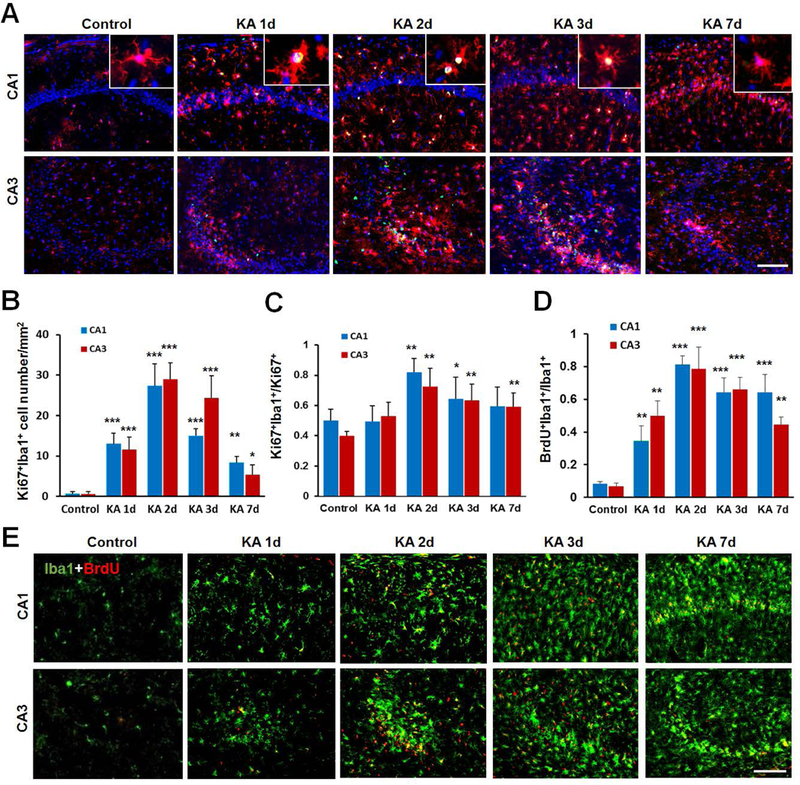
Figure 5. Microglia, but not monocytes, contribute to seizure-induced increase to the proliferating Iba1+ population.

A, Representative images of Ki67 (green) and Iba1 (red) immunostaining in the hippocampus CA1 and CA3 at different time points after KA injection. The enlarged panel shows co-localization of Ki67 immunostaining with Iba1+ microglia. B, The time course of Ki67 and Iba1 co-expressing cells, which peaks at day 2 after KA injection. n = 5 mice for each group. C, Shown is the percentage of Ki67+:Iba1+ cells among total Ki67+ cells at different time points after KA injection. n = 5 mice for each time point. D, E, Representative images and quantification showing co-localization of BrdU (red) and Iba1 (green) in the hippocampus at different time following KA injection. BrdU (i.p., 100 mg/kg, 2 pulses/day) was applied immediately after KA treatment. n =5 mice for each time point. *p<0.05, **p<0.01, ***p<0.001, versus control. Scale bar = 100 μm.
