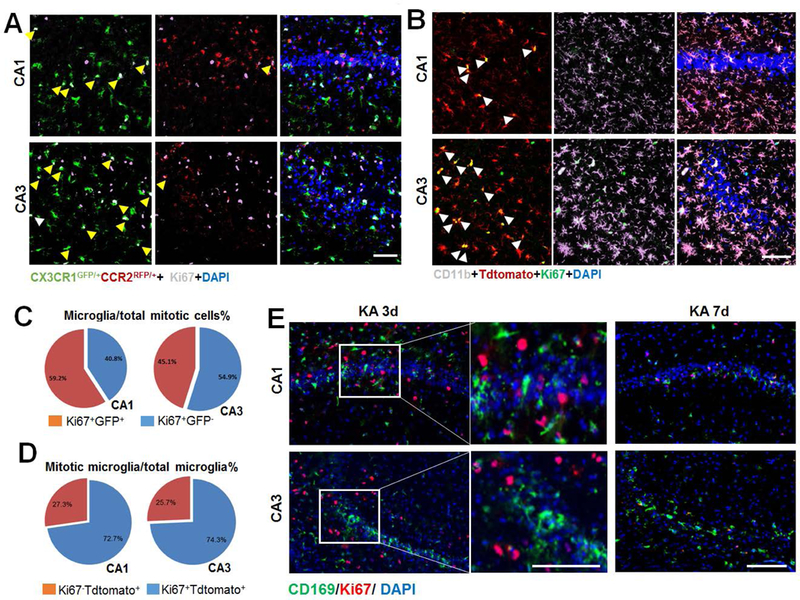
Figure 6. Microglial proliferation predominates seizure induced microgliosis.

A, Representative images of Ki67 immunostaining in the hippocampus at 3d after KA injection in double transgenic CX3CR1GFP/+:CCR2RFP/+ mice. Arrows denote co-localization of Ki67 (white) immunostaining with GFP+ resident microglia. Note, no Ki67 immunostaining co-localized with RFP+:GFP- infiltrated monocyte. Scale bar = 50 μm. B, Representative images of the hippocampus showing the co-localization of Ki67 (green) and tdTomato+ (red)(white arrow) at day 2 following KA treatment in CX3CR1creER/+:R26tdTomato/+ reporter mice. Note, tdTomato-CD11b+ cells do not express Ki76. Scale bar = 50 μm. C, The percentage of Ki67+:GFP+ cells among total Ki67+ cells per mm2 at KA 3d in CX3CR1GFP/+:CCR2RFP/+ mice. n = 4. D, The percentage of Ki67+:tdTomato+ cells among total tdTomato+ cells per mm2 at KA 2d in CX3CR1creER/+:R26tdTomato/+ reporter mice. n= 4. E, Representative images of Ki67 (red) and CD169 (green) immunostaining in the hippocampus at 3d and 7d after KA treatment in WT mice. n = 5 mice for each time point. Scale bar = 100 μm.
