

Abstract
Introduction
Primary HIV infection (PHI) is the initial phase after HIV acquisition characterized by high viral replication, massive inflammatory response and irreversible immune-damage, particularly at the gastrointestinal level. In this study we aimed to characterize the dynamics of gastrointestinal damage biomarkers during the different phases of HIV infection and assess their association with HIV-disease markers and their accuracy to differentiate PHI from chronic HIV infection (CHI).
Methods
PHI-individuals (n = 57) were identified as HIV-seronegative/HIV-RNA positive and were followed up for one year at the Manhiça District Hospital in Mozambique. Ten plasma and 12 stool biomarkers were quantified by Luminex or ELISA and levels were compared to CHI-naive (n = 26), CHI on antiretroviral-treatment (ART; n = 30) and HIV-uninfected individuals (n = 58). Regression models adjusted by time point were used to estimate the association of the biomarkers with HIV-disease markers. Receiver operating curves were compared for the best accuracy to distinguish PHI from CHI.
Results
Soluble (s)CD14 was significantly associated with the CD4/CD8 ratio (P < 0.05) and viremia levels (P < 0.0001) during PHI. Plasma zonulin and stool lactoferrin were significantly higher in PHI as compared to CHI-individuals (P < 0.05). Plasma zonulin demonstrated the best accuracy to identify PHI among HIV-infected individuals (AUC = 0.85 [95% CI 0.75–0.94]). Using a cutoff value of plasma zonulin ≥ 8.75 ng/mL the model identified PHI with 87.7% sensitivity (95% CI 76.3–94.9) and 69.2% specificity (95% CI 48.2–85.7). An adjusted multivariate model including age, plasma zonulin and sCD14 further increased the classification performance (AUC = 0.92 [95% CI 0.86–0.99]).
Conclusions
While the stool biomarkers did not provide any predictive ability to distinguish PHI from CHI-individuals, plasma sCD14 and zonulin were significantly associated with HIV-disease markers and PHI identification, respectively. These inflammatory biomarkers may be useful to monitor changes in gastrointestinal integrity during HIV infection.
Introduction
The initial phase after human immunodeficiency virus (HIV) acquisition, usually referred as primary HIV infection (PHI), is characterized by high virus replication and a progressive appearance of HIV-specific antibodies that define seroconversion [1,2]. During PHI there is a massive inflammatory response, an irreversible immune-damage and commonly, a transient febrile illness [3–6]. At this early stage, HIV induces a large depletion of mucosal CD4 memory T cells, particularly in the gut-associated lymphoid tissue (GALT) [7,8]. This depletion is accompanied by a mucosal inflammation and a deregulation of the epithelial barrier maintenance and digestive/metabolic functions [9], resulting in an enteropathy that continues throughout the entire disease course in the absence of antiretroviral-treatment (ART) [7].
Inflammatory Bowel Diseases (IBD) such as Crohn’s and Ulcerative colitis also severely impact the GALT. Many clinical and pathological manifestations of IBD are absent from HIV such as ulceration, colon friability or bleeding. However, both diseases lead to GI tract abnormalities such as immune activation, inflammation, histological-damage including villous atrophy and crypt hyperplasia, decreased absorption, increased intestinal permeability and microbial imbalance [9–17]. Many of these gut specific changes have translated into the identification of diagnostic and prognosis biomarkers for active IBD, including biomarkers of neutrophil and eosinophil activation, innate immunity and intestinal permeability [18–21]. Although plasma biomarkers [1,22–25] and stool microbiota [26,27] have been widely described in HIV-infected patients; to our knowledge, stool biomarkers of GI inflammation and damage have not been characterized during the different phases of HIV-infection.
Retaining GALT integrity and maintaining low immune activation has been suggested to protect the host from continued CD4 T-cell depletion and progression to AIDS [1,28–30]. Thus, understanding the dynamics of GI-damage biomarkers during PHI may reveal specific changes in expression patterns of biomarkers which can be used as indicators of diseases progression at an early stage. In addition, since these biomarkers might differ between PHI and chronic HIV infection (CHI), we hypothesized that one or more might serve as an incidence biomarker. Indeed, accurate cross sectional estimates of HIV incidence of new infections are critical for planning and evaluating the success of HIV interventions. In 2011 the WHO/UNAIDS Incidence Assay Critical Path Working Group set criteria for discovery of new biomarkers that could improve upon the existing cross sectional serological-based HIV incidence assay, which is dependent on antibody titers found to be severely impaired after ART treatment [31].
This study thus sought to characterize the kinetics of minimally-invasive inflammation biomarkers during the first year of HIV infection, assess their association with HIV-disease markers and determine their predictive capacity as incidence biomarkers.
Materials and methods
Ethics statement
This study was approved by local institutional review boards at Barcelona Clinic Hospital (2011/6264) and by the Ministry of Health of Mozambique (461/CNBS/12). All methods were carried out in accordance with the relevant guidelines and regulations. Written informed consent was obtained from all subjects (both HIV-infected and HIV-uninfected subjects) prior to participation.
Study population
The study population was enrolled between April 2013 and November 2014 at the Manhiça District Hospital (MDH) in Manhiça, Southern Mozambique. All study participants were over 18 years old and residents of the District Surveillance System (DSS) study area. The present analysis is a sub-study of a prospective cohort of primary HIV-infected adults enrolled and followed up for 12 months. The current study population is thus a convenience sample, nested in the Gastro-intestinal biomarkers in acute-HIV infected Mozambican adults study (GAMA) [32–34].
HIV diagnosis and clinical follow up
During the screening, subjects presenting to the outpatient clinic of MDH for non-specific febrile symptoms or voluntary HIV counseling and testing were included in the PHI group if they were negative or indeterminate for rapid test serology and HIV-RNA positive for pooled-viral load (VL) testing, according to the screening profile previously characterized [32]. A control population was established by random selection among HIV-uninfected and individuals were invited to attend a study visit 1 month after the screening date [32]. PHI individuals enrolled were followed up at seven consecutive visits 1, 2, 3, 4, 6, 9 and 12 months after the screening visit and left the study when they reached criteria for ART initiation according to the current national guidelines [32,33]. CHI patients were included in the CHI-naïve (n = 26) or the CHI-ART (n = 30) as previously described [33], if they had previously initiated treatment, mostly based on a zidovudine/lamivudine/nevirapine regimen. Technical information and procedures regarding HIV diagnosis, clinical follow up, microbiological evaluation, HIV-specific antibody determination and biomarker quantification have been described in detail previously [32–34].
Staging of primary HIV infection and quantification of biomarkers
VL and Western Blot HIV-serology at screening visit were employed to categorize PHI individuals into Fiebig stages as described in previous work [32,33,35]. Visit time points were shifted according to estimated days-post infection by Fiebig stage to approximate similar time since infection during PHI [33,35–37].
Multiplex biomarker profiling was performed for a total of 10 GI-damage biomarkers in plasma samples: interleukin (IL)-17, vascular endothelial growth factor (VEGF), fatty acid-binding protein 2 (FABP2), lipopolysaccharide binding protein (LBP), soluble (s)CD14, zonulin, endogenous endotoxin core antibodies (EndoCAb) IgG, EndoCAb IgM, anti-Saccharomyces cerevisiae antibodies (ASCA) immunoglobulin (Ig)A and IgG; and 12 in stool samples: claudin3, calprotectin, PMN-elastase, zonulin, eosinophil protein X/eosinophil derived neurotoxin (EPX/EDN), stool human ß-Defensin 2 (HBD2), secretory IgA α1–antitrypsin, S100A12, lactoferrin, ASCA and perinuclear antineutrophil cytoplasmic antibodies (pANCA). Determinations in plasma samples were performed in Barcelona laboratories by ELISA commercial assays or Luminex technology as previously described [32–34]. Determinations in stool samples were performed in Essen facilities by ELISA commercial assays according to the manufacturer’s instructions for claudin3, calprotectin, PMN-elastase, zonulin, EDN/EPX, HBD2, secretory IgA, α1–antitrypsin and S100A12 (Immundiagnostik, Bensheim, Germany); lactoferrin, ASCA and pANCA (TechLab, Blacksburg, USA), as regularly performed for IBD diagnosis or prognosis. Overflow and under limit of detection values for every biomarker was standardized as the double and the half of the detection limit, respectively [38].
Statistical analysis
Proportions were compared using chi-square test. Group comparisons for biomarker levels were performed using the nonparametric Kruskal-Wallis test. Individual comparisons between the different groups were performed using posthoc pairwise comparisons with the Tukey and Kramer (Nemenyi) test. Individual and group comparisons of left-censored data were performed using Peto-Peto test with Holm adjust for multiple comparisons. Spearman’s correlation was used to assess the strength of relationship between zonulin levels in plasma and stool. Differences or correlations were considered significant if P < 0.05.
Relative changes (Z-score) with respect to the HIV-uninfected group were represented by a transformation of the fitted longitudinal models by subtracting the mean and dividing by the standard deviation of HIV-non infected distribution, after a logarithmic transformation in the cases where it was required in order to correct non-normal distributions. Biomarker values, VL and the CD4/CD8 ratio were always log transformed for a better adjustment of skewed data. Mixed-effects models adjusted by visit time point were used to estimate the effect of the biomarker levels on HIV-disease markers, including: the CD4/CD8 ratio, VL and on the report of an intestinal-complaint, defined as diarrhea, vomiting or stomach pain.
The ability of each biomarker's first determination to distinguish between PHI patients and CHI-naïve was assessed via logistic regression models. A multivariate model was constructed using backward step-wise selection and including sex, age, VL and the biomarkers with an inclusion criterion of P < 0.05 in the univariate analysis. Receiver operating curves (ROC) curves from univariate and adjusted-multivariate models were compared for the best prediction [39]. Optimal threshold was determined through maximization of the nearest to (0,1) method. The level of agreement between the classification methods was assessed by the κ-statistic [40].
Data was analyzed using R-3.3.1 software (R Core Team 2016) and Stata Statistical Software: Release 15 (StataCorp 2017. College Station, TX).
Results
Characteristics of the study population
Of the 57 PHI patients identified during the screening process [32,33], 40 individuals attended a follow-up 1 month later as previously described [33]. Fifteen-percent of follow up visits lacked a stool sample. There were no significant differences in age or HIV-RNA VL between PHI patients that provided stool sample and those that did not along the study visits. However, there was a significantly higher proportion of females compared to males that provided stool samples along the study visits (91% vs 75% in females and males respectively, P = 0.007). Table 1 summarizes demographic and clinical characteristics of the study population.
Table 1. Clinical and demographic characteristics of study population according to HIV-status.
| 1st follow-up visit PHI (n = 40) | HIV-uninfected (n = 58) | CHI-naive (n = 26) | CHI-ART (n = 30) | P-value | |
|---|---|---|---|---|---|
| Age (years) [Mean (SD)] | 27.2 (9.2) | 27.9 (9.5) | 38.2 (13.4) | 42.9 (8.8) | 0.0001** |
| Gender [F (%)] | 24 (60.0%) | 46 (79.3%) | 19 (73.1%) | 19 (63.3%) | 0.162ᵡ |
| Intestinal infection [n (%)] | 6 (15.0 %) | 11 (19.0%) | 2 (7.7%) | 3 (10.0%) | 0.552ᵡ |
| Intestinal complaint last week [n (%)] | 12 (30.0%) | 15 (25.9%) | 4 (15.4%) | 2 (6.7%) | 0.067ᵡ |
| Viral Load (RNA Log 10 copies/mL) [Median (IQR) | 5.00 (4.48–5.43) | - | 4.51 (3.94–4.90) | - | 0.0117 * |
| CD4/CD8 ratio [Median (IQR)] | 0.47 (0.30–0.71) | 1.64 (1.26–2.32) | 0.58 (0.41–0.91) | 0.58 (0.39–0.87) | 0.0001** |
Comparisons for proportions were performed by chi2 testᵡ and continuous variables by Mann and Whitney U-test* for the two group comparison and global comparison by Kruskal Wallis test**. SD, standard deviation; F, females; IQR, interquartile range; PHI, primary HIV infection; CHI, chronic HIV infection; CHI-ART, CHI on antiretroviral-treatment. Intestinal infection includes positive result for bacterial, parasite or protozoa testing in stool sample according to the methodology previously described [33].
Kinetics of the GI biomarkers during the different stages of HIV infection
Biomarker concentrations by study group are summarized in S1 Table. Biomarker dynamics during PHI were analyzed according to level of expression as well as their relative changes with respect to the levels in the HIV-uninfected group (Fig 1). From the total of 22 biomarkers assessed, plasma VEGF and IL-17 were not quantifiable in more than 75% of the samples and were excluded from the analysis. Levels of stool claudin3 were too low to be comparable between groups and were also excluded from the analysis (S1 Table).
Fig 1. Dynamics of plasma and stool intestinal damage biomarkers during primary HIV-infection (PHI).
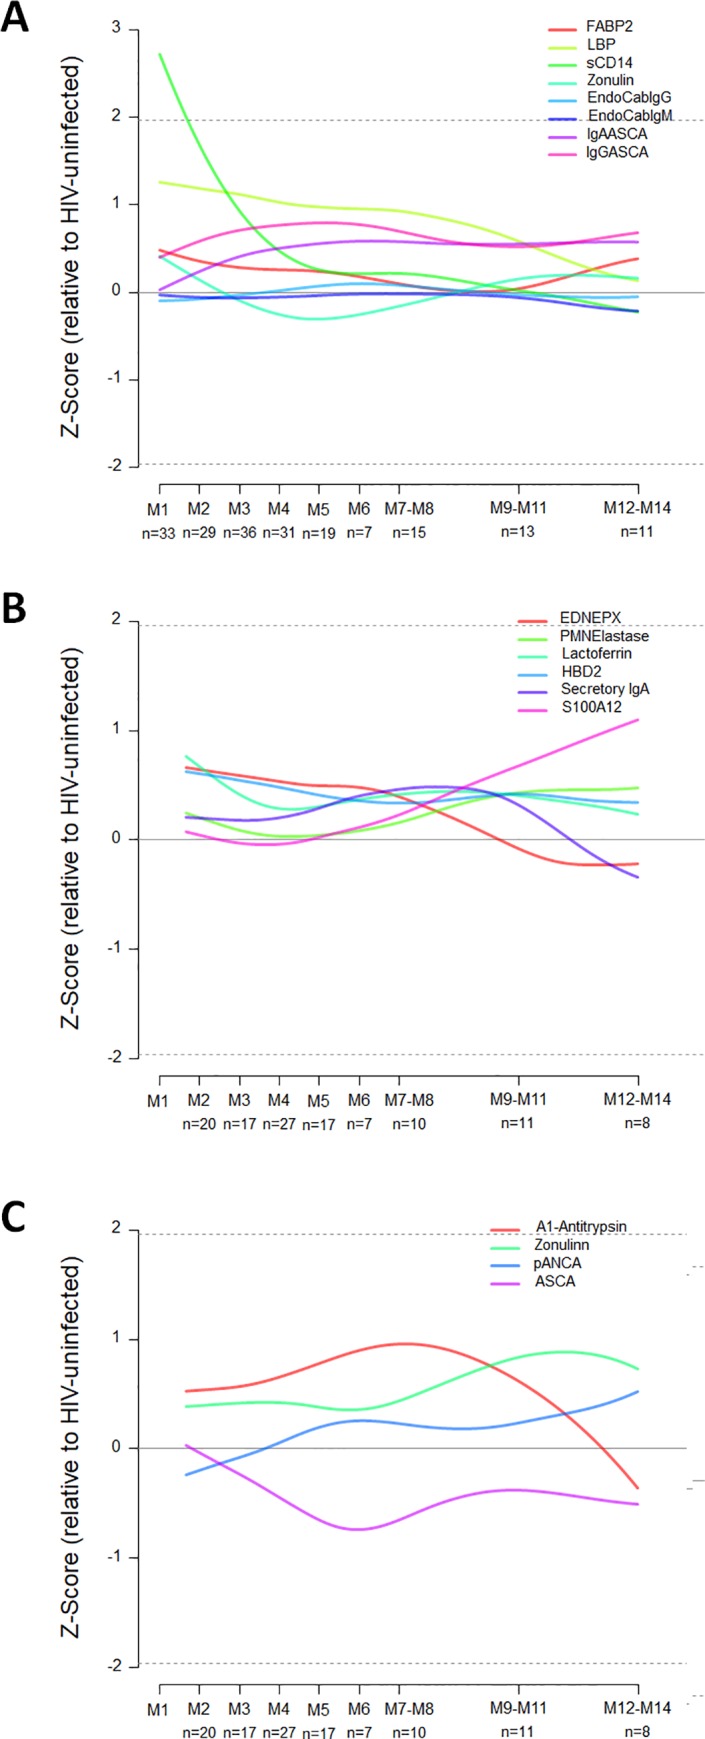
Dynamics of plasma biomarkers associated with intestinal damage (A) and dynamics of stool biomarkers associated with innate immunity (B) and intestinal permeability (C) are shown. Relative changes (Z-score) of the biomarker levels during PHI with respect to the HIV-uninfected group have been represented by a transformation of the fitted longitudinal models after subtracting the mean and dividing by the standard deviation of HIV-non infected distribution. Values were logarithmic transformed in the cases where it was required to correct non-normal distributions.
At 2 months post-infection (M2), plasma sCD14 showed the most significant fold difference compared to HIV-uninfected individuals (P < 0.0001, Fig 1A), followed by plasma LBP and ASCA IgG (P = 0.0025 and P = 0.0159, Fig 1A). Stool lactoferrin showed a significant increase at M2 as compared to HIV-uninfected individuals (P = 0.0149, Fig 1B) while there was no significant difference for any of the intestinal permeability stool biomarkers (Fig 1C). Results from the comparison between study groups are summarized in S2 Table.
Comparing biomarker levels at the earliest PHI time point with those in CHI, plasma zonulin was expressed at significantly higher levels at M2 as compared to both CHI-naïve and CHI-ART individuals (P = 0.0006 and P < 0.0001, respectively; Fig 2A) followed by lactoferrin (P = 0.0257 and P = 0.0066, respectively; Fig 2B). Comparing biomarker levels between CHI and HIV-uninfected individuals, plasma sCD14 and stool and plasma zonulin showed significant differences (S2 Table). However, there was no significant correlation between plasma and stool zonulin levels in any of the study groups. Indeed, both CHI groups had significantly higher stool zonulin (Fig 2C) and significantly lower plasma zonulin as compared to HIV-uninfected individuals.
Fig 2. Dynamics of highly significant biomarkers comparing chronic HIV infection (CHI) with PHI and HIV-uninfected individuals (Ctrl).

Characterization of plasma zonulin (A), stool lactoferrin (B), stool zonulin (C) and stool calprotectin (D) across different study groups and along time post-HIV-infection. M, months after HIV infection. Box as interquartile range (IQR), middle line as median, whiskers as maximum and minimum, dots as individual observations. Individual comparisons between different groups were performed using posthoc pairwise comparisons with Tukey and Kramer (Nemenyi) test (A, B and C). Individual comparisons of left-censored data were performed using Peto-Peto test with Holm adjust for multiple comparisons (D). Comparisons with PHI group were performed considering the biomarker level at 2-months post-HIV-infection (M2). Significance is indicated as *** if P < 0.001, ** if P < 0.01, and * if P < 0.05.
Stool calprotectin was only quantifiable in 45% of the samples of the HIV-uninfected group so its relative change could not be estimated and it was considered left-censored data and analyzed as such as described in methods. All groups of HIV infected individuals showed significantly higher values of stool calprotectin than HIV-uninfected (P < 0.0001), however there were no significant differences in calprotectin levels between PHI and CHI individuals (Fig 2D).
Association of GI biomarkers with surrogates of HIV disease outcomes
Among PHI or CHI-individuals, there was no significant difference in the median levels of the GI-damage biomarkers between the individuals tested positive for any of the intestinal infection assessed and those that did not.
After evaluation by separate mixed-effect regression models adjusted by time point, sCD14 was the only biomarker showing significant association with the CD4/CD8 ratio or viremia levels during the course of PHI. sCD14 was negatively associated with the CD4/CD8 ratio (P = 0.0402) in PHI-individuals independent of the time point. Each 25% increase in the levels of sCD14 was associated with a 0.83 (95% confidence interval [CI] 0.69–0.99) proportional decrease in the CD4/CD8 ratio. On the other hand, sCD14 was positively associated with VL (P < 0.0001) in PHI-individuals. Each 25% increase in the levels of sCD14 was associated with a 2.12 (95% CI 1.69–2.66) proportional increase in the VL levels.
When assessing correlation with self-reported intestinal complaint, HBD2 was significantly and negatively associated during the first year of HIV-infection (P = 0.0378). A 25% decrease in the levels of stool HBD2 provided an odds ratio of 1.52 (95% CI 1.02–2.27) for self-reported intestinal complaint.
Evaluation of GI-biomarker accuracy to differentiate primary from chronic HIV infection
In order to assess the capacity of biomarker levels to discriminate between PHI and CHI-naïve individuals, univariate logistic regression models were tested as described in methods. Of the 22 biomarkers tested, plasma zonulin, sCD14, ASCA IgA, EndoCAb IgM and stool secretory IgA showed a significant association with PHI (P < 0.05). According to previous definition [41], ROC analysis of the univariate models from these biomarkers revealed that plasma zonulin had a good classification performance for distinguishing PHI (area under the curve [AUC] = 0.85 {95% CI 0.75–0.94}; Fig 3), while plasma sCD14 showed a fair accuracy (AUC = 0.73 [95% CI 0.62–0.84]), ASCA IgA and endoCAb IgM showed a poor accuracy for PHI identification (AUC = 0.68 [95% CI 0.54–0.81] and AUC = 0.65 [95% CI 0.53–0.77], respectively; Fig 3) and stool secretory Ig A failed to show an acceptable predictive accuracy (AUC = 0.56 [95% CI 0.38–0.74]).
Fig 3. Biomarkers with the best predictive ability to differentiate PHI from CHI-naïve individuals.

The ability of each biomarker's first determination to distinguish between PHI patients and CHI-naïve was assessed via logistic regression models. Receiver operating curves (ROC) curves from univariate models were compared for the best prediction. Optimal threshold was determined through maximization of the nearest to (0,1) method. Sensitivity as true positive rate and Specificity as true negative rate. AUC as area under the curve.
An adjusted multivariate model including age, plasma zonulin and sCD14 according to the formula [score = -10.81–0.08 age + 10.28 log10 (zonulin) + 10.70 log10(sCD14)] further increased the classification performance (AUC = 0.92 [95% CI 0.86–0.99]; Fig 4A). For the univariate zonulin model, a cutoff value of plasma zonulin ≥ 8.75 ng/mL was able to identify PHI with 87.7% sensitivity (95% CI, 76.3–94.9) and 69.2% specificity (95% CI, 48.2–85.7; Fig 4B). In the multivariate model, a cut-off score of ≥ 0.56 provided the same sensitivity of 87.7% (95% CI, 76.3–94.9) but a higher specificity of 88.5% (95%CI 69.8–97.6; Fig 4B). Thus both models correctly identified 50/57 PHI-individuals but differed in their identification of CHI-naïve individuals. The zonulin-based univariate and multivariate models correctly classified 18/26 and 23/26 CHI-naïve individuals, respectively (Fig 4C). Consequently, univariate and multivariate classification methods showed a substantial level of agreement for PHI detection with kappa-statistic of 0.67 (95%CI 0.50–0.84).
Fig 4. Performance of univariate and multivariate biomarkers models in predicting primary HIV infection.

A) Comparison between ROC curves for plasma zonulin univariate model and multivariate model adjusted by age, plasma zonulin and plasma sCD14. AUC as area under the curve. B) Cut-off values for plasma zonulin univariate model (ng/mL) and multivariate model (score) with their respective sensitivity and specificity values. C) Prediction of plasma zonulin univariate model with a cutoff of ≥ 8.75 ng/mL was compared to that of the multivariate model with a score cutoff of ≥ 0.56.
Discussion
In this study we described the dynamics of plasma and stool GI-damage biomarkers and their association with HIV-disease markers during the first year of HIV-infection. We found that higher plasma sCD14 was significantly associated with increased VL and decreased CD4/CD8 ratio during PHI, whereas lower stool HBD2 was significantly associated with self-reported intestinal complaints. In addition, assessing these biomarkers as indicators of HIV-recency, plasma zonulin demonstrated a good classification performance identifying 87.7% of the PHI and 69.2% of the CHI-individuals in our cohort.
Among the GI-damage biomarkers assessed, plasma sCD14 showed the most significant increase in the early stages of HIV-infection as compared to HIV-uninfected individuals. We additionally found that higher plasma sCD14 levels during the first year of infection were associated with higher viremia levels and lower CD4/CD8 ratios, immunological variables that at set point have been previously reported to be surrogates of disease progression and mortality [42]. Indeed, sCD14 is a marker of acute phase response and/or monocyte activation and previous studies have reported that higher plasma sCD14 levels during PHI predict rapid HIV-progression [43,44]. However, this biomarker also binds to lipopolysaccharides in plasma [45] and thus has been employed as a surrogate of microbial translocation. Several studies have shown that plasma levels of sCD14 are involved in the immunopathogenesis of HIV infection [46] and are an independent predictor of morbidity [47] and mortality [30,48] among CHI-patients. Plasma EndoCab IgM, a surrogate of lipopolysaccharide, was also associated with PHI but performed more poorly than sCD14 in predicting PHI, suggesting that both viral-induced monocyte activation, reflected by sCD14, and microbial translocation, reflected by Endocab IgM, may occur at early stages. However, we were unable to determine whether sCD14 association with markers of HIV-disease was solely a consequence of early innate immune activation or an indicator of microbial translocation. Measurements of the sCD14 bacterial 16S DNA and plasma lipopolysaccharides kinetics during the different stages of HIV infection would be useful to shed light on the crucial processes that characterize HIV-inflicted immune and GI damage.
The stool biomarkers described in this manuscript were those generally used in the diagnosis and management of IBD-patients [18,19]. Calprotectin and lactoferrin, both markers of neutrophil activation, are the most commonly used fecal markers for intestinal inflammation in IBD [21,49]. In our study, stool lactoferrin was significantly increased in patients at 2 months post-HIV-infection as compared to HIV-uninfected individuals and normalized in the CHI-individuals. This increase was also observed for stool calprotectin, however, in this case, levels did not normalize in the CHI. Since intestinal epithelial-damage is irreversible in untreated HIV-infected individuals [5,6], elevated calprotectin levels during PHI and CHI may be a consequence of the continued GI-damage. Indeed, a previous study in HIV-infected ART-naive individuals found elevated fecal calprotectin levels in half of the patients regardless of stage [11]. On the other hand, decreased level of stool lactoferrin in CHI individuals suggests that its presence in stool during PHI may more closely reflect acute inflammation rather than advanced intestinal-damage. In order to shed light on the role and timing of these GI-damage biomarkers, future studies should asses their expression in plasma and stool along with gut biopsies at different stages of HIV infection.
Despite the association described between stool biomarkers and disease flares in IBD-patients [18,19], no significant associations were found between stool IBD-biomarker and markers of HIV-disease such as VL or CD4/CD8 ratio during PHI. We did observe an association between lower stool HBD2 levels during the first year of HIV infection and self-reported intestinal complaints. HBD2 is an antimicrobial peptide secreted by diverse epithelial cells, including intestinal epithelial cells, after an infection or during inflammatory process in chronic diseases such as IBD [50,51]. The massive GALT destruction produced during PHI [7,8] leads to increased apoptosis in the GI epithelial cells producers of HBD2 [52]. HBD2 levels tended to be higher in both CHI and PHI during the first year post-infection as compared to HIV-uninfected individuals. Thus, the etiology of the association between lower HBD2 levels and self-reported intestinal complaints in PHI individuals is likely to be multifactorial and may be affected by the presence of other Gl infections or the massive inflammatory response triggered after HIV-infection.
Although some stool IBD-biomarkers were differentially expressed between PHI and CHI, they did not provide sufficient predictive ability to identify PHI. Plasma zonulin demonstrated the best accuracy to distinguish PHI from CHI-naïve individuals. Since some biomarker levels have been previously described to be affected by age [53,54], gender [55] or VL [23,25,34], these covariates were also considered in the construction of a multivariate model. The resulting multivariate model retained plasma zonulin and sCD14 together with age. The significantly higher age in the CHI-naïve individuals in our cohort as compared to the PHI likely explains age as a covariate [33]. This multivariate model slightly increased the model specificity but showed a substantial agreement in the classification performance with respect to the univariate model. These models showed a moderate accuracy and high uncertainty in the performance of plasma zonulin to distinguish PHI from CHI, thus hampering its use as a simple HIV incidence assay as compared to existing robust serological tests [56,57]. Further studies combining plasma zonulin with additional inflammatory biomarkers or HIV-specific antibody subtypes might improve the model performance for PHI identification and HIV-incidence estimations. Zonulin is a protein expressed by viable gut epithelial cells that modulates the permeability of tight junctions between cells of the wall of the digestive tract and its release has been documented to be triggered by small intestinal exposure to bacteria and gliadin [58]. It is uncertain why plasma zonulin levels were significantly lower in CHI-individuals, but greater gut epithelial cell death or malfunction during AIDS might decrease its expression. These findings are in line with previous studies that reported a strong association between plasma zonulin levels and mortality in HIV-infected individuals, even after adjustment for proximal CD4 T-cell count [48].
As a limitation from the study design, data for the stool biomarkers was not available at the first month of infection. This would have allowed a further characterization of the earliest responses at the GI-level simultaneous to the massive CD4-T cell destruction in the GALT [7,8]. Similarly, the loss to follow-up along the longitudinal visits may have resulted in insufficient power to detect associations. Additionally, the high burden of GI-infections prevalent in the study area could have impacted the biomarker dynamics and expression levels. We did not observe any significant difference in the biomarker levels according to the GI-infection status in the HIV-infected individuals. However, due to sample size restrictions, the presence of blood in stool, the detection of a GI protozoa or a bacterial infection were equally considered as positive results for GI-infection [33]. Future studies should evaluate the specific effect that different GI-infections could have on the dynamics of these biomarkers during HIV infection.
In conclusion, our results do not support the hypothesis that stool IBD-biomarkers can be used as surrogates of HIV-disease progression or to identify PHI among HIV-infected individuals. However, we found that higher plasma sCD14 was significantly associated with increased viremia levels and more compromised immune system during PHI. Our results also point to stool lactoferrin, calprotectin and zonulin as potential indicators of different GI pathogenic events following GALT destruction and inflammation during PHI.
Supporting information
(DOCX)
(DOCX)
Acknowledgments
The authors are grateful for the continued support of the clinical staff at the Manhiça District Hospital, as well as the study staff working exhaustively at the Centro de Investigaçao de Saúde de Manhiça (CISM). We also thank Erica Parker and Laura Fuente-Soro for their participation in patient recruitment and data collection in the field and Laura Puyol and Helder Bulo for their contribution to laboratory coordination between partner institutions. The authors are particularly grateful to all study participants. ISGlobal, IrsiCaixa and IGTP are members of the CERCA Programme, Generalitat de Catalunya.
Data Availability
The minimum dataset underlying the results of this study are available upon request due to ethical restrictions imposed by the Ministry of Health of Mozambique ethics review board. Public sharing of the data would breach the ethics review board’s data transfer agreement (DTA). Additionally, the data contains personal identifiers and sensitive information regarding HIV infection and treatment, as well as other infections. Interested researchers may contact Denise Naniche at denise.naniche@isglobal.org or llorenc.quinto@isglobal.org with their proposed analysis.
Funding Statement
This work was supported by The Spanish Ministry of Science (Mineco; http://www.mineco.gob.es/) [SAF-2011-27901] to [DN]; Bill and Melinda Gates Foundation (https://www.gatesfoundation.org/) [OPP1068252] to [DN] and The Institute of Health Carlos III (ISCIII; http://www.isciii.es/) [FI12/00096] to [LP]. The funders had no role in study design, data collection and analysis, decision to publish, or preparation of the manuscript.
References
- 1.McMichael AJ, Borrow P, Tomaras GD, Goonetilleke N, Haynes BF. The immune response during acute HIV-1 infection: clues for vaccine development. Nat Rev Immunol. Nature Publishing Group; 2010;10: 11–23. 10.1038/nri2674 [DOI] [PMC free article] [PubMed] [Google Scholar]
- 2.Cohen MS, Gay CL, Busch MP, Hecht FM. The detection of acute HIV infection. J Infect Dis. Oxford University Press; 2010;202 Suppl: S270–7. 10.1086/655651 [DOI] [PubMed] [Google Scholar]
- 3.Robb ML, Eller LA, Kibuuka H, Rono K, Maganga L, Nitayaphan S, et al. Prospective Study of Acute HIV-1 Infection in Adults in East Africa and Thailand. N Engl J Med. 2016;374: 2120–2130. 10.1056/NEJMoa1508952 [DOI] [PMC free article] [PubMed] [Google Scholar]
- 4.Kløverpris HN, Kazer SW, Mjösberg J, Mabuka JM, Wellmann A, Ndhlovu Z, et al. Innate Lymphoid Cells Are Depleted Irreversibly during Acute HIV-Infection in the Absence of Viral Suppression. Immunity. 2016;44: 391–405. 10.1016/j.immuni.2016.01.006 [DOI] [PMC free article] [PubMed] [Google Scholar]
- 5.Ananworanich J, Schuetz A, Vandergeeten C, Sereti I, de Souza M, Rerknimitr R, et al. Impact of Multi-Targeted Antiretroviral Treatment on Gut T Cell Depletion and HIV Reservoir Seeding during Acute HIV Infection. Emery S, editor. PLoS One. Public Library of Science; 2012;7: e33948 10.1371/journal.pone.0033948 [DOI] [PMC free article] [PubMed] [Google Scholar]
- 6.Schuetz A, Deleage C, Sereti I, Rerknimitr R, Phanuphak N, Phuang-Ngern Y, et al. Initiation of ART during Early Acute HIV Infection Preserves Mucosal Th17 Function and Reverses HIV-Related Immune Activation. PLoS Pathog. 2014;10 10.1371/journal.ppat.1004543 [DOI] [PMC free article] [PubMed] [Google Scholar]
- 7.Douek DC, Roederer M, Koup RA. Emerging concepts in the immunopathogenesis of AIDS. Annu Rev Med. 2009;60: 471–84. 10.1146/annurev.med.60.041807.123549 [DOI] [PMC free article] [PubMed] [Google Scholar]
- 8.Brenchley JM, Schacker TW, Ruff LE, Price DA, Taylor JH, Beilman GJ, et al. CD4+ T Cell Depletion during all Stages of HIV Disease Occurs Predominantly in the Gastrointestinal Tract. J Exp Med J Exp Med @BULLET. 2004;200: 749–759. 10.1084/jem.20040874 [DOI] [PMC free article] [PubMed] [Google Scholar]
- 9.Sankaran S, George MD, Reay E, Guadalupe M, Flamm J, Prindiville T, et al. Rapid onset of intestinal epithelial barrier dysfunction in primary human immunodeficiency virus infection is driven by an imbalance between immune response and mucosal repair and regeneration. J Virol. American Society for Microbiology (ASM); 2008;82: 538–45. 10.1128/JVI.01449-07 [DOI] [PMC free article] [PubMed] [Google Scholar]
- 10.Swidsinski A, Ladhoff A, Pernthaler A, Swidsinski S, Loening-Baucke V, Ortner M, et al. Mucosal flora in inflammatory bowel disease. Gastroenterology. 2002;122: 44–54. Available: http://www.ncbi.nlm.nih.gov/pubmed/11781279 [DOI] [PubMed] [Google Scholar]
- 11.Gori A, Tincati C, Rizzardini G, Torti C, Quirino T, Haarman M, et al. Early Impairment of Gut Function and Gut Flora Supporting a Role for Alteration of Gastrointestinal Mucosa in Human Immunodeficiency Virus Pathogenesis. J Clin Microbiol. 2008;46: 757–758. 10.1128/JCM.01729-07 [DOI] [PMC free article] [PubMed] [Google Scholar]
- 12.Sokol H, Lay C, Seksik P, Tannock GW. Analysis of bacterial bowel communities of IBD patients: What has it revealed? Inflamm Bowel Dis. 2008;14: 858–867. 10.1002/ibd.20392 [DOI] [PubMed] [Google Scholar]
- 13.Caradonna L, Amati L, Magrone T, Pellegrino NM, Jirillo E, Caccavo D. Enteric bacteria, lipopolysaccharides and related cytokines in inflammatory bowel disease: biological and clinical significance. J Endotoxin Res. 2000;6: 205–14. Available: http://www.ncbi.nlm.nih.gov/pubmed/11052175 [PubMed] [Google Scholar]
- 14.Kamat A, Ancuta P, Blumberg RS, Gabuzda D. Serological markers for inflammatory bowel disease in aids patients with evidence of microbial translocation. PLoS One. 2010;5: 33–37. 10.1371/journal.pone.0015533 [DOI] [PMC free article] [PubMed] [Google Scholar]
- 15.Bouma G, Strober W. The immunological and genetic basis of inflammatory bowel disease. Nat Rev Immunol. 2003;3: 521–533. 10.1038/nri1132 [DOI] [PubMed] [Google Scholar]
- 16.Kucharzik T, Maaser C, Lügering A, Kagnoff M, Mayer L, Targan S, et al. Recent understanding of IBD pathogenesis: Implications for future therapies. Inflamm Bowel Dis. Oxford University Press; 2006;12: 1068–1083. 10.1097/01.mib.0000235827.21778.d5 [DOI] [PubMed] [Google Scholar]
- 17.Brenchley JM, Douek DC. HIV infection and the gastrointestinal immune system. Mucosal Immunol. 2008;1: 23–30. 10.1038/mi.2007.1 [DOI] [PMC free article] [PubMed] [Google Scholar]
- 18.Kopylov U, Rosenfeld G, Bressler B, Seidman E. Clinical Utility of Fecal Biomarkers for the Diagnosis and Management of Inflammatory Bowel Disease1. Inflamm Bowel Dis. 2014;20: 742–756. 10.1097/01.MIB.0000442681.85545.31 [DOI] [PubMed] [Google Scholar]
- 19.Lewis JD. The utility of biomarkers in the diagnosis and therapy of inflammatory bowel disease. Gastroenterology. NIH Public Access; 2011;140: 1817–1826.e2. 10.1053/j.gastro.2010.11.058 [DOI] [PMC free article] [PubMed] [Google Scholar]
- 20.Musci JOD, Cornish JS, Däbritz J. Utility of surrogate markers for the prediction of relapses in inflammatory bowel diseases. J Gastroenterol. 2016;51: 531–547. 10.1007/s00535-016-1191-3 [DOI] [PubMed] [Google Scholar]
- 21.Langhorst J, Elsenbruch S, Koelzer J, Rueffer A, Michalsen A, Dobos GJ. Noninvasive Markers in the Assessment of Intestinal Inflammation in Inflammatory Bowel Diseases: Performance of Fecal Lactoferrin, Calprotectin, and PMN-Elastase, CRP, and Clinical Indices. Am J Gastroenterol. Nature Publishing Group; 2008;103: 162–169. 10.1111/j.1572-0241.2007.01556.x [DOI] [PubMed] [Google Scholar]
- 22.Katsikis PD, Mueller YM, Villinger F. The Cytokine Network of Acute HIV Infection: A Promising Target for Vaccines and Therapy to Reduce Viral Set-Point? Manchester M, editor. PLoS Pathog. Public Library of Science; 2011;7: e1002055 10.1371/journal.ppat.1002055 [DOI] [PMC free article] [PubMed] [Google Scholar]
- 23.Leeansyah E, Malone DFG, Anthony DD, Sandberg JK. Soluble biomarkers of HIV transmission, disease progression and comorbidities. Curr Opin HIV AIDS. 2013;8: 117–24. 10.1097/COH.0b013e32835c7134 [DOI] [PubMed] [Google Scholar]
- 24.Liovat AS, Rey-Cuillé MA, Lécuroux C, Jacquelin B, Girault I, Petitjean G, et al. Acute Plasma Biomarkers of T Cell Activation Set-Point Levels and of Disease Progression in HIV-1 Infection. PLoS One. 2012;7: 1–13. 10.1371/journal.pone.0046143 [DOI] [PMC free article] [PubMed] [Google Scholar]
- 25.Stacey AR, Norris PJ, Qin L, Haygreen EA, Taylor E, Heitman J, et al. Induction of a Striking Systemic Cytokine Cascade prior to Peak Viremia in Acute Human Immunodeficiency Virus Type 1 Infection, in Contrast to More Modest and Delayed Responses in Acute Hepatitis B and C Virus Infections. J Virol. American Society for Microbiology; 2009;83: 3719–3733. 10.1128/JVI.01844-08 [DOI] [PMC free article] [PubMed] [Google Scholar]
- 26.Dinh DM, Volpe GE, Duffalo C, Bhalchandra S, Tai AK, Kane A V., et al. Intestinal Microbiota, Microbial Translocation, and Systemic Inflammation in Chronic HIV Infection. J Infect Dis. Oxford University Press; 2015;211: 19–27. 10.1093/infdis/jiu409 [DOI] [PMC free article] [PubMed] [Google Scholar]
- 27.Ellis CL, Ma Z-M, Mann SK, Li C-S, Wu J, Knight TH, et al. Molecular characterization of stool microbiota in HIV-infected subjects by panbacterial and order-level 16S ribosomal DNA (rDNA) quantification and correlations with immune activation. J Acquir Immune Defic Syndr. NIH Public Access; 2011;57: 363–70. 10.1097/QAI.0b013e31821a603c [DOI] [PMC free article] [PubMed] [Google Scholar]
- 28.Cohen MS, Shaw GM, McMichael AJ, Haynes BF. Acute HIV-1 Infection. N Engl J Med. 2011;364: 1943–1954. 10.1056/NEJMra1011874 [DOI] [PMC free article] [PubMed] [Google Scholar]
- 29.Deeks SG, Kitchen CMR, Liu L, Guo H, Gascon R, Narváez AB, et al. Immune activation set point during early HIV infection predicts subsequent CD4 + T-cell changes independent of viral load. Blood. 2004;104: 942–947. 10.1182/blood-2003-09-3333 [DOI] [PubMed] [Google Scholar]
- 30.Sandler NG, Wand H, Roque A, Law M, Nason MC, Nixon DE, et al. Plasma levels of soluble CD14 independently predict mortality in HIV infection. J Infect Dis. 2011;203: 780–790. 10.1093/infdis/jiq118 [DOI] [PMC free article] [PubMed] [Google Scholar]
- 31.Group IACPW. More and Better Information to Tackle HIV Epidemics: Towards Improved HIV Incidence Assays. PLoS Med. Public Library of Science; 2011;8: e1001045 10.1371/journal.pmed.1001045 [DOI] [PMC free article] [PubMed] [Google Scholar]
- 32.Pastor L, Parker E, Carrillo J, Urrea V, Fuente-Soro L, Respeito D, et al. A Cytokine Pattern That Differentiates Preseroconversion From Postseroconversion Phases of Primary HIV Infection. JAIDS J Acquir Immune Defic Syndr. 2017;74: 459–466. 10.1097/QAI.0000000000001272 [DOI] [PubMed] [Google Scholar]
- 33.Pastor L, Urrea V, Carrillo J, Parker E, Fuente-soro L, Jairoce C, et al. Dynamics of CD4 and CD8 T-cell subsets and inflammatory biomarkers during early and chronic HIV infection in Mozambican adults. Front Immunol. 2018; [DOI] [PMC free article] [PubMed] [Google Scholar]
- 34.Pastor L, Casellas A, Carrillo J, Alonso S, Parker E, Fuente-Soro L, et al. IP-10 Levels as an Accurate Screening Tool to Detect Acute HIV Infection in Resource-Limited Settings. Sci Rep. Nature Publishing Group; 2017;7: 8104 10.1038/s41598-017-08218-0 [DOI] [PMC free article] [PubMed] [Google Scholar]
- 35.Fiebig EW, Wright DJ, Rawal BD, Garrett PE, Schumacher RT, Peddada L, et al. Dynamics of HIV viremia and antibody seroconversion in plasma donors: implications for diagnosis and staging of primary HIV infection. AIDS. 2003;17: 1871–9. 10.1097/01.aids.0000076308.76477.b8 [DOI] [PubMed] [Google Scholar]
- 36.Keele BF, Giorgi EE, Salazar-Gonzalez JF, Decker JM, Pham KT, Salazar MG, et al. Identification and characterization of transmitted and early founder virus envelopes in primary HIV-1 infection. Proc Natl Acad Sci U S A. National Academy of Sciences; 2008;105: 7552–7. 10.1073/pnas.0802203105 [DOI] [PMC free article] [PubMed] [Google Scholar]
- 37.Lee HY, Giorgi EE, Keele BF, Gaschen B, Athreya GS, Salazar-Gonzalez JF, et al. Modeling sequence evolution in acute HIV-1 infection. J Theor Biol. NIH Public Access; 2009;261: 341–60. 10.1016/j.jtbi.2009.07.038 [DOI] [PMC free article] [PubMed] [Google Scholar]
- 38.Thomas H. Nondetects and Data Analysis: Statistics for Censored Environmental Data. Vadose Zo J. 2006;5: 508 10.2136/vzj2005.0106br [DOI] [Google Scholar]
- 39.DeLong ER, DeLong DM, Clarke-Pearson DL. Comparing the Areas under Two or More Correlated Receiver Operating Characteristic Curves: A Nonparametric Approach. Biometrics. 1988;44: 837 10.2307/2531595 [DOI] [PubMed] [Google Scholar]
- 40.McHugh ML. Interrater reliability: the kappa statistic. Biochem medica. Croatian Society for Medical Biochemistry and Laboratory Medicine; 2012;22: 276–82. Available: http://www.ncbi.nlm.nih.gov/pubmed/23092060 [PMC free article] [PubMed] [Google Scholar]
- 41.Safari S, Baratloo A, Elfil M, Negida A. Evidence Based Emergency Medicine; Part 5 Receiver Operating Curve and Area under the Curve. Emerg (Tehran, Iran). Shahid Beheshti University of Medical Sciences; 2016;4: 111–3. Available: http://www.ncbi.nlm.nih.gov/pubmed/27274525 [PMC free article] [PubMed] [Google Scholar]
- 42.Lavreys L, Baeten JM, Chohan V, McClelland RS, Hassan WM, Richardson BA, et al. Higher Set Point Plasma Viral Load and More-Severe Acute HIV Type 1 (HIV-1) Illness Predict Mortality among High-Risk HIV-1-Infected African Women. Clin Infect Dis. Oxford University Press; 2006;42: 1333–1339. 10.1086/503258 [DOI] [PubMed] [Google Scholar]
- 43.Chevalier MF, Petitjean G, Dunyach-Rémy C, Didier C, Girard PM, Manea ME, et al. The Th17/Treg Ratio, IL-1RA and sCD14 Levels in Primary HIV Infection Predict the T-cell Activation Set Point in the Absence of Systemic Microbial Translocation. PLoS Pathog. 2013;9 10.1371/journal.ppat.1003453 [DOI] [PMC free article] [PubMed] [Google Scholar]
- 44.Krastinova E, Lecuroux C, Leroy C, Seng R, Cabie A, Rami A, et al. High Soluble CD14 Levels at Primary HIV-1 Infection Predict More Rapid Disease Progression. J Infect Dis. Oxford University Press; 2015;212: 909–913. 10.1093/infdis/jiv145 [DOI] [PubMed] [Google Scholar]
- 45.Wright SD, Ramos RA, Tobias PS, Ulevitch RJ, Mathison JC. CD14, a receptor for complexes of lipopolysaccharide (LPS) and LPS binding protein. Science. 1990;249: 1431–3. Available: http://www.ncbi.nlm.nih.gov/pubmed/1698311 [DOI] [PubMed] [Google Scholar]
- 46.Lien E, Aukrust P, Sundan A, Müller F, Frøland SS, Espevik T. Elevated levels of serum-soluble CD14 in human immunodeficiency virus type 1 (HIV-1) infection: correlation to disease progression and clinical events. Blood. 1998;92: 2084–92. Available: http://www.ncbi.nlm.nih.gov/pubmed/9731066 [PubMed] [Google Scholar]
- 47.Tenorio AR, Zheng Y, Bosch RJ, Krishnan S, Rodriguez B, Hunt PW, et al. Soluble markers of inflammation and coagulation but not T-cell activation predict non-AIDS-defining morbid events during suppressive antiretroviral treatment. J Infect Dis. Oxford University Press; 2014;210: 1248–59. 10.1093/infdis/jiu254 [DOI] [PMC free article] [PubMed] [Google Scholar]
- 48.Hunt PW, Sinclair E, Rodriguez B, Shive C, Clagett B, Funderburg N, et al. Gut Epithelial Barrier Dysfunction and Innate Immune Activation Predict Mortality in Treated HIV Infection. J Infect Dis. 2014;210: 1228–1238. 10.1093/infdis/jiu238 [DOI] [PMC free article] [PubMed] [Google Scholar]
- 49.Langhorst J, Boone J. Fecal lactoferrin as a noninvasive biomarker in inflammatory bowel diseases. Drugs of Today. 2012;48: 149 10.1358/dot.2012.48.2.1732555 [DOI] [PubMed] [Google Scholar]
- 50.Langhorst J, Choi K-E. The role of human defensins in gastrointestinal diseases. Expert Rev Clin Immunol. Taylor & Francis; 2011;7: 779–787. 10.1586/eci.11.62 [DOI] [PubMed] [Google Scholar]
- 51.Langhorst J, Junge A, Rueffer A, Wehkamp J, Foell D, Michalsen A, et al. Elevated Human β-Defensin-2 Levels Indicate an Activation of the Innate Immune System in Patients With Irritable Bowel Syndrome. Am J Gastroenterol. 2009;104: 404–410. 10.1038/ajg.2008.86 [DOI] [PubMed] [Google Scholar]
- 52.Sankaran S, George MD, Reay E, Guadalupe M, Flamm J, Prindiville T, et al. Rapid onset of intestinal epithelial barrier dysfunction in primary human immunodeficiency virus infection is driven by an imbalance between immune response and mucosal repair and regeneration. J Virol. American Society for Microbiology (ASM); 2008;82: 538–45. 10.1128/JVI.01449-07 [DOI] [PMC free article] [PubMed] [Google Scholar]
- 53.Zanni F, Vescovini R, Biasini C, Fagnoni F, Zanlari L, Telera A, et al. Marked increase with age of type 1 cytokines within memory and effector/cytotoxic CD8+ T cells in humans: a contribution to understand the relationship between inflammation and immunosenescence. Exp Gerontol. 2003;38: 981–987. 10.1016/S0531-5565(03)00160-8 [DOI] [PubMed] [Google Scholar]
- 54.Massanella M, Ouchi D, Marfil S, Llibre JM, Puertas MC, Buzón MJ, et al. Different plasma markers of inflammation are influenced by immune recovery and cART composition or intensification in treated HIV infected individuals. PLoS One. 2014;9: 1–15. 10.1371/journal.pone.0114142 [DOI] [PMC free article] [PubMed] [Google Scholar]
- 55.Klein SL, Flanagan KL. Sex differences in immune responses. Nat Rev Immunol. Nature Publishing Group; 2016;advance on. 10.1038/nri.2016.90 [DOI] [PubMed] [Google Scholar]
- 56.Kassanjee R, Pilcher CD, Keating SM, Facente SN, McKinney E, Price MA, et al. Independent assessment of candidate HIV incidence assays on specimens in the CEPHIA repository. AIDS. Wolters Kluwer Health; 2014;28: 2439–49. 10.1097/QAD.0000000000000429 [DOI] [PMC free article] [PubMed] [Google Scholar]
- 57.MURPHY G, PILCHER CD, KEATING SM, KASSANJEE R, FACENTE SN, WELTE A, et al. Moving towards a reliable HIV incidence test–current status, resources available, future directions and challenges ahead. Epidemiol Infect. Cambridge University Press; 2017;145: 925–941. 10.1017/S0950268816002910 [DOI] [PMC free article] [PubMed] [Google Scholar]
- 58.Fasano A. Zonulin and Its Regulation of Intestinal Barrier Function: The Biological Door to Inflammation, Autoimmunity, and Cancer. Physiol Rev. 2011;91: 151–175. 10.1152/physrev.00003.2008 [DOI] [PubMed] [Google Scholar]
Associated Data
This section collects any data citations, data availability statements, or supplementary materials included in this article.
Supplementary Materials
(DOCX)
(DOCX)
Data Availability Statement
The minimum dataset underlying the results of this study are available upon request due to ethical restrictions imposed by the Ministry of Health of Mozambique ethics review board. Public sharing of the data would breach the ethics review board’s data transfer agreement (DTA). Additionally, the data contains personal identifiers and sensitive information regarding HIV infection and treatment, as well as other infections. Interested researchers may contact Denise Naniche at denise.naniche@isglobal.org or llorenc.quinto@isglobal.org with their proposed analysis.