

Abstract
This study examined neural processes of resilience during aversive interoceptive processing. Forty-six individuals were divided into three groups of resilience Low (LowRes), high (HighRes), and normal (NormRes), based on the Connor-Davidson Resilience Scale (2003). Participants then completed a task involving anticipation and experience of loaded breathing during functional magnetic resonance imaging (fMRI) recording. Compared to HighRes and NormRes groups, LowRes self-reported lower levels of interoceptive awareness and demonstrated higher insular and thalamic activation across anticipation and breathing load conditions. Thus, individuals with lower resilience show reduced attention to bodily signals but greater neural processing to aversive bodily perturbations. In low resilient individuals, this mismatch between attention to and processing of interoceptive afferents may result in poor adaptation in stressful situations.
Keywords: Resilience, fMRI, Interoception, Insula
1. Introduction
Resilience can be conceptualized as one’s ability to positively adapt to stress, trauma, and adversity (Luthar, Cicchetti, & Becker, 2000), that is, the ability to utilize cognitive, emotional, and physiological resources in response to a stressor, and conservation of these resources once the stressor is removed (Block & Kremen, 1996; McEwen & Gianaros, 2011; Ong, Bergeman, Bisconti, & Wallace, 2006). These components of resilience may work together for an individual to adequately cope with traumatic events (Kok, Herrell, Thomas, & Hoge, 2012) and prevent the development of psychopathology (Haglund, Nestadt, Cooper, Southwick, & Charney, 2007). Surprisingly, however, relatively little is known how resilience is implemented in the brain. Of particular interest are the neural processing characteristics of low resilient individuals because they provide a brain-based rationale to develop targeted interventions to strengthen inadequate processing of stressors. Moreover, a more comprehensive understanding of the facets that contribute to low resilience is necessary to create biomarkers of change in intervention studies aimed at increasing stress resilience.
A central goal of recovery from stress is to maintain homeostasis of critical bodily functions such as temperature, blood pH, and blood glucose. To that end, the brain needs to be able to sense the state of the body to effectively engage in actions that can reduce imbalances and thus better regulate homeostasis. Interoception (Craig, 2002, 2003) is the process of sensing body-state relevant information within the context of homeostasis. For example, a person will approach a heat source in a cold environment but avoid it when the ambient temperature is high. Interoception provides an anatomical and physiological framework for identifying pathways focused on the modulating the internal state of the individual. This framework comprises peripheral receptors (Vaitl, 1996), c-fiber afferents, spino-thalamic projections, specific thalamic nuclei, posterior and anterior insula as the limbic sensory cortex, and anterior cingulate cortex (ACC) as the limbic motor cortex (Augustine, 1996; Craig, 2007). The insula is thought to be the central nervous system hub for interoceptive processing, such that body-state relevant afferents enter the posterior insula, are integrated with the internal state in the mid-insula, and re-represented as complex feeling state within the anterior insula (Gu, Hof, Friston, & Fan, 2013).
Interoception is an important process for resilience because it links the perturbation of internal state, including stressors, to goal-directed action that can restore the homeostatic balance of the body (Paulus et al., 2009). Highly resilient individuals (e.g., elite athletes, special operations forces) demonstrate attenuated insular and ACC activation during emotional processing and aversive interoceptive stimulation (Paulus et al., 2012; Paulus et al., 2010; Simmons et al., 2012; Thom et al., 2012), findings suggesting that the ability to perform well under stress may modulate neural systems important for processing interoceptive information. Despite recent work demonstrating brain patterns linked to high resilience (Paulus et al., 2012; Waugh, Wager, Fredrickson, Noll, & Taylor, 2008), less work has examined neural processes reflective of low resilience. Available research indicates that low-resilient individuals exhibit heightened anterior insula activation to threatening and aversive stimuli, whereas high-resilient individuals only show anterior insula increases to aversive emotion, suggesting that low resilience is linked to inappropriate evaluation of threat (Waugh et al., 2008). Moreover, attenuated recruitment of the medial prefrontal cortex (mPFC) has been linked to high resilience (Amodio & Frith, 2006; Thom et al., 2012), likely because mPFC mediates adaptations to stress (Maier & Watkins, 2010). It is unknown whether low resilience is characterized by attenuated or amplified processing of body-relevant information, which may lead to inadequate responses to stressful situations.
2. The present study
To examine how the body and brain responds to an aversive stimulus, we employed an aversive inspiratory breathing load task to study individual differences in resilience during functional magnetic resonance imaging (fMRI). Breathing is an interoceptive process that has both peripheral (Adriaensen & Timmermans, 2011) and central (Davenport & Vovk, 2009) pathways. Changes in breathing serve as a source of threat and result in increased anxiety (von Leupoldt, Chan, Bradley, Lang, & Davenport, 2011). An effective method of inducing experimental breathing change is by providing resistance during breathing inspiration. Our inspiratory breathing load task reliably activates brain regions involved in interoceptive processing, namely the insula, ACC, and medial prefrontal cortex (mPFC) (Paulus et al., 2012). Thus, the inspiratory breathing load task is an ideal method to assess the degree to which low-resilient and high-resilient individuals physiologically bounce back from stress.
We hypothesized that, compared to normal and high resilient individuals, low resilient individuals will exhibit greater activation in ACC, insular, and prefrontal cortices, linked to greater resources needed to regulate stress responses. For example, if the anterior insular cortex plays an important role in helping to predict perturbations in the internal body state and the ACC computes various types of error signals to help establish the selection of action, one would hypothesize that heightened activations in these structures are associated with less effective stress adaptation.
3. Methods
3.1. Participants
This study was conducted at the University of California, San Diego (UCSD) and was approved by the UCSD Institutional Review Board. All subjects were recruited from the community, signed informed consents, and received $50 compensation. Participants were categorized on the basis of their scores on the Connor-Davidson Resilience Scale (CD-RISC) (Connor & Davidson, 2003), a 10-item scale that measures the ability to cope with stress and adversity. Prior studies of the original CD-RISC support its internal consistency, test-retest reliability, and convergent and divergent validity (Campbell-Sills & Stein, 2007). Forty six eligible subjects, all right handed as assessed by the Edinburgh Handedness Inventory (Oldfield, 1971), were separated into three groups: (1) low resilience (LowRes, n = 16; CD-RISC score ≤ 20th percentile); (2) normal resilience (NormRes, n = 12; CD-RISC score between 21st–79th percentiles); and (3) high resilience (HighRes, n = 18; CD-RISC score ≥80th percentile).
Participants were matched for age, education, and gender (see Table 1 for study demographics). The following were exclusion criteria for all groups: (1) incorporated metal or any other factor that precludes use of fMRI; (2) current drug and/or alcohol dependence; (3) history of severe traumatic brain injury with loss of consciousness >30 min; (4) current use of antipsychotic medication or mood stabilizers, or other drugs that can acutely affect the hemodynamic response; (5) any diagnosed neurological disorder (including attention deficit hyperactivity disorder); and (6) history of schizophrenia, bipolar disorder, obsessive compulsive disorder, or antisocial personality disorder. No restrictions were placed on the consumption of caffeine-containing beverages; none of the subjects were smokers. Subjects then completed an fMRI session consisting of a continuous performance task with a breathing load manipulation (described below).
Table 1.
Demographics and self-report measures of study participants.
| Demographics characteristics | LowRes (n = 16) Mean (SD) | NormRes (n = 12) | HighRes (18) | Significance | η2 | ||
|---|---|---|---|---|---|---|---|
| Gender | 9f/7m | 5f/7m | 10f/8m | p = .698 | |||
| Age | 27.06(9.2) | 30.22(6.03) | 29.50(9.1) | p = .506 | .031 | ||
| Years of education | 14.31(2.2) | 14.94(2.79) | 15.92(1.7) | p = .216 | .096 | ||
| WRAT-4 reading | 65.53(3.56) | 64.35(3.55) | 64.36(3.98) | p = .242 | .067 | ||
| Cohen’s d | |||||||
| Self-report measures | LowRes vs. NormRes | LowRes vs. HighRes | |||||
| Body awareness total | 71.81(22.08) | 91.64(12.60) | 89.06(12.66) | p = .005a | .231 | −1.10 | −0.96 |
| Body responsiveness total | 32.12(5.28) | 38.36(6.27) | 39.18(5.04) | p = .001a | .277 | −1.08 | −1.37 |
| Perceived disconnection | 16.13(2.55) | 16.27(3.69) | 16.94(2.93) | p = .716 | .016 | ||
| Interoceptive awareness | 16.00(4.66) | 22.09(3.53) | 22.24(3.93) | p < .001a | .358 | −1.47 | −1.45 |
NormRes = normal resilience group; LowRes = low resilience group; HighRes = high resilience group; SD = standard deviation; f = female, m = male.
Significant after correcting for multiple comparisons.
3.2. Neuroimaging involving aversive interoceptive processing
Prior to the fMRI scan, participants completed measures of self-reported interoceptive awareness, the Body Awareness Questionnaire (BAQ), assessing attentiveness to normal bodily processes (Shields, Mallory, & Simon, 1989) as well as the Body Responsiveness Questionnaire (BRQ), measuring responsiveness to bodily sensations (Daubenmier, 2005).
3.2.1. Breathing load apparatus
Subjects wore a nose clip and breathed through a mouthpiece with a non-rebreathing valve (2600 series, Hans Rudolph) that maintained an airtight seal. The apparatus was attached to the scanner head coil to eliminate the need to for the participant to contract mouth muscles. The resistance loads consisted of a sintered bronze disk in a Plexiglas tube (loading manifold), with stoppered ports inserted between the disks. Subjects were given a 40 cmH2O/L/s inspiratory load applied to only the inspiratory port of the non-rebreathing valve for 40 s. Prior to scanning, subjects were given instructions about the task and experienced three 1-min segments of the breathing load. Following the fMRI session, participants completed Visual Analogue Scale (VAS) questionnaires, on which they were asked to rate the breathing load experience on a 10 cm scale anchored from “not at all” (0) to “extremely” (10) on the following 16 dimensions: pleasant, unpleasant, intense, tingling, fear of losing control, faintness, fear of dying, unreality, hot/cold flushes, trembling, choking, abdominal distress, chest pain, palpitations, sweating, and dizziness, corresponding to items used in prior studies (Chan & Davenport, 2008; Davenport & Vovk, 2008).
3.2.2. Continuous performance task (CPT)
Subjects performed a simple attention task while undergoing periods of inspiratory loaded breathing. Prior to testing, subjects were trained on the task. Participants were instructed to press a button corresponding to the direction pointed by an arrow on the screen (left arrow = left button, right arrow = right button). Each trial lasted 3 s; each arrow appeared for 2.5 s and the subject was allowed to respond during the entire 3 s trial interval. Subjects’ accuracy and reaction time (RT) were recorded and analyzed to determine effects of anticipation and stimulus presentation. The background color of the stimulus served as a cue to the impending presentation of the breathing load; blue indicated that there would be no load and yellow indicated a 25% chance of load presence. We introduced this probability to maximize the opportunity to measure the effect of anticipating an aversive interoceptive event. Throughout the task, subjects experienced five conditions: (1) baseline: subject performs task with a blue background signifying no cue; (2) anticipation: a yellow background (cue) signals 25% chance of an impending resistive loaded breathing period; (3) breathing load: 25% of the periods following the anticipation condition, subject continues to view the yellow cue and experiences 40-s period of resistive loaded breathing (plug at 40 cm H2O/L/s); (4) post-anticipation: 75% of the periods following the anticipation condition, subject performs the task with the blue background present (no cue); and (5) post-breathing load: immediately after the breathing load condition, subject performs the task with the blue background present (no cue). Subjects were requested to maintain a consistent breathing pace during the scan and exhaled carbon dioxide (CO2) was measured.
3.2.3. Experimental design
Implementation of this paradigm used an event-related fMRI design consisting of 2 runs, each containing 170 trials (56 baseline, 46 anticipation, 52 breathing load, 12 post-anticipation, and 4 post-breathing load) and 256 repetition times (TR = 2 s), yielding a total duration of 17 min and 4 s. Each trial corresponded to 1.5 TR. Across runs, each subject was presented with 34 baseline conditions and 32 anticipation conditions of varying length (average: 3 trials each). Eight of the anticipation conditions were followed by the breathing load condition, consisting of 40-s (13 trials) inspiratory breathing-load episodes (see Fig. 1). Durations of baseline (range: 2–7 trials) and anticipation conditions (range: 2–4 trials) were jittered in time to permit optimal resolution of the hemodynamic response function. During the CPT, CO2 levels were also collected at a rate of 40 Hz for each subject via nasal cannula (InVivo Corporation, Orlando, FL). The main dependent measures of interest were RT, accuracy, CO2 levels, fMRI whole-brain activation and functionally constrained regions of interest during the anticipation and breathing load conditions relative to the baseline condition (Paulus et al., 2012). Although the post-breathing load and post-anticipation conditions were included in the deconvolution to account for nuisance variance, they were not included in further analyses.
Fig. 1.

Aversive inspiratory breathing load task regressors of interest.
3.3. Neuroimaging acquisition and analysis
3.3.1. Image acquisition
Imaging data was acquired at the UCSD Center for Functional MRI on a 3T GE shortbore scanner (GE MR750), equipped with an eight-channel high bandwidth receivers that allow for shorter readout times and reduced signal distortions and ventromedial signal dropout. A high-resolution anatomical image was obtained, which consisted of a sagittally acquired spoiled gradient recalled (SPGR) sequence (172 sagittal slices; FOV 25 cm; matrix: 192 × 256 (interpolated to 256 × 256); slices thickness: 1 mm; TR: 8 ms; TE: 3 ms; flip angel: 12). We used an 8-channel brain array coil to axially acquire T2*-weighted echo-planar images (EPI; 40 axial slices, FOV: 230 mm, matrix: 64 × 64; slice thickness: 3 mm; TR: 2 s; TE 30 ms; flip angle: 90). Rapid image T2* acquisition was obtained via GE’s ASSET scanning, a form of sensitivity encoding (SENSE), which uses parallel imaging reconstruction to allow for sub k-space sampling.
3.3.2. Image analysis pathway
All subject-level data were processed with Analysis of Functional Neuroimages (AFNI) software package (Cox, 1996). The multivariate regressor approach detailed below was used to relate changes in EPI intensity to differences in task characteristics (Haxby, Petit, Ungerleider, & Courtney, 2000). EPI images were co-registered using a 3D-coregistration algorithm (Eddy, Fitzgerald, & Noll, 1996) that was developed to minimize the amount of image translation and rotation relative to all other images. Six motion parameters (dx, dy, dz, and roll, pitch, and yaw) were obtained across the time series for each subject. Three motion parameters (roll, pitch, yaw) were used as regressors to adjust EPI intensity changes due to motion artifacts. This has been shown to increase power in detecting task-related activation (Skudlarski, Constable, & Gore, 1999). All slices of the functional scans were temporally aligned following registration to assure that different relationships with the regressors were not due to the acquisition of different slices at different times during the repetition interval. The functional EPI underwent automatic coregistration to the high-resolution anatomical image and each dataset was manually inspected to confirm successful alignment. New outliers were generated for the volume-registered dataset based on whether a given time point greatly exceeded the mean number of voxel outliers for the time series.
Orthogonal regressors were computed for two conditions: (1) anticipation and (2) breathing load. A task-based reference function corresponding to time interval of the regressor of interest was convolved with a gamma variate function (Boynton, Engel, Glover, & Heeger, 1996) that modeled the prototypical 6–8 s delay hemodynamic response function (Friston, 1995) and the temporal dynamics of the hemodynamic response (typically 12–16 s; (Cohen, 1997)). In addition, three motion parameters were obtained for each participant (roll, pitch, yaw) and were used to adjust for EPI intensity changes due to motion artifacts. If the average of any one of these parameters exceeded 2 standard deviations from the mean or if movement exceeded the size of the voxel (4 mm) participants were excluded; however, no participant was excluded based on this criterion. Using the AFNI program 3dDeconvolve, multivariate regressor analysis was used to relate changes in EPI intensity to differences in task characteristics (anticipation and breathing load). The baseline condition, wherein participants were neither anticipating nor receiving the breathing load, served as the baseline for this analysis. A Gaussian Spatial Filter (4 mm FWHM) was used to spatially blur data to account for anatomical differences. Automated Talairach transformations were applied to anatomical images and EPIs were su/bsequently transformed into Talairach space. Voxel-wise normalized% signal change from baseline was then calculated for anticipation and breathing load conditions.
3.3.3. Regions of interest
In addition to the whole-brain analysis, analyses were constrained to a priori regions of interest (ROI), which included the insula, ACC, thalamus, mPFC and dlPFC. These a priori, anatomically defined ROIs were constructed using a data-driven approach that combined Talairach stereotactic definition and grey matter probabilities based on high resolution T1 images from a group of 43 healthy adults (Fonzo et al., 2013). Using SPM5 (Statistical Parametric Mapping software; http://www.fil.ion.ucl.ac.uk/spm) implemented in Matlab 7.5.0 (MathWorks, Natick, Massachusetts), grey matter probabilities were determined by applying grey matter segmentation for each subject, which yielded voxel-wise probabilities of assignment to grey matter, across all subjects. The grey matter probability maps were spatially normalized to Talairach stereotactic space, with the boundaries of each region determined based on maximizing sensitivity and specificity for each ROI. The masks were then applied to functional MRI datasets to extract signals from voxels located in selected regions.
3.3.4. Group-level analysis
The main dependent measure was percent signal change during anticipation and breathing load conditions, which were entered into a mixed effects model (Littell, Pendergast, & Natarajan, 2000). Data were analyzed with linear mixed effects models in R (http://cran.r-project.org/), which estimates parameters using Maximum Likelihood Estimation and estimates effects using specific contrast matrices. The fixed factors were modeled as the group (LowRes, NormRes, HighRes), condition (anticipation and breathing load), and subject was modeled as a random factor. In order to guard against Type I error, voxel-wise statistics were calculated using the AFNI program Alphasim, which estimates statistical significance based on Monte-Carlo stimulations. It was determined that, given the spatial smoothing of 4 mm FWHM and a voxel-wise p < 0.05, the volume threshold for clusterwise probability of 0.05 was: (1) 768 μL (12 contiguous voxels) for the whole brain fMRI analysis; (2) 256 μL (4 contiguous voxels) for insula and thalamus; (3) 448 μL (7 contiguous voxels) for ACC; (4) 320 μL (5 contiguous voxels) for dlPFC; and (5) 384 μL (6 contiguous voxels) for mPFC. Only clusters meeting these criteria were considered for further analysis.
3.4. Questionnaire and neuropsychological assessment analyses
3.4.1. Statistical analysis
All data analyses were carried out with SPSS 20.0 (IBM, Chicago, IL). A chi-square analysis was performed to examine the relationship between gender and resilience level (LowRes, NormRes, HighRes). Univariate analysis of variance (ANOVA) were performed to examine the relationship between resilience level and (1) demographic characteristics: age, education, and verbal IQ; (2) interoceptive assessments: BAQ and BRQ (perceived disconnection and interoceptive awareness); and (3) VAS ratings after the fMRI session.
3.4.2. Data screening
Prior to analysis, data were screened for normality of distribution and outliers. Normality of distribution was analyzed using the Shapiro–Wilks test. BAQ total and BRQ total were identified as being non-normally distributed. In addition, all analyses were screened for violations of homogeneity of variance using Levene’s Test of Equality of Error Variances. BAQ total violated homogeneity of variance. All analyses were conducted using parametric statistics; however, variables found to have non-normal distributions and/or violations of homogeneity of variance were re-analyzed using non-parametric statistics (i.e., Mann–Whitney U test). Results of non-parametric analyses were unchanged, most likely due to the robustness of ANOVA. As such, for consistency and ease of interpretation, parametric analyses are presented.
3.5. RT, accuracy, and CO2 analysis
RT and accuracy were calculated for each condition per participant. CO2 data were visually inspected for artifacts and down sampled by 80 (40 Hz × 2 s per TR) to obtain one value per TR per fMRI run. A total of 32/44 (73%) of subjects (10 LowRes, 10 NormRes, and 12HighRes) had usable CO2 data as determined via visual inspection. For these subjects, CO2 values were averaged for each condition separately. Separate repeated measures ANOVAs were performed for RT, accuracy, and CO2; percent change from baseline was the dependent variable, condition (anticipation and breathing load) was the within-subjects variable, and group (LowRes, NormRes, HighRes) was the between-subjects variable. Greenhouse-Geisser corrections were calculated and reported for cases of non-normality. Follow up univariate ANOVAs were employed to test significant effects.
3.6. Exploratory brain-behavior correlations
Spearman’s Rho correlations were run between measures of interoception and fMRI regions (that were different among the three groups or that had a group by condition interaction) and significant clusters from the ROI activation analysis. Bonferroni correction was calculated to account for multiple comparisons.
4. Results
4.1. Questionnaire session
4.1.1. Group differences
Table 1 shows means, significance, partial eta-squared, and Cohen’s d as a function of group membership. Cohen’s d and Partial eta-squared are both effect sizes that measure the strength of the relationship between two variables. With respect to interoceptive processing, LowRes endorsed lower BAQ total and BRQ total interoceptive awareness than the other two groups.
4.2. Neuroimaging session
4.2.1. Behavioral and physiological results
Findings are presented in Table 2. Levels of resilience did not affect accuracy. However, for RT, there was a main effect of condition [F(1,41) = 6.02, p < 0.05] and a group by condition interaction [F(2,41) = 3.52, p < 0.05]. For the main effect of condition, as a whole, all participants had quicker RT during breathing load relative to anticipation. For the group by condition interaction, follow-up univariate ANOVAs indicated that there were no group differences in RT for breathing load, there was a significant effect of group for anticipation [F(2,41) = 3.21, p < 0.05], such that LowRes had greater percent change RT from baseline to anticipation than NormRes. There was a main effect of condition for CO2; breathing load was associated with lower CO2 levels, but there were no group differences. Finally, groups did not differ on VAS pleasantness, unpleasantness, or intensity ratings of the breathing load experience.
Table 2.
fMRI breathing load behavioral performance, CO2, and VAS ratings.
| LowRes M (SD) | NormRes M (SD) | HighRes M (SD) | |
|---|---|---|---|
| RT (ms) | |||
| Baseline | 600.56 (106.53) | 737.98 (132.99) | 644.09 (108.67) |
| Anticipation | 625.11 (115.20) | 719.38 (122.91) | 661.70 (116.93) |
| Breathing load | 586.91 (115.80) | 748.01 (221.10) | 631.74 (154.00) |
| Accuracy (%) | |||
| Baseline | 95 (6) | 90 (11) | 95 (6) |
| Anticipation | 96 (5) | 89 (15) | 94 (9) |
| Breathing load | 97 (4) | 90 (11) | 95 (7) |
| CO2 | |||
| Baseline | 1.13 (0.21) | 1.08 (0.22) | 1.24 (0.18) |
| Anticipation | 1.14 (0.20) | 1.09 (0.20) | 1.16 (0.19) |
| Breathing load | 0.95 (0.21) | 0.94 (0.18) | 1.00 (0.19) |
| VAS ratings | |||
| Pleasantness | 3.07 (2.28) | 3.58 (3.31) | 3.52 (2.84) |
| Unpleasantness | 5.29 (2.49) | 3.99 (2.71) | 4.86 (3.01) |
| Intensity | 2.82 (2.77) | 2.22 (2.69) | 2.66 (3.02) |
4.2.2. Whole-brain fMRI analysis
See Table 3 and Figs. 2 and 3 for the main effect of group and condition and the group by condition interaction results. All significant effects were followed-up and confirmed with post-hoc analyses.
Table 3.
Whole-brain fMRI results for group and condition main effects and the group by condition interaction effect.
| Group main effect | |||||||||
|---|---|---|---|---|---|---|---|---|---|
| Vol (μL) | Voxels | x | y | z | Hem | Regions in cluster | BA | HighRes < LowRes | NormRes < LowRes |
| 1472 | 23 | −36 | −10 | −1 | L | Middle and posterior insula | 13 | p < .001 | p < .005 |
| 1216 | 19 | −1 | −45 | 2 | L/R | Culmen | 29 | p < .001 | p < .006 |
| HighRes < NormRes | LowRes < NormRes | ||||||||
| 768 | 12 | 16 | 35 | 34 | R | Medial frontal gyrus | 9 | p < .001 | p < .001 |
| Vol(μL) | Voxels | x | y | z | Hem | Regions in cluster | BA | Ant < Load | Load < Ant |
| 242496 | 3789 | −6 | −14 | 14 | L/R | Insula, thalamus, caudate | - | p < .001 | ns |
| Lentiform nucleus, precentral gyrus. | |||||||||
| Postcentral gyrus, superior temporal | |||||||||
| Gyrus | |||||||||
| 50112 | 783 | 0 | 0 | 46 | L/R | Anterior cingulate gyrus, | 24 | p < .001 | ns |
| Gyrus, medial frontal gyrus. | |||||||||
| Cingulate gyrus, superior frontal | |||||||||
| 4288 | 67 | 29 | 40 | 34 | R | Middle frontal gyrus, superior frontal | 9 | p < .001 | ns |
| Gyrus | |||||||||
| 1152 | 18 | −53 | −51 | 6 | L | Middle temporal gyrus | 22 | p < .001 | ns |
| 960 | 15 | 19 | −31 | 61 | R | Postcentral gyrus | 4 | p < .001 | ns |
| 768 | 12 | 20 | 32 | −5 | R | Inferior frontal gyrus | 47 | p < .001 | ns |
| 768 | 12 | 44 | 40 | 14 | R | Middle frontal gyrus | 10 | p < .001 | ns |
| Group × condition interaction | |||||||||
| Vol(μL) | Voxels | x | y | z | Hem | Regions in cluster | BA | Ant | Load |
| 2432 | 38 | 27 | −50 | 7 | R | Parahippocampal gyrus/caudate | 30 | HighRes < LowRes; p = .009 | LowRes < HighRes; p = .010 |
| 1472 | 23 | 1 | −47 | 3 | L/R | Culmen | 29 | ns | HighRes < LowRes; p < .001 |
| NormRes < LowRes; p = .001 | |||||||||
| 1088 | 17 | −29 | 11 | 51 | L | Middle frontal gyrus | 6 | ns | NormRes < LowRes; p = .010 |
| 768 | 12 | 28 | −81 | −26 | R | Tuber/Uvula | - | ns | HighRes < LowRes; p = .001 |
| NormRes < LowRes; p = .004 | |||||||||
Fig. 2.

Whole brain analysis: main effect of group.
Fig. 3.

Whole brain analysis: main effect of condition.
4.2.2.1. Condition main effect.
Across all subjects, there was greater activation in the breathing load condition relative to the anticipation condition in the insula, thalamus, ACC, and mPFC (see Table 3 for a comprehensive list of regions and Fig. 3).
4.2.2.2. Group main effect.
LowRes showed greater activation than NormRes and HighRes in left middle insula (Fig. 2). In contrast, HighRes exhibited lower activation than the other two groups in right mPFC, and in turn, LowRes displayed lower activation than NormRes.
4.2.2.3. Group by condition interaction.
HighRes demonstrated lower right parahippocampal gyrus and caudate activation during anticipation and breathing load than the other two groups. In addition, HighRes and NormRes displayed lower activation in bilateral cerebellum than LowRes during breathing load. LowRes exhibited higher left mPFC activation than NormRes during breathing load, but HighRes did not differ from both groups.
4.2.3. ROI fMRI analysis
See Table 4 for the main effect of group and condition and the group by condition interaction results. There were no significant clusters of activation in the ACC, anterior insula, of dlPFC. For the group main effect, LowRes demonstrated greater activation than the other two groups in middle insula and thalamus (Fig. 4). However, for mPFC, NormRes had greater activation than the other two groups.
Table 4.
ROI fMRI results for the group main effect and the group by condition interaction effect.
| Vol (μL) | Voxels | x | y | z | Hem | Regions in cluster | BA | HighRes < LowRes | NormRes < LowRes |
|---|---|---|---|---|---|---|---|---|---|
| 512 | 8 | −38 | −12 | 0 | L | Middle insula | 13 | p < .004 | p < .004 |
| 384 | 6 | −16 | −32 | 7 | L | Thalamus | p < .008 | p < .008 | |
| HighRes < NormRes | LowRes < NormRes | ||||||||
| 576 | 9 | 15 | 34 | 34 | R | Medial frontal gyrus | 9 | p < .001 | p < .001 |
Fig. 4.
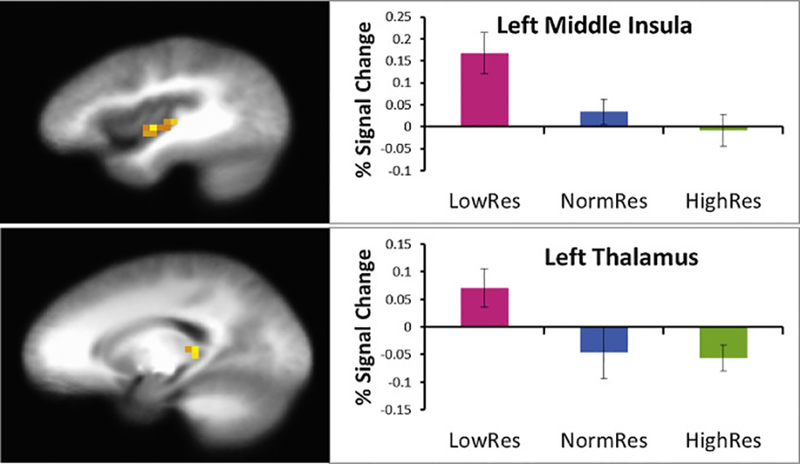
Region of interest analysis: main effect of group.
5. Discussion
This study aimed to investigate how various levels of self-reported resilience is related to how the brain responds to an aversive stimulus. We report two primary findings: (1) LowRes individuals self-reported lower levels of interoceptive awareness; and (2) LowRes individuals demonstrated higher insular and thalamic activation across anticipation and breathing load conditions. We speculate that this mismatch between attention to and processing of interoceptive afferents result in poor adaptation in stressful situations.
First, individuals who self-report low levels resilience (LowRes) endorse lower levels of interoceptive awareness and body responsiveness than individuals who self-report normal and high levels of resilience (NormRes and HighRes, respectively). There is evidence to suggest that elite athletes, individuals whom one may consider to be resilient, are particularly adept at paying close attention to bodily signals (Philippe & Seiler, 2005). It has been proposed that individuals regulate performance via multiple afferents that signal the perception of effort relative to perceived fatigue, such that, one’s performance is maintained within the biomechanical and metabolic limits of the body (Hampson, Gibson, Lambert, & Noakes, 2001; Tucker, 2009). We have recently proposed that maintaining interoceptive balance, by generating body prediction errors, i.e., the difference between the value of the anticipated/predicted interoceptive state and the value of the current interoceptive state, in the presence of significant perturbations, may be the neural marker of optimal performance (Paulus et al., 2009). In particular, optimal performers may generate a more efficient body prediction error, as a way of adapting to extreme environments. In line with this heuristic, the present findings provide evidence that LowRes individuals have significantly less awareness and responsiveness to interoceptive signals. Findings point to bodily awareness training as potential interventions of those who report impaired stress resilience (Paul, Stanson, Greeson, Smoski, & Wang, 2013; Sahdra et al., 2011).
Second, consistent with our previous studies focused on elite warfighters and athletes, individuals at the opposite end of the resilience spectrum, i.e., LowRes, showed greater activation than normal and high resilient participants in brain regions important for processing interoceptive afferents. Specifically, LowRes individuals demonstrated greater activation in the thalamus and middle insula than the other two groups, findings that do not appear to be a function of CO2 levels, task accuracy and RT, or subjective experiences of aversive breathing load (e.g., VAS pleasantness). There is converging evidence to suggest that the insula functions as an integration system that instantiates information about subjective feeling states and awareness of the self (Craig, 2002; Critchley, Wiens, Rotshtein, Ohman, & Dolan, 2004). The posterior insula receives topographic and modality specific interoceptive information from ascending brain regions, which is then transmitted and integrated to the middle insula and anterior insula with information regarding hedonic and motivational salience that is received from subcortical and cortical structures (Augustine, 1996; Craig, 2009; Mesulam & Mufson, 1982; Mufson & Mesulam, 1982). The exaggerated insula response in LowRes individuals is consistent with our prior findings that anxiety prone individuals show exaggerated insular response to emotional faces (Stein, Simmons, Feinstein, & Paulus, 2007) and when anticipating aversive visual stimuli (Simmons, Strigo, Matthews, Paulus, & Stein, 2006). A recent study by Farb, Segal, and Anderson (2013)) further validated the role of the middle and posterior insula as a primary interoceptive cortex. In particular, they demonstrated significant middle and posterior insula activation during an interoceptive attention to breathing task, wherein greater activation in the middle insula was associated with greater attention to the breath (Farb et al., 2013). Thus, there is a possibility that individuals who are low resilient or those who are at risk for anxiety disorders show deploy more neural processing resources to resolve the interoceptive impact of aversive events. Specifically, we have argued that this increased processing emerges from increased mismatch in actual versus predicted body states (Paulus & Stein, 2006). Moreover, given that these individuals do not adaptively respond to stressful situations, it suggests that the mismatch between inadequate awareness of interoceptive stimuli and increased insula and thalamus activation to aversive stimuli may be the key processes that contribute to lower levels of resilience. Therefore, the exaggerated insula activation in low LowRes subjects could be considered an example of inefficient neural processing (Paulus et al., 2009; Paulus & Stein, 2006).
Waugh et al. (2008) found that LowRes individuals showed significantly greater anterior insula activation in response to threatening and aversive images, whereas HighRes individuals showed less insula activation during to threatening images. Moreover, we have previously shown that highly resilient individuals, such as elite adventure racers (Paulus et al., 2012) and special operations forces (Simmons et al., 2012), demonstrate improved performance and attenuated insular function, which suggests that resilience, or the ability to perform well under stress, involves attenuation of the neural systems that subserve emotion and interoception. These data are consistent with the present results documenting attenuated thalamus and insular activation in NormRes and HighRes individuals, in contrast to LowRes individuals. Moreover, the significant increase in activation in the LowRes group in response to an aversive interoceptive perturbation may represent a neural marker of low resilience.
One could speculate that decreased awareness and responsiveness of interoceptive signals leaves LowRes individuals unprepared in the face of interoceptive perturbation. As a result of a disrupted interoceptive system, LowRes individuals may be unable to make accurate body prediction errors, as their reduced interoceptive monitoring may lead to poor integration of current body states to predict future body states. In other words, LowRes individuals by not be effectively using information from the moment, which may lead to impaired decision making in the presence of stressful environments.
A potentially confounding factor of the present study is that the LowRes group was relatively high functioning; we screened for current psychopathology and medication use. Investigating LowRes individuals with multiple comorbidities may result in a more comprehensive understanding of self-report and functional brain changes in LowRes individuals. However, despite our relatively healthy LowRes individuals, we were able to demonstrate both self-report and functional brain changes.
6. Summary
The observation that levels of resilience are associated with differential activation of insular cortex is a first step in bringing neuroscience approaches to a better understanding of what makes individuals perform differently when exposed to extreme environments and how to build resilience. These results suggest that the ability to perform well under stress involves modulation of the neural systems are also important in processing interoceptive information. Given our results, it appears that individuals at the lower end of the resilience spectrum demonstrate an inability to monitor their incoming body signals, as measured by self-report and fMRI, resulting in inefficient body prediction errors. As a consequence, the brain utilizes more resources in areas that are important for processing these body afferents.
Acknowledgments
This research was supported by funding from the Office of Naval Research (ONR) Code 30, and Navy Bureau of Medicine and Surgery (BUMED), National Institute of Mental Health (T32-MH018399–26), VA Merit Grant, and the VA Center of Excellence in Stress and Mental Health.
We extend our appreciation to Drs. Karl Van Orden and Tom Liu and to Sonja Eberson, Akanksha Shukla, Corrine Phan, and the UCSD Keck Center for Functional MRI.
The views expressed in this article are those of the authors and do not reflect the official policy or position of the Navy, Department of Defense, or the U.S. Government. This research has been conducted in compliance with all applicable federal regulations governing the protection of human subjects in research.
References
- Adriaensen D, & Timmermans JP (2011). Breath-taking complexity of vagal C-fibre nociceptors: implications for inflammatory pulmonary disease, dyspnoea and cough. Journal of Physiology, 589(Pt. 1), 3–4. 10.1113/jphysiol.2010.201434 [DOI] [PMC free article] [PubMed] [Google Scholar]
- Amodio DM, & Frith CD (2006). Meeting of minds: the medial frontal cortex and social cognition. Nature Reviews Neuroscience, 7(4), 268–277. 10.1038/nrn1884 [DOI] [PubMed] [Google Scholar]
- Augustine JR (1996). Circuitry and functional aspects of the insular lobe in primates including humans. Brain Research Brain Research Reviews, 22(3), 229–244. [DOI] [PubMed] [Google Scholar]
- Block J, & Kremen AM (1996). IQ and ego-resiliency: conceptual and empirical connections and separateness. Journal of Personality and Social Psychology, 70(2), 349–361. [DOI] [PubMed] [Google Scholar]
- Boynton GM, Engel SA, Glover GH, & Heeger DJ (1996). Linear systems analysis of functional magnetic resonance imaging in human V1. Journal of Neuroscience, 16(13), 4207–4221. [DOI] [PMC free article] [PubMed] [Google Scholar]
- Campbell-Sills L, & Stein MB (2007). Psychometric analysis and refinement of the Connor-davidson Resilience Scale (CD-RISC): validation of a 10-item measure of resilience. Journal of Traumatic Stress, 20(6), 1019–1028. 10.1002/jts.20271 [DOI] [PubMed] [Google Scholar]
- Chan PY, & Davenport PW (2008). Respiratory-related evoked potential measures of respiratory sensory gating. Journal of Applied Physiology, 105(4), 1106–1113. [DOI] [PMC free article] [PubMed] [Google Scholar]
- Cohen MS (1997). Parametric analysis of fMRI data using linear systems methods. Neuroimage, 6(2), 93–103. [DOI] [PubMed] [Google Scholar]
- Connor KM, & Davidson JR (2003). Development of a new resilience scale: the Connor-Davidson Resilience Scale (CD-RISC). Depression and Anxiety, 18(2), 76–82. [DOI] [PubMed] [Google Scholar]
- Cox RW (1996). AFNI: software for analysis and visualization of functional magnetic resonance neuroimages. Computers and Biomedical Research, 29(3), 162–173. [DOI] [PubMed] [Google Scholar]
- Craig AD (2002). How do you feel? Interoception: the sense of the physiological condition of the body. Nature Reviews Neuroscience, 3(8), 655–666. 10.1038/nrn894 [DOI] [PubMed] [Google Scholar]
- Craig AD (2003). Interoception: the sense of the physiological condition of the body. Current Opinion in Neurobiology, 13(4), 500–505. [DOI] [PubMed] [Google Scholar]
- Craig AD (2007). Interoception and emotion: a neuroanatomical perspective In Lewis M, Haviland-Jones JM, & Feldman Barrett L (Eds.), Handbook of emotions (Vol. 3rd) (pp. 272–290). New York: Guilford Press; (Reprinted from: NOT IN FILE). [Google Scholar]
- Craig AD (2009). How do you feel-now? The anterior insula and human awareness. Nature Reviews Neuroscience, 10(1), 59–70. 10.1038/nrn2555 [DOI] [PubMed] [Google Scholar]
- Critchley HD, Wiens S, Rotshtein P, Ohman A, & Dolan RJ (2004). Neural systems supporting interoceptive awareness. Nature Neuroscience, 7(2), 189–195. 10.1038/nn1176 [DOI] [PubMed] [Google Scholar]
- Daubenmier JJ (2005). The relationship of yoga, body awareness, and body responsiveness to self-objectification and disordered eating. Psychology of Women Quarterly, 29(2), 207–219. 10.1111/j.1471-6402.2005.00183.x [DOI] [Google Scholar]
- Davenport PW, & Vovk A (2008). Cortical and subcortical central neural pathways in respiratory sensations. Respiratory Physiology and Neurobiology, 167(1), 72–86. [DOI] [PubMed] [Google Scholar]
- Davenport PW, & Vovk A (2009). Cortical and subcortical central neural pathways in respiratory sensations. Respiratory Physiology and Neurobiology, 167(1), 72–86. 10.1016/j.resp.2008.10.001 [DOI] [PubMed] [Google Scholar]
- Eddy WF, Fitzgerald M, & Noll DC (1996). Improved image registration by using Fourier interpolation. Magnetic Resonance in Medicine, 36(6), 923–931. [DOI] [PubMed] [Google Scholar]
- Farb NA, Segal ZV, & Anderson AK (2013). Attentional modulation of primary interoceptive and exteroceptive cortices. Cerebral Cortex, 23(1), 114–126. 10.1093/cercor/bhr385 [DOI] [PMC free article] [PubMed] [Google Scholar]
- Fonzo GA, Flagan TM, Sullivan S, Allard CB, Grimes EM, Simmons AN, & Stein MB (2013). Neural functional and structural correlates of childhood maltreatment in women with intimate-partner violence-related posttraumatic stress disorder. Psychiatry Research, 211(2), 93–103. 10.1016/j.pscychresns.2012.08.006 [DOI] [PMC free article] [PubMed] [Google Scholar]
- Friston KJ (1995). Commentary and opinion: II. Statistical parametric mapping: ontology and current issues. Journal of Cerebral Blood Flow & Metabolism, 15(3), 361–370. [DOI] [PubMed] [Google Scholar]
- Gu X, Hof PR, Friston KJ, & Fan J (2013). Anterior insular cortex and emotional awareness. Journal of Comparative Neurology, 521(15), 3371–3388. 10.1002/cne.23368 [DOI] [PMC free article] [PubMed] [Google Scholar]
- Haglund ME, Nestadt PS, Cooper NS, Southwick SM, & Charney DS (2007). Psychobiological mechanisms of resilience: relevance to prevention and treatment of stress-related psychopathology. Development and Psychopathology, 19(3), 889–920. 10.1017/s0954579407000430 [DOI] [PubMed] [Google Scholar]
- Hampson DB, Gibson ASC, Lambert MI, & Noakes TD (2001). The influence of sensory cues on the perception of exertion during exercise and central regulation of exercise performance. Sports Medicine, 31(13), 935–952. [DOI] [PubMed] [Google Scholar]
- Haxby JV, Petit L, Ungerleider LG, & Courtney SM (2000). Distinguishing the functional roles of multiple regions in distributed neural systems for visual working memory. Neuroimage, 11(2), 145–156. [DOI] [PubMed] [Google Scholar]
- Kok BC, Herrell RK, Thomas JL, & Hoge CW (2012). Posttraumatic stress disorder associated with combat service in Iraq or Afghanistan: reconciling prevalence differences between studies. Journal of Nervous and Mental Disease, 200(5), 444–450. 10.1097/NMD.0b013e3182532312 [DOI] [PubMed] [Google Scholar]
- Littell RC, Pendergast J, & Natarajan R (2000). Modelling covariance structure in the analysis of repeated measures data. Statistics in Medicine, 19(13), 1793–1819. [DOI] [PubMed] [Google Scholar]
- Luthar SS, Cicchetti D, & Becker B (2000). The construct of resilience: a critical evaluation and guidelines for future work. Child Development, 71(3), 543–562. [DOI] [PMC free article] [PubMed] [Google Scholar]
- Maier SF, & Watkins LR (2010). Role of the medial prefrontal cortex in coping and resilience. Brain Research, 1355, 52–60. 10.1016/j.brainres.2010.08.039 [DOI] [PMC free article] [PubMed] [Google Scholar]
- McEwen BS, & Gianaros PJ (2011). Stress- and allostasis-induced brain plasticity. Annual Review of Medicine, 62, 431–445. 10.1146/annurev-med-052209-100430 [DOI] [PMC free article] [PubMed] [Google Scholar]
- Mesulam MM, & Mufson EJ (1982). Insula of the old world monkey. III: efferent cortical output and comments on function. Journal of Comparative Neurology, 212(1), 38–52. 10.1002/cne.902120104 [DOI] [PubMed] [Google Scholar]
- Mufson EJ, & Mesulam MM (1982). Insula of the old world monkey. II: afferent cortical input and comments on the claustrum. Journal of Comparative Neurology, 212(1), 23–37. 10.1002/cne.902120103 [DOI] [PubMed] [Google Scholar]
- Oldfield RC (1971). The assessment and analysis of handedness: the Edinburgh inventory. Neuropsychologia, 9(1), 97–113. [DOI] [PubMed] [Google Scholar]
- Ong AD, Bergeman CS, Bisconti TL, & Wallace KA (2006). Psychological resilience, positive emotions, and successful adaptation to stress in later life. Journal of Personality and Social Psychology, 91(4), 730–749. 10.1037/0022-3514.91.4.730 [DOI] [PubMed] [Google Scholar]
- Paul NA, Stanson SJ, Greeson JM, Smoski MJ, & Wang L (2013). Psychological and neural mechanisms of trait mindfulness in reducing depression vulnerability. Social, Cognitive and Affective Neuroscience, 8(1), 56–64. 10.1093/scan/nss070 [DOI] [PMC free article] [PubMed] [Google Scholar]
- Paulus MP, Flagan T, Simmons AN, Gillis K, Kotturi S, Thom N, & Swain JL (2012). Subjecting elite athletes to inspiratory breathing load reveals behavioral and neural signatures of optimal performers in extreme environments. Public Library Of Science, 7(1), e29394 10.1371/journal.pone.0029394 [DOI] [PMC free article] [PubMed] [Google Scholar]
- Paulus MP, Potterat EG, Taylor MK, Van Orden KF, Bauman J, Momen N, & Swain JL (2009). A neuroscience approach to optimizing brain resources for human performance in extreme environments. Neuroscience & Biobehavioral Reviews, 33(7), 1080–1088. 10.1016/j.neubiorev.2009.05.003 [DOI] [PMC free article] [PubMed] [Google Scholar]
- Paulus MP, Simmons AN, Fitzpatrick SN, Potterat EG, Van Orden KF, Bauman J, & Swain JL (2010). Differential brain activation to angry faces by elite warfighters: neural processing evidence for enhanced threat detection. Public Library Of Science, 5(4), e10096 10.1371/journal.pone.0010096 [DOI] [PMC free article] [PubMed] [Google Scholar]
- Paulus MP, & Stein MB (2006). An insular view of anxiety. Biological Psychiatry, 60(4), 383–387. 10.1016/j.biopsych.2006.03.042 [DOI] [PubMed] [Google Scholar]
- Philippe RA, & Seiler R (2005). Sex differences on use of associative and dissociative cognitive strategies among male and female athletes. Perceptual and Motor Skills, 101(2), 440–444. [DOI] [PubMed] [Google Scholar]
- Sahdra BK, MacLean KA, Ferrer E, Shaver PR, Rosenberg EL, Jacobs TL, et al. (2011). Enhances response inhibition during intensive medication training predicts improvements in self-reported adaptive soicoemotional functioning. Emotion, 11(2), 299–312. 10.1037/a0022764 [DOI] [PubMed] [Google Scholar]
- Shields SA, Mallory ME, & Simon A (1989). The body awareness questionnaire: reliability and validity. Journal of Personality Assessment, 53(4), 802–815. [Google Scholar]
- Simmons A, Strigo I, Matthews SC, Paulus MP, & Stein MB (2006). Anticipation of aversive visual stimuli is associated with increased insula activation in anxiety-prone subjects. Biological Psychiatry, 60(4), 402–409. [DOI] [PubMed] [Google Scholar]
- Simmons AN, Fitzpatrick S, Strigo IA, Potterat EG, Johnson DC, Matthews SC, & Paulus MP (2012). Altered insula activation in anticipation of changing emotional states: neural mechanisms underlying cognitive flexibility in special operations forces personnel. Neuroreport, 23(4), 234–239. 10.1097/wnr.0b013e3283503275 [DOI] [PubMed] [Google Scholar]
- Skudlarski P, Constable RT, & Gore JC (1999). ROC analysis of statistical methods used in functional MRI: individual subjects. Neuroimage, 9(3), 311–329. [DOI] [PubMed] [Google Scholar]
- Stein MB, Simmons AN, Feinstein JS, & Paulus MP (2007). Increased amygdala and insula activation during emotion processing in anxiety-prone subjects. American Journal of Psychiatry, 164(2), 318–327. [DOI] [PubMed] [Google Scholar]
- Thom NJ, Johnson DC, Flagan T, Simmons AN, Kotturi SA, Van Orden KF, & Paulus MP (2012). Detecting emotion in others: increased insula and decreased medial prefrontal cortex activation during emotion processing in elite adventure racers. Social Cognitive and Affective Neuroscience, 10.1093/scan/nss127 [DOI] [PMC free article] [PubMed] [Google Scholar]
- Tucker R (2009). The anticipatory regulation of performance: the physiological basis for pacing strategies and the development of a perception-based model for exercise performance. British Journal of Sports Medicine, 43(6), 392–400. [DOI] [PubMed] [Google Scholar]
- Vaitl D (1996). Interoception. Biological Psychology, 42(1–2), 1–27. [DOI] [PubMed] [Google Scholar]
- von Leupoldt A, Chan PY, Bradley MM, Lang PJ, & Davenport PW (2011). The impact of anxiety on the neural processing of respiratory sensations. Neuroimage, 55(1), 247–252. 10.1016/j.neuroimage.2010.11.050 [DOI] [PMC free article] [PubMed] [Google Scholar]
- Waugh CE, Wager TD, Fredrickson BL, Noll DC, & Taylor SF (2008). The neural correlates of trait resilience when anticipating and recovering from threat. Social Cognitive and Affective Neuroscience, 3(4), 322–332. 10.1093/scan/nsn024 [DOI] [PMC free article] [PubMed] [Google Scholar]