

Abstract
Chronic alcoholism is associated with widespread regional differences from controls in brain activity and connectivity dynamics measured by blood-oxygen-level-dependent (BOLD) signals. Identification of alcoholism-related neurofunctional power dynamics using functional magnetic resonance imaging (fMRI) that relate to cognition and behavior may serve as biomarkers of alcoholism. Previously, resting-state fMRI studies examined BOLD signals at a single low-frequency (LF) bandwidth. BOLD signals, however, oscillate systematically at different frequencies and are organized in a resting brain where LF oscillation facilitates long-distance communication between regions across cortical regions, whereas high-frequency (HF) oscillation occurs in closely localized, subcortical areas. Using a frequency power quantification approach, we investigated whether the organization of BOLD signal oscillations across all measured frequency bandwidths is altered in alcoholism and relates to cognitive performance. Frequency-dependent oscillation power differences between 56 sober alcoholics and 56 healthy controls occurred for all frequency bands. Alcoholics exhibited greater frequency oscillation power in the orbitofrontal cortex and less power in the posterior insula within the HF bandwidth than controls. Aberrant orbitofrontal HF power was associated with poorer memory performance and slower psychomotor speed in alcoholics. Middle-frequency and LF power proved sensitive in detecting altered frequency oscillation dynamics in parietal and postcentral cortical regions of alcoholics. This study is novel in identifying alcohol-related differences in BOLD oscillation power of the full fMRI frequency bandwidth. Specifically, HF power aberrations were associated with poorer cognitive functioning in alcoholism and may serve as a biomarker for identifying neural targets for repair.
Keywords: alcoholics, BOLD oscillation, fMRI
INTRODUCTION
Chronic excessive alcohol consumption is known to affect neurophysiological and cognitive functions that contribute to self-awareness, attention, memory, reward and control over addictive behavior (Loeber et al. 2009; Müller-Oehring & Schulte 2014). These abilities are linked to specific functional brain systems including the executive control, salience, attention and reward networks (Camchong, Stenger, & Fein 2013; Courtney, Ghahremani, & Ray 2013; Weiland et al. 2013). Neural networks have been identified with functional connectivity methods measuring synchrony of spontaneous blood-oxygen-level-dependent (BOLD) fluctuations (Biswal et al. 1995). Typically, regional activation and functional connectivity analyses focus on a single low-frequency (LF) oscillation band, usually between 0.01 and 0.1 Hz, which are sensitive to BOLD fluctuation in cortical regions but exclude information from high-frequency (HF) bandwidths that are sensitive to BOLD fluctuation in subcortical regions (Malinen et al. 2010; Baria et al. 2011). To date, the effect of chronic alcoholism on BOLD-derived neurofunctional power dynamics across the whole frequency bandwidth has not been studied, and how the multi-band frequency power data relate to cognitive and motor abilities is unknown. Knowledge of these relations could lead to a mechanistic understanding of alcoholism-related impairment.
Information on alcohol-related regional brain disruption or sparing of other frequency bandwidths of the BOLD signal can be gained by employing the amplitude of low frequency fluctuation (ALFF) approach for analyzing resting-state functional magnetic resonance imaging (fMRI) data. ALFF measures the power spectrum intensity of intrinsically spontaneous BOLD frequency fluctuation (Zang et al. 2007), enabling quantification of the oscillatory BOLD signal along a broad range of frequencies and optimizing detection of localized dynamics of BOLD oscillation properties. Systematic frequency power distributions underlie the structural and functional organization of the human brain where greater LF frequency power occurs in cortical regions, whereas greater HF frequency power occurs in subcortical regions (Baria et al. 2011). In addition, specific power spectra reflect specific synaptic connections and brain states while resting or performing tasks (Baria et al. 2013). Altered frequency-specific power spectra have also been implicated in clinical diagnoses, including chronic pain, and depressive disorder (Malinen et al. 2010; Baliki, Baria, & Apkarian 2011; Yang et al. 2016). Moreover, a study of acute alcohol effects on motor and cognitive control functions in non-alcoholics found lower LF oscillation power in the cerebellum and superior frontal gyrus relative to their sober control condition (Zheng et al. 2015).
To date, studies of alcoholism using resting-state or task-activated fMRI analyses have not examined alterations in frequency-specific power of BOLD signal oscillation. For the first time, we used the frequency power analysis approach to examine power dynamics of spontaneous BOLD signals in alcoholic men and women compared with sex-matched and age-matched, lowdrinking controls. With previous frequency analyses (Buzsaki & Draguhn 2004; Esposito et al. 2013; Zhang et al. 2013), we divided the full frequency range of power spectrum into three sub-frequency bands with neurophysiological meanings: the LF band (0.01–0.027 Hz), the middle-frequency (MF) band (0.027– 0.073 Hz) and the HF band (0.073–0.198 Hz). We hypothesized that cortical regions would show greater LF power, whereas subcortical and limbic regions would have greater HF power independent of study group. Because frequency oscillation power has been linked to brain activities (Baria et al. 2013) and its specific power distribution to certain brain regions (Baria et al. 2011), we hypothesized that alcoholism-specific compromises in frequency power dynamics would be observed in HF power for subcortical salience regions and in LF and MF power for frontoparietal cortical cognitive control and reward regions. We further hypothesized that frequency power alterations would implicate cognitive abilities and behavioral performance including episodic memory and psychomotor speed, which are commonly affected in chronic alcoholism (Le Berre & Sullivan 2016).
MATERIALS AND METHODS
Subjects
The dataset comprised 56 alcoholic subjects (17 women) and 56 age-matched healthy controls (17 women) (Table 1). The 56 alcoholics were recruited from local rehabilitation or addiction treatment centers through advertisements, referral or word of mouth. The controls were volunteers from the local communities. All the subjects provided written informed consent to participate in this study. The recruitment and study procedures were approved by the Institutional Review Boards of Stanford University School of Medicine and SRI International.
Table 1.
Subject clinical and behavioral characteristics.
|
C |
ALC |
P | |||
|---|---|---|---|---|---|
| n | Mean ± SD | n | Mean ± SD | ||
| M/W | 39/17 | 39/17 | 1a | ||
| Age (years) | 56 | 51.7 ± 10.32 | 56 | 51.15 ± 10.27 | 0.778 |
| Education (years) | 54 | 15.57 ± 2.41 | 56 | 13.2 ± 2.51 | <0.001 |
| SES | 54 | 26.96 ± 11.87 | 56 | 42.3 ± 15.63 | <0.001 |
| Handedness (L/R/A) | 2/49/5 | 3/51/2 | 0.47a | ||
| Lifetime alcohol consumption (kg) | 56 | 45.5 ± 71.75 | 56 | 1173.54 ± 1004.67 | <0.001 |
| Days since last drink | 54 | 861.98 ± 3251.1 | 56 | 276.21 ± 719.55 | <0.001 |
| Days since last met diagnosis criteria | — | — | 56 | 75.58 ± 144.34 | — |
| AUDIT | 54 | 2.56 ± 2.61 | 51 | 17.55 ± 11.94 | <0.001 |
| Depressive symptoms score (BDI‒II) | 53 | 2.02 ± 2.93 | 56 | 8.82 ± 6.68 | <0.001 |
| Premorbid IQ (WTAR‒SS) | 48 | 110.4 ± 14.4 | 49 | 96.84 ± 19.42 | <0.001 |
| Logical memory I (WMS‒R) | 37 | 25.78 ± 7.22 | 41 | 18.68 ± 8.89 | <0.001 |
| Logical memory II (WMS‒R) | 37 | 22.22 ± 7.33 | 41 | 15.2 ± 8.7 | <0.001 |
| Total free recall (CVLT‒II) | 33 | 50.46 ± 9.08 | 35 | 41.83 ± 12.66 | 0.002 |
| Delayed free recall (CVLT‒II) | 33 | 11.3 ± 2.63 | 35 | 8.69 ± 3.8 | 0.002 |
| Graphomotor speed (WAIS‒R) | 32 | 56.94 ± 11.97 | 33 | 44.67 ± 13.61 | <0.001 |
| Time to complete DS (seconds) (WAIS‒R) | 32 | 151.59 ± 34.33 | 33 | 191.21 ± 53.47 | 0.001 |
| Scanner (3T Signa/MR750) | 26/30 | 25/31 | 0.85a | ||
A = ambidextrous; ALC = alcoholics; AUDIT = alcohol use disorders identification test; BDI‒II = Beck Depression Inventory; C = controls; CVLT‒ II = California Verbal Learning Test‒II; DS = Digit Symbol subtest; L = left; Logical memory I of the Wechsler Memory Scale‒Revised = immediate recall; Logical memory II of the Wechsler Memory Scale‒Revised = delayed recall; M = men; S = number; R = right; SD = standard deviation; SES = socioeconomic status: higher scores represent lower SES (range, 11–77); W = women; WAIS‒R = Wechsler Adult Intelligence Scale‒Revised; WMS‒R = Wechsler Memory Scale‒Revised; WTAR‒SS = standard score of the Wechsler Test of Adult Reading.
χ2 test; statistical significance level was set at P < 0.05.
Screening was conducted by clinical research psychologists or research nurses on the basis of the Structured Clinical Interview for DSM-IV (First et al. 2012). For all subjects, the exclusion factors were DSMIV criteria for other Axis I diagnoses. In the alcoholic group, 55 subjects met DSM-IV criteria for alcohol dependence, and one subject met criteria for alcohol abuse. Of those meeting dependence criteria, 35 were in early full remission (met no alcohol dependence criteria for <1 year), 12 were in sustained full remission (met no alcohol dependence criteria for >1 year), 5 were in early partial remission (met <3 alcohol dependence criteria within the past 12 months) and 4 did not meet remission criteria. The median number of weeks since alcoholics last met dependence criteria was 21.6 weeks [mean = 78.5 weeks, standard deviation (Padula et al., 2015) = 146.9 weeks]. The median age of alcoholism onset was 25 years [mean = 28.3, standard deviation (SD) = 12.6]. Fifty-five percent of alcoholics and 0 percent of controls met DSM-IV criteria for any type of drug dependence or abuse. The most common type of drug dependence or abuse among alcoholics was cocaine (endorsed by 38 percent of alcoholics), and the median number of weeks since last meeting drug dependence criteria was 406 weeks (mean = 646 weeks, SD = 557 weeks). Significantly more alcoholics met DSM-IV criteria for nicotine dependence (n = 41) than controls (n = 6), χ2(1) = 43.33, P < 0.001 (Fisher’s exact test).
Questionnaires, neuropsychological tests and clinical assessments were given before or after scanning and included socioeconomic status, alcohol use disorders identification test (AUDIT) (Babor et al. 2001), Beck Depression Inventory (BDI-II) (Beck, Steer, & Brown 1996), Wechsler Test of Adult Reading (WTAR) (Wechsler 2001), Wechsler Memory Scale-Revised (WMS-R) (Wechsler & Stone 1987), California Verbal Learning Test-II (CVLT-II) (Delis et al. 2000) and the Digit Symbol subtest of the Wechsler Adult Intelligence Scale-Revised (WAIS-R) (Wechsler 1981).
Imaging data acquisition
All resting-state data required subjects to have their eyes open while in one of two General Electric (Boston, MA, USA) human MRI systems (3T Signa and MR750) with an eight-channel head coil and the same acquisition parameters. MRI scanner system was modeled as a covariate in a separate group-ALFF analysis. Ear plugs and noise-cancelling headphones were used to help reduce the noise from the scanner. The number of subjects scanned by each scanner is shown in Table 1.
Whole-brain rs-fMRI data were acquired with a T2*weighted gradient echo-planar pulse sequence [2D axial; echo time (TE) = 30 ms; repetition time (TR) = 2200 ms; flip angle = 90°; field of view (FOV) = 240 mm; in-plane resolution = 3.75 mm; matrix = 64 × 64; slice thickness = 5 mm; skip = 0 mm; 36 slices]. A dual-echo fast spin-echo scan was obtained for spatial registration using the following parameters: 2D axial; TE = 17 / 102 ms; TR = 5000 ms; flip angle = 90°; FOV = 240 mm; matrix = 256 × 256; slice thickness = 5 mm; skip = 0 mm; 36 slices. To correct for spatial distortions in the echoplanar images, we acquired a field map with a gradientrecalled echo sequence pair (TE = 3/5 ms; TR = 460 ms, slice thickness = 5 mm; skip = 0 mm; 36 slices).
Image preprocessing
Rs-fMRI data preprocessing was performed using STATISTICAL PARAMETRIC MAPPING 8 (SPM8) software Wellcome Trust Centre for Neuroimaging; London, UK; http://www.fil.ion.ucl.ac.uk/spm/software/spm8/). Images were first converted from DICOM into NIFTI format followed by spatial realignment and unwarping of echoplanar images to correct for geometric distortion and head motion. For further analysis, datasets of the 112 subjects had to have motion less than 1.7-mm translation in x, y and z and not exceed 2° rotation in all three directions. Frame-wise displacement values were calculated for individual scans, the maximum displacement was 1.88 and the largest individual mean displacement value was 0.27. Given the lack of consensus in the literature on motion thresholds for scan exclusion (Power, Schlaggar, & Petersen 2015), we followed previous recommendations (e.g., Power et al. 2012). The mean unwarped functional images were co-registered with the fast spin-echo anatomical images for each subject. The unwarped functional and anatomical images were then normalized to the standard Montreal Neurological Institute space and resampled to a voxel size of 2 × 2 × 2 mm. A Gaussian kernel of 8-mm full-width at half-maximum was applied to the normalized functional images.
ALFF calculation
Preprocessed functional images were imported into DPARSF 4.0 Advanced toolbox (Data Processing & Analysis of Brain Imaging; http://rfmri.org/dpabi; ChaoGan Yan, New York, NY, USA) (Yan et al. 2016) for ALFF calculation. For the frequency power spectrum to be obtained, the time series of each voxel within the individual functional images was transformed into the frequency domain using a fast Fourier transform (Zang et al. 2007). The full frequency range was then divided into three frequency bands—LF (0.01–0.027 Hz), MF (0.027–0.073 Hz) and HF (0.073–0.198 Hz)—for further ALFF value calculation (Buzsaki & Draguhn 2004; Esposito et al. 2013; Zhang et al. 2013). For a given voxel, the absolute value of the frequency power spectrum was averaged across the predefined frequency band (Zang et al. 2007). Note that the scrubbing approach (Power et al. 2015), endorsed to correct for outlier frames in resting-state time series analysis, is not recommended for ALFF analysis, because the ALFF calculation is based on fast Fourier transform, which cannot be applied to scrubbed data owing to alteration of its temporal structure by removal of frames (Yan et al. 2013). Instead, we used standardized zALFF individuals maps, on the basis of evidence showing reduced motion effects at individual level and increased test–retest reliability with Z-standardization at group analyses (Zuo et al. 2010; Yan et al. 2013). For Z-standardization, we normalized the ALFF value for each voxel by subtracting the global mean of the ALFF value, and then the value was divided by the SD (Yan et al. 2013). In addition, we compared the non-normalized ALFF value of each voxel between alcoholics and controls. There was no significant group difference in the non-normalized ALFF values. Therefore, significant group differences in normalized ALFF comparisons cannot be due to different global means between alcoholics and controls.
ALFF analysis modeling
Individual standardized ALFF maps were implemented in a full-factorial analysis of covariance in SPM8. A secondlevel full-factorial model was used to examine the ALFF differences between the three predefined frequency bands and between alcoholics and controls in each of the three specific frequency bands. Independent groups (controls and alcoholics) and dependent frequency bands (LF, MF and HF) were modeled as factors. The frame-wise displacement values of each individual were calculated by ArtRepair tool (http://cibsr.stanford.edu/tools/human-brain-project/artrepair-software/artrepairinstructions.html) using the six realignment parameters. Alcoholics had on average greater frame-to-frame displacement values than controls (mean displacement: controls 0.088 mm/TR, alcoholics 0.112 mm/TR; SD, controls 0.036, alcoholics 0.05 ; P = 0.005). The group difference in frame-wise displacement was small and remained within two voxels shifting. As recommended by Yan et al. (2013), Fair et al. (2012) and Kong et al. (2014) for ALFF group statistics to control for residual motion in the second-level group analysis, we modeled the individual mean frame-wise displacement in addition to individual age, and type of GE scanner as covariates. An explicit gray matter mask created on the basis of the automated anatomical labeling template from MRIcro (http://www.mccauslandcenter.sc.edu/mricro/mricro/template.html) was applied to the model.
Between-frequency ALFF analyses
With previous research showing ALFF value differences across frequency bands (Wang et al. 2016), we specified SPM t-contrasts between the three predefined frequency bands to examine such differences in ALFF values to reflect the frequency dynamics (HF versus MF, HF versus LF and MF versus LF) in our full-factorial model independent of group differences.
Between-group ALFF analyses
Group-difference contrasts were specified for controls > alcoholics and alcoholics > controls (SPM t-contrast) to examine whether ALFF values for each predefined frequency band were greater or less in the alcoholic group than in the controls.
Statistical significance for ALFF maps
To account for multiple comparisons, frequency and group-difference results were corrected by performing Monte Carlo simulation for two-tailed comparisons as implemented in 3dClustSim (https://afni.nimh.nih.gov/pub/dist/doc/program_help/3dClustSim.html; Robert W. Cox, Bethesda, MD, USA). For this, smoothness parameters of the residual image were calculated using the AFNI program 3dFWHMx (https://afni.nimh.nih.gov/pub/dist/doc/program_help/3dFWHMx.html) and entered into 3dClustSim calculation with 10 000 iterations, and peak threshold probability of 0.005 (t = 2.81; two-tailed). A significantly statistical threshold of P < 0.05 corrected for multiple comparisons required a contiguous cluster size greater than 131 voxels. This statistical cluster threshold for multiple comparison correction was applied to all second-level t-tests.
Statistical analyses of group characteristics
Independent samples t-tests were conducted using IBM SPSS v.23 (Armonk, NY, USA) to examine group differences in education, socioeconomic status, lifetime alcohol consumption, days since last drink, AUDIT score, BDI-II score, premorbid IQ (WTAR Standard Score), logical memory (WMS-R total raw score), verbal memory (CVLT-II total free recall score) and graphomotor speed (WAIS-R Digit Symbol) (Table 1). The neuropsychological test scores (premorbid IQ, logical memory, verbal memory and graphomotor speed) were correlated with frequency oscillation power (extracted ALFF values of the regions that showed significant group differences) by using Pearson correlation in IBM SPSS v.23. A statistical significance level was set at P < 0.05 after correcting for multiple comparisons using false discovery rate (FDR) (Benjamini, Krieger, & Yekutieli 2006).
RESULTS
ALFF value differences between frequency bands
Independent of diagnosis, differences in frequency power were identified between the three different pairs of frequency bands (LF, MF and HF). Subcortical regions (amygdala, hippocampus, parahippocampus, caudate head, pallidum and insula), anterior temporal lobules, rectus, anterior cingulate cortex, superior frontal cortex (BA8) and cerebellum showed greater oscillation power in the HF than in LF band. By contrast, the posterior cortical (occipital, parietal lobules, angular, supramarginal gyrus, precuneus, posterior cingulate cortex and sensorimotor cortex) and mid-frontal regions (BA46) showed greater frequency fluctuation power in the LF than in HF band (Fig. 1a).
Figure 1.
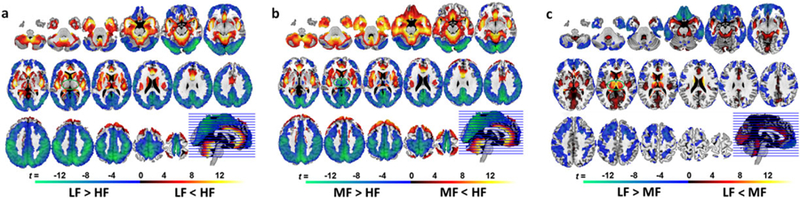
Whole-brain spatial frequency power distribution. Frequency-specific power spectra maps across all subjects for (a) low-frequency (LF) band versus high-frequency (HF) band; (b) middle-frequency (MF) band versus HF band; (c) LF band versus MF band. The frequency power differences depicted here reflect regional physiological properties and regional specificity to certain frequency bands. The rainbow color bar indicates relative ALFF values. The green–blue–red–yellow color bar represents t-scores ≥ 2.81 (Ppeak = 0.005, two-tailed) indicative of significant frequency power differences in the paired comparisons between the three frequency bands
When comparing HF and MF bands, the differences in frequency power distribution patterns (Fig. 1b) were similar to the ones observed between HF and LF bands (Fig. 1a) except for the thalamus. The thalamus showed greater frequency power in the MF band than in the HF band (Fig. 1b).
When comparing MF and LF bands, the frequency power for MF was greater in thalamic and striatal-limbic regions (hippocampus, amygdala, putamen and caudate), the occipital lobe (constrained in calcarine, cuneus and lingual gyrus), posterior insula and anterior cingulate cortex (Fig. 1c). By contrast, the ALFF values for LF were higher in the cortical regions including the parietal, inferior occipital, inferior temporal, superior frontal (BA6/8), sensorimotor, rectus and orbitofrontal (BA10/11/47) cortices (Fig. 1c).
ALFF value differences between groups
Significant differences in oscillation power between controls and alcoholics were observed in each of the three frequency bands. Within the HF band, the alcoholic group had greater frequency oscillation power in the orbitofrontal cortex (BA10/11/47) and lower power in the posterior insula than the controls (Table 2 and Fig. 2).
Table 2.
Significant group differences in ALFF values within frequency bands.
| Regions | H | k |
MNI coordinates |
t‒ score | Z‒score | |||
|---|---|---|---|---|---|---|---|---|
| x | y | z | ||||||
| HF (0.073–0.198 Hz) | ||||||||
| C > ALC | Posterior insulaa | R | 182 | 42 | 8 | −20 | 4.56 | 4.48 |
| 40 | −6 | 2 | 3.72 | 3.68 | ||||
| 38 | −6 | −6 | 3.64 | 3.6 | ||||
| ALC > C | Orbitofrontal cortex (BA10/11/47) | L | 126 | −26 | 54 | 0 | 3.77 | 3.73 |
| MF (0.027–0.073 Hz) | ||||||||
| C > ALC | Angular/supramarginal gyrus | R | 131 | 44 | −56 | 36 | 4.03 | 3.98 |
| 56 | −60 | 30 | 3.14 | 3.11 | ||||
| 50 | −64 | 36 | 2.95 | 2.93 | ||||
| ALC > C | Posterior inferior/middle temporal lobulea | L | 128 | −58 | −64 | ‒14 | 4.65 | 4.57 |
| LF (0.01–0.027 Hz) | ||||||||
| C > ALC | Supramarginal gyrusa | R | 254 | 52 | −26 | 26 | 3.84 | 3.79 |
| 62 | ‒22 | 32 | 3.63 | 3.59 | ||||
| 60 | ‒26 | 40 | 3.6 | 3.57 | ||||
| Supramarginal gyrus/inferior/superior | R | 161 | 42 | ‒42 | 62 | 4.33 | 4.27 | |
| Parietal cortex | 28 | ‒38 | 44 | 3.82 | 3.77 | |||
| ALC > C | Postcentral cortexa | L | 285 | ‒46 | ‒28 | 56 | 4.69 | 4.61 |
| ‒26 | ‒30 | 66 | 3.43 | 3.4 | ||||
| Posterior inferior/middle temporal lobulea | L | 153 | ‒58 | ‒62 | ‒10 | 4.91 | 4.82 | |
| ‒68 | ‒48 | ‒8 | 3.75 | 3.71 | ||||
ALC = alcoholics; ALFF = amplitude of low frequency fluctuation; BA = Brodmann area; C = controls; H = hemisphere; k = number of brain voxels in a cluster; L = left; MNI = Montreal Neurological Institute coordinates (x, y and z) for peak voxels within a significant cluster; R = right. Note: Results were confirmed with reslicing into 3 × 3 × 3 voxel space.
For t = 3.38, Ppeak = 0.001, two‒tailed, cluster‒corrected for multiple comparisons at Pcorrected < 0.05.
Figure 2.
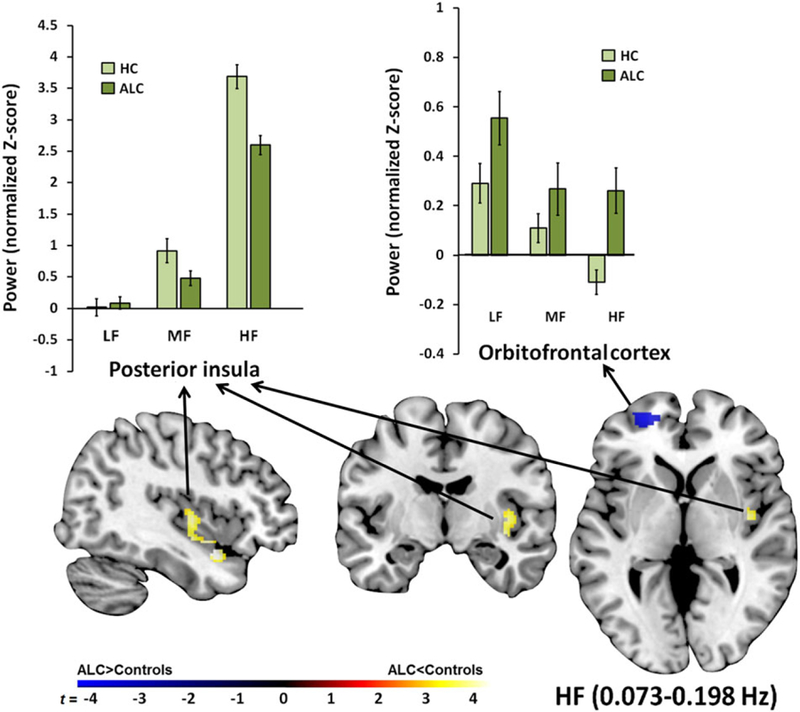
Regional high-frequency (HF) power differences between alcoholics and controls. The alcoholics (ALC) had greater HF power in the orbitofrontal cortex compared with controls. Although HF was the dominant frequency power spectrum in the posterior insula for controls and ALC, ALC exhibited less HF power in this region than controls. The color bar indicates t-scores for group differences of frequency power. The bar graphs show normalized Z-scores for ALFF power extracted from each significant cluster for each group and frequency band. LF, low frequency; MF, middle frequency
Within the MF band, alcoholics had higher ALFF values in the posterior inferior/middle temporal lobules and less oscillation power in the angular and supramarginal gyri than controls (Table 2 and Fig. 3).
Figure 3.
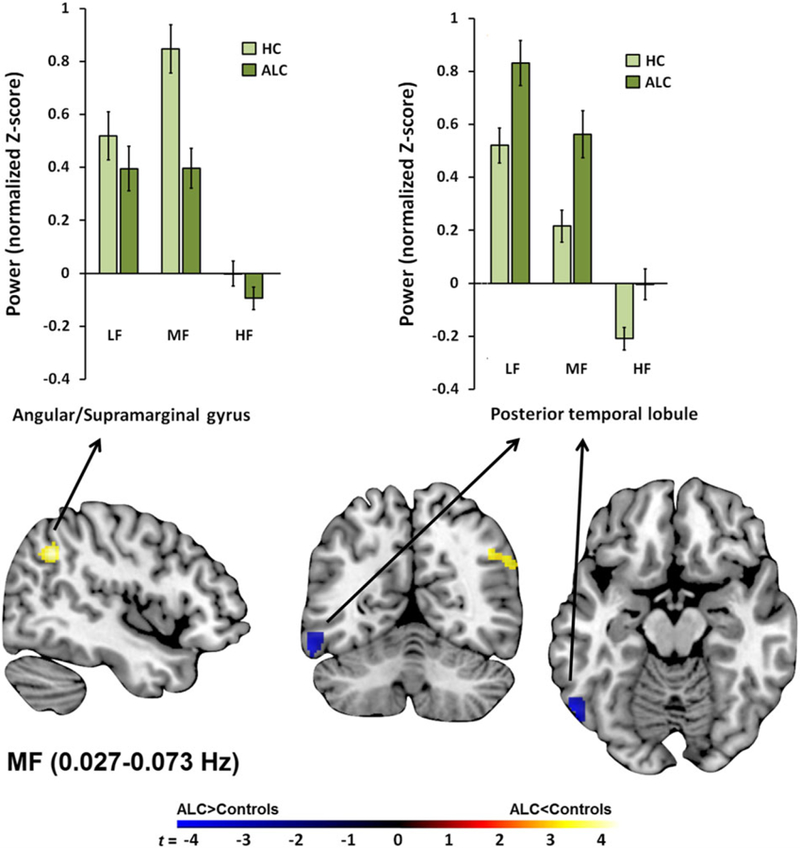
Regional middle-frequency (MF) power differences between alcoholics (ALC) and controls. Depicted are significant group differences showing greater MF power in the postcentral and posterior temporal cortices and less MF power in the angular/supramarginal gyrus in ALC relative to controls. HF, high frequency; LF, low frequency
Within the LF band, alcoholics showed greater frequency oscillation power in the temporal lobules and postcentral cortex than the controls (Table 2 and Fig. 4), similar to the results observed within the MF band. In addition, alcoholics had lower ALFF values than controls in the supramarginal gyrus and inferior/superior parietal cortex within the LF band (Table 2 and Fig. 4).
Figure 4.
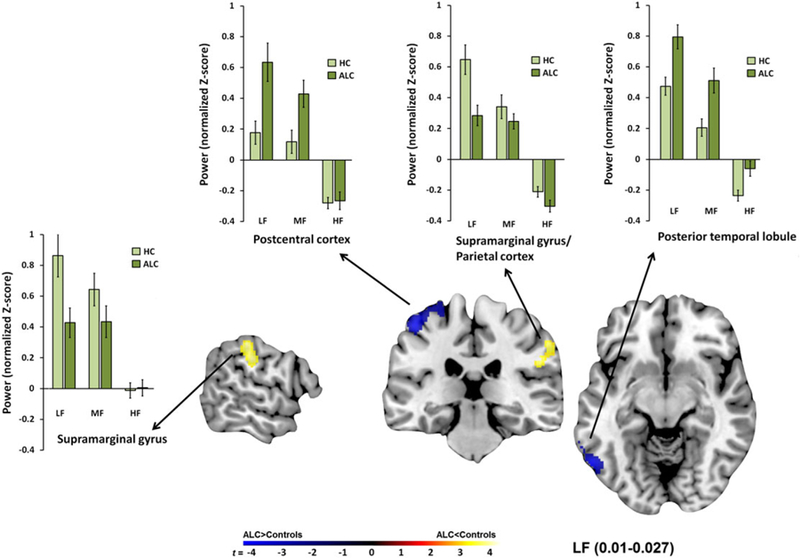
Regional low-frequency (LF) power differences between alcoholics (ALC) and controls. The cortical regions were dominated by LF power in controls and ALC. Depicted here are significant group differences showing that ALC relative to controls had greater LF power in the postcentral and posterior temporal cortices and had lower LF power in the parietal cortex. HF, high frequency; MF, middle frequency
Testing whether observed group differences in ALFF power (Table 2) are due to group differences in motion, we correlated residual motion values with regional ALFF power. Mean frame-wise displacement correlated with greater HF orbitofrontal ALFF power, but not differently between groups (controls: r = 0.29, P = 0.03; alcoholics: r = 0.27, P = 0.046; z = 0.11, P = 0.91). There was no significant relationship between motion and ALFF power in any of the other regions in either group. For orbitofrontal HF ALFF power, residual motion accounted for 7 percent of the variance. It did not, however, explain the observed group differences, which remained significant after controlling for motion.
Clinical and behavioral characteristics
Compared with controls, alcoholics had consumed significantly more alcohol (P < 0.001), reported more harmful patterns of alcohol usage as measured by the AUDIT (P < 0.001), more depressive symptoms (BDI-II) (P < 0.001), had lower premorbid IQ as measured by the WTAR (P < 0.001), lower logical memory scores for immediate (P < 0.001) and delayed recall (P < 0.001) as measured by the WMS-R (P < 0.001) , lower verbal memory scores for total free recall (P = 0.002) and delayed free recall (P = 0.002) as measured by the CVLT-II and slower graphomotor speed (P < 0.001) reflecting longer time taken to complete the WAIS-R Digit Symbol subtest (P = 0.001). Alcoholics also had fewer years of education (P < 0.001) and lower socioeconomic status (P < 0.001) than controls (Table 1). These comparisons between alcoholics and controls remained significant when using education as a covariate.
ALFF correlation with behavioral tasks and clinical characteristics
In alcoholics, the higher HF orbitofrontal power in alcoholics correlated with poorer logical memory for immediate recall (r = 0.505, P unc = 0.001 , PFDRc = 0.0007) and delayed recall (r = 0.483 , Punc = 0.001, PFDRc = 0.013), poorer verbal memory for total free recall (r = 0.626, Punc < 0.001 , PFDRc = 0.001) and delayed free recall (r = 0.596, Punc-0.001, PFDRc = 0.001), slower graphomotor speed (r = 0.475, Punc = 0.005, PFDRc = 0.047) and longer time to complete the Digit Symbol test (r = 0.537 ,frequency; MF, middle frequency Punc = 0.001, PFDRc = 0.012). In controls, lower HF power of left orbitofrontal cortex was correlated with higher premorbid IQ (left: r = 0.466, Punc = 0.001, PFDRc = 0.008).
DISCUSSION
We systematically evaluated frequency-dependent changes in BOLD signal oscillation power across three physiological frequency bands in alcoholics and controls and identified regionally specific frequency aberrations in alcoholics that were associated with compromised neuropsychological performance, in particular, memory functions. Relatively localized subcortical brain regions had the highest oscillation power within the HF band, while cortical regions exhibited most oscillation power within the LF band. These fundamental frequency power dynamics were present in both alcoholics and controls. Importantly, our full frequency bandwidth examination revealed significant alcoholism-related differences in frequency-dependent power spectrum dynamics that involved the orbitofrontal cortex, parietal cortex, supramarginal gyrus, postcentral cortex and posterior insula, regions that play roles in cognitive, visuospatial, somatosensory and reward-processing functions and are commonly compromised in alcoholism. Indeed, low scores on psychomotor and episodic memory tests in alcoholics were significantly related to the aberrant orbitofrontal HF power.
BOLD signal oscillation power dynamics are frequency specific for both groups
Resting-state fMRI analyses typically focus on LF and MF spectra, usually below 0.08 Hz. Expanding this range to identify regional information of HF oscillation power revealed the frequency-dependent power spectrum organization and novel findings implicating physiological mechanisms for some alcoholism-related deficits. Comparing MF and LF bands, MF power was higher in subcortical regions and LF power higher in cortical regions, which was consistent with previous studies (Chen et al. 2015; Wang et al. 2016). Contrasting the HF with the LF bands enhanced the distinction of frequency power spectra between cortical and subcortical areas (shown between Fig. 1a and c). This observation supports the position that brain regions have their own distinctive power distribution properties. With converging evidence from two other studies (Wang et al. 2014; Xue et al. 2014), our results also suggest a specific functional role of the thalamus that is characterized by MF power. We infer that the MF specificity for the thalamus may reflect inherent thalamic neuronal rhythmicity (Steriade et al. 1993), supporting its role in relaying information from cortical and subcortical areas.
Although the link between the frequency-specific oscillation power distribution and physiological functions is not yet fully understood, studies have suggested that neuronal properties and cytoarchitectonic complexity may contribute to regional frequency characteristics of BOLD oscillation power. LF signals usually arise from neurons that serve long-distance connections in largerscale neural networks. Neurons with more complexity confined in a smaller neuronal space usually involve HF BOLD oscillation (Buzsaki & Draguhn 2004; Baria et al. 2011; Chen et al. 2015; Wang et al. 2016). With these differences, exploration of these organized oscillation properties may identify abnormal neuronal activities and understand the pathophysiology of diseases.
Aberrant frequency oscillation power in alcoholism
Frequency oscillation power in alcoholics was different from that in controls in several cortical regions, most notably the orbitofrontal cortex. Previously, the LF power abnormality in orbitofrontal cortex has been observed in people with depressive disorder (Zhang et al. 2016) and antisocial personality disorder (Liu et al. 2014b). Yet our results showed that aberrant frequency power in orbitofrontal cortex occurred in particular within the HF bandwidth. This emphasizes the relevance of insult in alcoholism in regard to spontaneous intrinsic BOLD oscillations and their underlying neuronal activities of the orbitofrontal cortex.
The orbitofrontal cortex is structurally and functionally connected to subcortical reward-associated and arousal-associated regions including amygdala, hippocampus, ventral striatum and nucleus accumbens (Barbas 2007) and engages in sensory integration, reward processing, memory and reward-related decision making using subcortico-cortical connections (Kringelbach 2005; Goldstein & Volkow 2011; Wikenheiser & Schoenbaum 2016). Some fMRI studies have shown aberrations of orbitofrontal BOLD signals in alcoholics, who exhibited greater orbitofrontal cortex activation than controls in response to alcohol-related stimuli (Tapert et al. 2003), a pattern that correlated with higher subjective alcohol craving (Myrick et al. 2004), suggesting that hyperactivation of the orbitofrontal cortex can contribute to increased reward expectancy and addictive behaviors. Aberration in orbitofrontal neurofunctional dynamics in the HF band could affect inter-regional communication. For example, we recently showed that alcoholics had greater functional connectivity than controls between inferior prefrontal/orbitofrontal cortex (BA11/47) and anterior cingulate cortex (Müller-Oehring et al. 2014), a hub in the salience network, shaping the interaction of rewardassociated behaviors with incentive salience in alcoholics.
Notably, greater orbitofrontal HF power in alcoholics was associated with poorer verbal memory, logical memory and graphomotor abilities. Although the role of the orbitofrontal cortex is not directly associated with these abilities, HF power predominant regions such as hippocampus and striatum, which are functionally connected to the orbitofrontal cortex, do play important roles in memory, learning and motor function (Mattfeld & Stark 2015). Overall, the increased orbitofrontal oscillation power in the alcoholic brain might index a shift in its frequency power distribution and serve as a neural marker for a greater engagement of reward system nodes at the expense of perceptual-motor and memory processing efficiency.
Another brain region that plays an integrator role between subcortical limbic-striatal and cortical regions is the insular cortex. We observed aberrant frequency power of the posterior insula in the alcoholic brain in the HF band, which is sensitive in detecting subcortical regional oscillation power. The link between insula and alcoholism has been widely demonstrated: the insula has various roles in alcohol-related cue processing, reward-related decision making, craving, conscious awareness and interoception (Garavan 2010; Naqvi et al. 2014). Further, the posterior insula, functionally connected to sensorimotor cortex, is responsible for relaying primary motor and sensory information to the sensorimotor cortex and the anterior insula (Cauda et al. 2011). Recently, Migliorini et al. (2013) demonstrated that people with substance use disorders including alcoholics had attenuated posterior insula activation in response to sensory stimulation. This finding is consistent with attenuated perfusion of the insula detected with arterial spin labeling in alcoholics (Sullivan et al. 2013). The observed diagnosis-specific difference in HF oscillation power of the posterior insula adds to previous results and emphasizes the functional role of this region in alcoholism. Altered frequency oscillation power in brain regions that link subcortico-cortical circuits may reflect aberrations in intrinsic neuronal rhythmicity (Steriade et al. 1993) and affect how information is converged from cortical and subcortical areas.
Group differences for MF and LF oscillation power were observed in posterior brain regions where alcoholics exhibited greater left postcentral and occipito-temporal ALFF power and less right parietal ALFF power than controls. Studying resting-state default mode network relative to active task-engaged networking in alcoholism, Chanraud et al. (2011) previously observed stronger connectivity between the posterior cingulate cortex and the postcentral cortex during a spatial working memory task in alcoholics relative to controls. Similarly, Krienke et al. (2014) found greater posterior cingulate cortex connectivity to postcentral and temporal regions in sober alcoholics than controls while viewing alcohol-related video sequences stimulating cue-induced cravings. Even during simple motor tasks, alcoholics were found to recruit additional postcentral and temporal regions in contrast to controls (Parks et al. 2010). Thus, alcoholics in these studies exhibited similar task-activated posterior regional activation patterns not seen in controls. In our study, however, spontaneous fluctuations of the BOLD response were observed during rest and not in response to a task. Accordingly, the identified group differences may essentially describe a shift in the regional BOLD frequency power spectrum in chronic alcoholics with potential consequences for abnormal inter-regional synchronization when tasks engage posterior brain networks, e.g., when comparing incoming visual stimuli with experiences (Krienke et al. 2014). Finally, we observed less LF oscillation power in the parietal cortex including the supramarginal gyrus in alcoholics than in controls. Compromise of parietal regions in alcoholism has been previously associated with impairments of working memory, visuospatial and attentional abilities (Stavro, Pelletier, & Potvin 2013). These findings lead to the speculation that BOLD frequency power dynamics depend on the relative role a region plays within cortico-cortical and subcortico-cortical networks and that the pattern of intrinsic regional frequency power aberration may be indicative of altered neurobiological mechanisms in alcoholism.
Gray matter volume deficits occur in chronic alcoholism (Grodin et al. 2013) and can be a confounding factor for rs-fMRI functional connectivity and taskevoked BOLD signal analysis. However, the frequency oscillation power analyses used in the current study is relatively insensitive to structural alterations with limited effect on frequency power results (Aiello et al. 2015; Liu et al. 2014a). Therefore, the main results found in the current study were unlikely due to structural differences in alcoholics compared with controls. One limitation was that one-third of the sample had incomplete neuropsychological datasets; yet the sample size for the significant FDR-corrected correlation results was never fewer than 32 per group.
In summary, we demonstrated that the frequency power spectra detected with BOLD were systematically organized within the subcortical and cortical regions. This architecture likely reflects inherent neurophysiological properties (Buzsaki & Draguhn 2004) and therefore can provide novel insights about the frequency-specific aberrations of these regional oscillation power dynamics to explain alcoholism-related impairments of reward, visuomotor, memory and sensory processing. Our findings emphasize the value of taking the full frequency bandwidth into account to unveil the intrinsic pathophysiological mechanisms that may serve as potential biomarkers for identifying mechanisms of cognitive impairment in chronic alcoholism.
Acknowledgement
The authors declare no competing financial interests. This study is supported by National Institutes of Health grants AA023165, AA017168 and AA005965.
References
- Aiello M, Salvatore E, Cachia A, Pappata S, Cavaliere C, Prinster A, Nicolai E, Salvatore M, Baron JC, Quarantelli M (2015) Relationship between simultaneously acquired resting-state regional cerebral glucose metabolism and functional MRI: a PET/MR hybrid scanner study. Neuroimage 113:111–121. [DOI] [PubMed] [Google Scholar]
- Babor T, Higgins-Biddle JC, Saunders JB, Monteiro MG (2001) AUDIT—The Alcohol Use Disorders Identification Test: Guidelines for Use in Primary Care World Health Organizaton Department of Mental Health and Substance Abuse: Geneva. [Google Scholar]
- Baliki MN, Baria AT, Apkarian AV (2011) The cortical rhythms of chronic back pain. J Neurosci 31:13981–13990. [DOI] [PMC free article] [PubMed] [Google Scholar]
- Barbas H (2007) Flow of information for emotions through temporal and orbitofrontal pathways. J Anat 211:237–249. [DOI] [PMC free article] [PubMed] [Google Scholar]
- Baria AT, Baliki MN, Parrish T, Apkarian AV (2011) Anatomical and functional assemblies of brain BOLD oscillations. J Neurosci 31:7910–7919. [DOI] [PMC free article] [PubMed] [Google Scholar]
- Baria AT, Mansour A, Huang L, Baliki MN, Cecchi GA, Mesulam MM, Apkarian AV (2013) Linking human brain local activity fluctuations to structural and functional network architectures. Neuroimage 73:144–155. [DOI] [PMC free article] [PubMed] [Google Scholar]
- Beck AT, Steer RA, Brown GK (1996) BDI-II, Beck Depression Inventory: Manual Psychological Corp: Harcourt Brace: San Antonio, Tex.; Boston. [Google Scholar]
- Benjamini Y, Krieger AM, Yekutieli D (2006) Adaptive linear step-up procedures that control the false discovery rate. Biometrika 93:491–507. [Google Scholar]
- Biswal B, Yetkin FZ, Haughton VM, Hyde JS (1995) Functional connectivity in the motor cortex of resting human brain using echo-planar MRI. Magn Reson Med 34:537–541. [DOI] [PubMed] [Google Scholar]
- Buzsaki G, Draguhn A (2004) Neuronal oscillations in cortical networks. Science 304:1926–1929. [DOI] [PubMed] [Google Scholar]
- Camchong J, Stenger A, Fein G (2013) Resting-state synchrony in long-term abstinent alcoholics. Alcohol Clin Exp Res 37:75–85. [DOI] [PMC free article] [PubMed] [Google Scholar]
- Cauda F, D’Agata F, Sacco K, Duca S, Geminiani G, Vercelli A (2011) Functional connectivity of the insula in the resting brain. Neuroimage 55:8–23. [DOI] [PubMed] [Google Scholar]
- Chanraud S, Pitel AL, Pfefferbaum A, Sullivan EV (2011) Disruption of functional connectivity of the default-mode network in alcoholism. Cereb Cortex 21:2272–2281. [DOI] [PMC free article] [PubMed] [Google Scholar]
- Chen YC, Xia W, Luo B, Muthaiah VP, Xiong Z, Zhang J, Wang J, Salvi R, Teng GJ (2015) Frequency-specific alternations in the amplitude of low-frequency fluctuations in chronic tinnitus. Front Neural Circuits 9:67. [DOI] [PMC free article] [PubMed] [Google Scholar]
- Courtney KE, Ghahremani DG, Ray LA (2013) Fronto-striatal functional connectivity during response inhibition in alcohol dependence. Addict Biol 18:593–604. [DOI] [PMC free article] [PubMed] [Google Scholar]
- Delis DC, Kramer J, Kaplan E, Ober BA (2000) CVLT-II: California Verbal Learning Test: Adult Version Psychological Corporation. [Google Scholar]
- Esposito F, Tessitore A, Giordano A, De Micco R, Paccone A, Conforti R, Pignataro G, Annunziato L, Tedeschi G (2013) Rhythm-specific modulation of the sensorimotor network in drug-naive patients with Parkinson’s disease by levodopa. Brain 136:710–725. [DOI] [PubMed] [Google Scholar]
- Fair DA, Nigg JT, Iyer S, Bathula D, Mills KL, Dosenbach NU, Schlaggar BL, Mennes M, Gutman D, Bangaru S, Buitelaar JK, Dickstein DP, Di Martino A, Kennedy DN, Kelly C, Luna B, Schweitzer JB, Velanova K, Wang YF, Mostofsky S, Castellanos FX, Milham MP (2012) Distinct neural signatures detected for ADHD subtypes after controlling for micromovements in resting state functional connectivity MRI data. Front Syst Neurosci 6:80. [DOI] [PMC free article] [PubMed] [Google Scholar]
- First MB, Spitzer RL, Gibbon M, Williams JBW (2012) Structured Clinical Interview for DSM-IV® Axis I Disorders (SCID-I), Clinician Version American Psychiatric Publishing: Administration Booklet. [Google Scholar]
- Garavan H (2010) Insula and drug cravings. Brain Struct Funct 214:593–601. [DOI] [PubMed] [Google Scholar]
- Goldstein RZ, Volkow ND (2011) Dysfunction of the prefrontal cortex in addiction: neuroimaging findings and clinical implications. Nat Rev Neurosci 12:652–669. [DOI] [PMC free article] [PubMed] [Google Scholar]
- Grodin EN, Lin H, Durkee CA, Hommer DW, Momenan R (2013) Deficits in cortical, diencephalic and midbrain gray matter in alcoholism measured by VBM: effects of co-morbid substance abuse. Neuroimage Clin 2:469–476. [DOI] [PMC free article] [PubMed] [Google Scholar]
- Kong XZ, Zhen Z, Li X, Lu HH, Wang R, Liu L, He Y, Zang Y, Liu J (2014) Individual differences in impulsivity predict head motion during magnetic resonance imaging. PLoS One 9: e104989. [DOI] [PMC free article] [PubMed] [Google Scholar]
- Krienke UJ, Nikesch F, Spiegelhalder K, Hennig J, Olbrich HM, Langosch JM (2014) Impact of alcohol-related video sequences on functional MRI in abstinent alcoholics. Eur Addict Res 20:33–40. [DOI] [PubMed] [Google Scholar]
- Kringelbach ML (2005) The human orbitofrontal cortex: linking reward to hedonic experience. Nat Rev Neurosci 6:691–702. [DOI] [PubMed] [Google Scholar]
- Le Berre AP, Sullivan EV (2016) Anosognosia for memory impairment in addiction: insights from neuroimaging and neuropsychological assessment of metamemory. Neuropsychol Rev [DOI] [PMC free article] [PubMed] [Google Scholar]
- Liu C, Li C, Yin X, Yang J, Zhou D, Gui L, Wang J (2014a) Abnormal intrinsic brain activity patterns in patients with subcortical ischemic vascular dementia. PLoS One 9: e87880. [DOI] [PMC free article] [PubMed] [Google Scholar]
- Liu H, Liao J, Jiang W, Wang W (2014b) Changes in lowfrequency fluctuations in patients with antisocial personality disorder revealed by resting-state functional MRI. PLoS One 9: e89790. [DOI] [PMC free article] [PubMed] [Google Scholar]
- Loeber S, Vollstadt-Klein S, von der Goltz C, Flor H, Mann K, Kiefer F (2009) Attentional bias in alcohol-dependent patients: the role of chronicity and executive functioning. Addict Biol 14:194–203. [DOI] [PubMed] [Google Scholar]
- Malinen S, Vartiainen N, Hlushchuk Y, Koskinen M, Ramkumar P, Forss N, Kalso E, Hari R (2010) Aberrant temporal and spatial brain activity during rest in patients with chronic pain. Proc Natl Acad Sci U S A 107:6493–6497. [DOI] [PMC free article] [PubMed] [Google Scholar]
- Mattfeld AT, Stark CEL (2015) Functional contributions and interactions between the human hippocampus and subregions of the striatum during arbitrary associative learning and memory. Hippocampus 25:900–911. [DOI] [PMC free article] [PubMed] [Google Scholar]
- Migliorini R, Stewart JL, May AC, Tapert SF, Paulus MP (2013) What do you feel? Adolescent drug and alcohol users show altered brain response to pleasant interoceptive stimuli. Drug Alcohol Depend 133:661–668. [DOI] [PMC free article] [PubMed] [Google Scholar]
- Müller-Oehring EM, Schulte T (2014) Cognition, emotion, and attention. Handb Clin Neurol 125:341–354. [DOI] [PubMed] [Google Scholar]
- Müller-Oehring EM, Jung YC, Pfefferbaum A, Sullivan EV, Schulte T (2014) The resting brain of alcoholics. Cereb Cortex [DOI] [PMC free article] [PubMed] [Google Scholar]
- Myrick H, Anton RF, Li X, Henderson S, Drobes D, Voronin K, George MS (2004) Differential brain activity in alcoholics and social drinkers to alcohol cues: relationship to craving. Neuropsychopharmacology 29:393–402. [DOI] [PubMed] [Google Scholar]
- Naqvi NH, Gaznick N, Tranel D, Bechara A (2014) The insula: a critical neural substrate for craving and drug seeking under conflict and risk. Ann N Y Acad Sci 1316:53–70. [DOI] [PMC free article] [PubMed] [Google Scholar]
- Padula CB, Anthenelli RM, Eliassen JC, Nelson E, Lisdahl KM (2015) Gender effects in alcohol dependence: an FMRI pilot study examining affective processing. Alcohol Clin Exp Res 39:272–281. [DOI] [PMC free article] [PubMed] [Google Scholar]
- Parks MH, Greenberg DS, Nickel MK, Dietrich MS, Rogers BP, Martin PR (2010) Recruitment of additional brain regions to accomplish simple motor tasks in chronic alcohol-dependent patients. Alcohol Clin Exp Res 34:1098–1109. [DOI] [PubMed] [Google Scholar]
- Power JD, Barnes KA, Snyder AZ, Schlaggar BL, Petersen SE (2012) Spurious but systematic correlations in functional connectivity MRI networks arise from subject motion. Neuroimage 59:2142–2154. [DOI] [PMC free article] [PubMed] [Google Scholar]
- Power JD, Schlaggar BL, Petersen SE (2015) Recent progress and outstanding issues in motion correction in resting state fMRI. Neuroimage 105:536–551. [DOI] [PMC free article] [PubMed] [Google Scholar]
- Stavro K, Pelletier J, Potvin S (2013) Widespread and sustained cognitive deficits in alcoholism: a meta-analysis. Addict Biol 18:203–213. [DOI] [PubMed] [Google Scholar]
- Steriade M, Contreras D, Curro Dossi R, Nunez A (1993) The slow (<1 Hz) oscillation in reticular thalamic and thalamocortical neurons: scenario of sleep rhythm generation in interacting thalamic and neocortical networks. J Neurosci 13:3284–3299. [DOI] [PMC free article] [PubMed] [Google Scholar]
- Sullivan EV, Müller-Oehring E, Pitel AL, Chanraud S, Shankaranarayanan A, Alsop DC, Rohlfing T, Pfefferbaum A (2013) A selective insular perfusion deficit contributes to compromised salience network connectivity in recovering alcoholic men. Biol Psychiatry 74:547–555. [DOI] [PMC free article] [PubMed] [Google Scholar]
- Tapert SF, Cheung EH, Brown GG, Frank LR, Paulus MP, Schweinsburg AD, Meloy MJ, Brown SA (2003) Neural response to alcohol stimuli in adolescents with alcohol use disorder. Arch Gen Psychiatry 60:727–735. [DOI] [PubMed] [Google Scholar]
- Wang Z, Zhang Z, Liao W, Xu Q, Zhang J, Lu W, Jiao Q, Chen G, Feng J, Lu G (2014) Frequency-dependent amplitude alterations of resting-state spontaneous fluctuations in idiopathic generalized epilepsy. Epilepsy Res 108:853–860. [DOI] [PubMed] [Google Scholar]
- Wang L, Kong Q, Li K, Su Y, Zeng Y, Zhang Q, Dai W, Xia M, Wang G, Jin Z, Yu X, Si T (2016) Frequency-dependent changes in amplitude of low-frequency oscillations in depression: a resting-state fMRI study. Neurosci Lett 614:105–111. [DOI] [PubMed] [Google Scholar]
- Wechsler D (1981) WAIS-R Manual: Wechsler Adult Intelligence Scale-Revised Psychological Corporation; New York. [Google Scholar]
- Wechsler D (2001) Wechsler Test of Adult Reading: WTAR San Antonio, Tex: Psychological Corp. [Google Scholar]
- Wechsler D, Stone CP (1987) Wechsler Memory Scale-Revised Psychological Corporation. [Google Scholar]
- Weiland BJ, Welsh RC, Yau WY, Zucker RA, Zubieta JK, Heitzeg MM (2013) Accumbens functional connectivity during reward mediates sensation-seeking and alcohol use in highrisk youth. Drug Alcohol Depend 128:130–139. [DOI] [PMC free article] [PubMed] [Google Scholar]
- Wikenheiser AM, Schoenbaum G (2016) Over the river, through the woods: cognitive maps in the hippocampus and orbitofrontal cortex. Nat Rev Neurosci 17:513–523. [DOI] [PMC free article] [PubMed] [Google Scholar]
- Xue SW, Li D, Weng XC, Northoff G, Li DW (2014) Different neural manifestations of two slow frequency bands in resting functional magnetic resonance imaging: a systemic survey at regional, interregional, and network levels. Brain Connect 4:242–255. [DOI] [PubMed] [Google Scholar]
- Yan CG, Cheung B, Kelly C, Colcombe S, Craddock RC, Di Martino A, Li Q, Zuo XN, Castellanos FX, Milham MP (2013) A comprehensive assessment of regional variation in the impact of head micromovements on functional connectomics. Neuroimage 76:183–201. [DOI] [PMC free article] [PubMed] [Google Scholar]
- Yan CG, Wang XD, Zuo XN, Zang YF (2016) DPABI: Data Processing & Analysis for (Resting-State) Brain Imaging. Neuroinformatics [DOI] [PubMed] [Google Scholar]
- Yang Y, Zhong N, Imamura K, Lu S, Li M, Zhou H, Li H, Yang X, Wan Z, Wang G, Hu B, Li K (2016) Task and resting-state fMRI reveal altered salience responses to positive stimuli in patients with major depressive disorder. PLoS One 11: e0155092. [DOI] [PMC free article] [PubMed] [Google Scholar]
- Zang YF, He Y, Zhu CZ, Cao QJ, Sui MQ, Liang M, Tian LX, Jiang TZ, Wang YF (2007) Altered baseline brain activity in children with ADHD revealed by resting-state functional MRI. Brain Dev 29:83–91. [DOI] [PubMed] [Google Scholar]
- Zhang J, Wei L, Hu X, Zhang Y, Zhou D, Li C, Wang X, Feng H, Yin X, Xie B, Wang J (2013) Specific frequency band of amplitude low-frequency fluctuation predicts Parkinson’s disease. Behav Brain Res 252:18–23. [DOI] [PubMed] [Google Scholar]
- Zhang X, Di X, Lei H, Yang J, Xiao J, Wang X, Yao S, Rao H (2016) Imbalanced spontaneous brain activity in orbitofrontal-insular circuits in individuals with cognitive vulnerability to depression. J Affect Disord 198:56–63. [DOI] [PubMed] [Google Scholar]
- Zheng H, Kong L, Chen L, Zhang H, Zheng W (2015) Acute effects of alcohol on the human brain: a resting-state FMRI study. Biomed Res Int 2015: 947529. [DOI] [PMC free article] [PubMed] [Google Scholar]
- Zuo XN, Di Martino A, Kelly C, Shehzad ZE, Gee DG, Klein DF, Castellanos FX, Biswal BB, Milham MP (2010) The oscillating brain: complex and reliable. Neuroimage 49: 1432–1445. [DOI] [PMC free article] [PubMed] [Google Scholar]