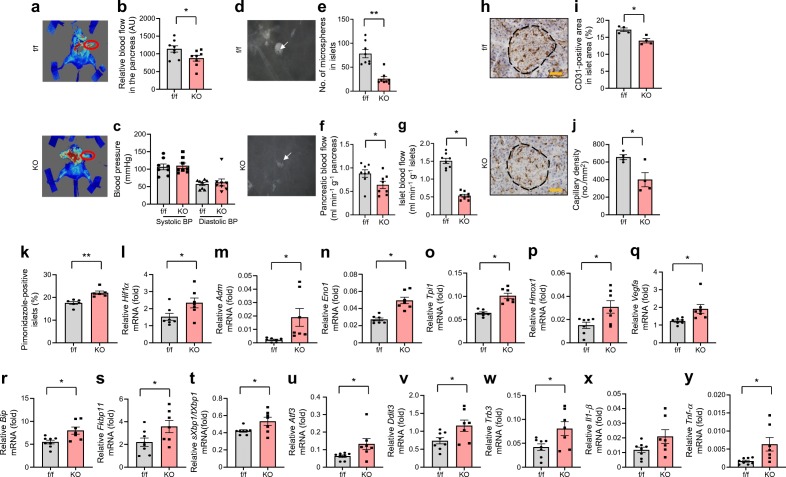
Fig. 4.
Pancreatic and islet blood flow, CD31 and pimonidazole staining and mRNA expression levels related to hypoxia, ER stress and inflammation. (a) Representative images of the laser-Doppler experiment for evaluation of pancreatic blood flow. The pancreas is indicated by a red circle. The intensity of the red colour was measured using MoorFLPI-2 apparatus. (b) Pancreatic blood flow, shown as arbitrary units (AU) (n=8 mice). (c) Blood pressure (n=8 mice). (d–g) Representative images of darkfield microscopy (d). Islets are shown in white and the arrows point to microspheres in the islet, which appear as small black dots; the microspheres were counted to evaluate islet blood flow (e). Pancreatic (f) and islet (g) blood flow evaluated by microspheres (n=8 mice). (h–j) Representative images of CD31 staining (h). The black dotted line indicates an islet and brown staining indicates capillaries. The brown area was measured and divided by total islet area to give the CD31-positive area in islet area (%) (i), and the brown structures were counted and divided by total islet area to give capillary density (j) (n=4 mice); scale bars, 50 μm. (k) Percentage of pimonidazole-positive islets (n=6 mice). (l–q) Expression levels of Hif1α mRNA and its downstream factors (reported as fold vs β-actin) (n=7 mice). (r–y) Expression levels of mRNA (reported as fold vs β-actin except for t, in which expression level of sXbp1 [fold vs β-actin] was divided by that of tXbp1 [fold vs β-actin]) related to adaptive UPR and ER stress-related apoptotic genes (r–w) and inflammation (x, y) (n=7 or 8 mice, as indicated). Values are the means ± SEM. *p<0.05 and **p<0.01, KO vs f/f; in (x), p=0.075 for KO vs f/f. f/f, control flox mice; KO, VE-PDPK1-KO mice

