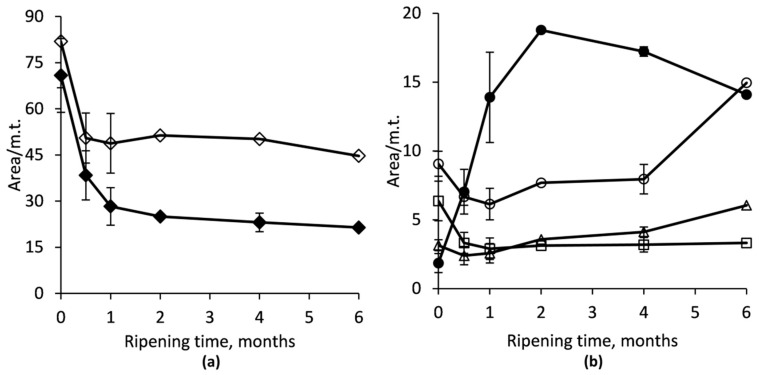
Figure 2.
Change of the content (normalized peak area) of main intact CN (a) and their primary degradation products (b) during RO-cheese ripening. αs1-CN (♦): sum of αs1-CN-8P and αs1-CN-9P; β-CN (◊): sum of β-CN(A1), β-CN(A2), and β-CN(B); αs1-I-CN (●): sum of αs1-I-CN-8P and αs1-I-CN-9P; γ1-CN (○): sum of γ1-CN(A1) and γ1-CN(A2); (□): γ2-CN; (∆): γ3-CN; m.t., migration time.

