

Abstract
Body fat distribution is a risk factor for adverse cardiovascular health consequences. We analyzed the association of body fat distribution, assessed by waist-to-hip ratio adjusted for body mass index, with 228,985 predicted coding and splice site variants available on exome arrays in up to 344,369 individuals from five major ancestries (discovery) and 132,177 European-ancestry individuals (validation). We identified 15 common (minor allele frequency, MAF ≥ 5%) and 9 low frequency or rare (MAF < 5%) coding novel variants. Pathway/gene set enrichment analyses identified lipid particle, adiponectin, abnormal white adipose tissue physiology, and bone development and morphology as important contributors to fat distribution, while cross-trait associations highlight cardiometabolic traits. In functional follow-up analyses, specifically in Drosophila RNAi-knockdowns, we observed a significant increase in the total body triglyceride levels for two genes (DNAH10 and PLXND1). We implicate novel genes in fat distribution, stressing the importance of interrogating low-frequency and protein-coding variants.
Editorial summary:
A trans-ethnic exome-wide association study for body fat distribution identifies protein-coding variants that are significantly associated with waist-to-hip ratio adjusted for body mass index.
Central body fat distribution, as assessed by waist-to-hip ratio (WHR), is a heritable and a well-established risk factor for adverse metabolic outcomes1–6. Lower values of WHR are associated with lower risk of cardiometabolic diseases like type 2 diabetes (T2D)7,8, or differences in bone structure and gluteal muscle mass9. These epidemiological associations are consistent with our previously reported genome-wide association study (GWAS) results of 49 loci associated with WHR (after adjusting for body mass index, WHRadjBMI)10. Notably, genetic predisposition to higher WHRadjBMI is associated with increased risk of T2D and coronary heart disease (CHD), which appears to be causal9.
Recently, large-scale studies have identified ~125 common loci for multiple measures of central obesity, primarily non-coding variants of relatively modest effect10–16. Large scale interrogation of coding and splice site variants, including both common (minor allele frequency [MAF]≥5%) and low frequency or rare (LF/RV, MAF<5%), may lead to additional insights into the etiology of central obesity. Herein, we identify and characterize such variants associated with WHRadjBMI using ExomeChip array genotypes.
RESULTS
Protein-coding and splice site variation associations
We conducted a 2-stage fixed-effects meta-analysis testing additive and recessive models to detect protein-coding genetic variants that influence WHRadjBMI (Online Methods, Figure 1). Stage 1 included up to 228,985 variants (218,195 LF/RV) in up to 344,369 individuals from 74 studies of European, South and East Asian, African, and Hispanic/Latino descent individuals (Supplementary Data 1–3). Stage 2 assessed 70 suggestive (P < 2 × 10⁻⁶) Stage 1 variants in two cohorts, UK Biobank (UKBB) and deCODE for a total Stage 1+2 sample size of 476,546 (88% European). Of the 70 variants considered, two common and five LF/RV were not available in Stage 2 (Tables 1–2, Supplementary Data 4–6). Variants are considered novel and statistically significant if they were greater than one megabase (Mb) from a previously-identified WHRadjBMI SNP10–16 and achieve array-wide significance (P < 2 × 10⁻⁷, Stage 1+2).
Figure 1. Summary of meta-analysis study design and workflow.
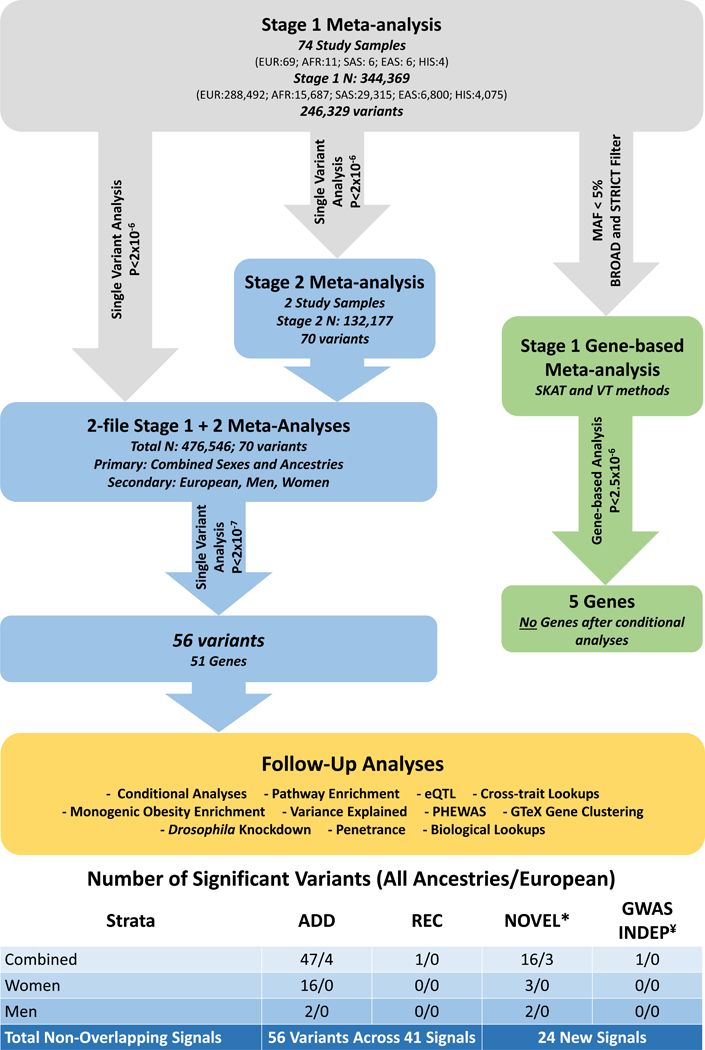
Abbreviations:EUR- European, AFR- African, SAS- South Asian, EAS- East Asian, and HIS- Hispanic/Latino ancestry.* Novel variants include those that are >1MB from a previously published WHRadjBMIGWAS tag SNP.¥ Independent (INDEP) includes variants that are nearby known WHRadjBMI GWAS tag variants, but were determined independent after conditional analysis.
Table 1. Association results for Combined Sexes.
Association results based on an additive or recessive model for coding variants that met array-wide significance (P < 2 × 10⁻⁷) in the sex-combined meta-analyses.
| Locus (+/−1 Mb of a given variant) | Chr:Position (GRCh37)b | rsID | EA | OA | Genec | Amino Acid Changec | If locus is known, nearby (< 1 MB) published variant(s)d | N | EAF | βe | SE | P-value | P-value for Sex-heterogeneityf | Other Criteria For Sigh |
| Variants in Novel Loci | ||||||||||||||
|---|---|---|---|---|---|---|---|---|---|---|---|---|---|---|
| All Ancestry Additive model Sex-combined analyses |
| 1 | 2:15882701 | rs55920843 | T | G | ACVR1C | N150H | - | 455,526 | 0.989 | 0.065 | 0.011 | 4.8E-10 | 1.7E-07 | |
| 2 | 3:50597092 | rs1034405 | G | A | C3orf18 | A162V | - | 455,424 | 0.135 | 0.016 | 0.003 | 1.9E-07 | 8.8E-01 | G,C |
| 3 | 4:120528327 | rs3733526 | G | A | PDE5A | A41V | - | 461,521 | 0.187 | 0.015 | 0.003 | 2.6E-08 | 5.2E-03 | |
| 4 | 6:26108117 | rs146860658 | T | C | HIST1H1T | A69T | - | 217,995 | 0.001 | 0.229 | 0.042 | 4.3E-08 | 6.3E-01 | S |
| 5 | 7:6449496 | rs2303361 | C | T | DAGLB | Q664R | - | 475,748 | 0.221 | 0.014 | 0.003 | 6.2E-08 | 3.4E-03 | G |
| 6 | 10:123279643 | rs138315382 | T | C | FGFR2 | synonymous | - | 236,962 | 0.001 | 0.258 | 0.049 | 1.4E-07 | 1.1E-01 | G,S |
| 7 | 11:65403651 | rs7114037 | C | A | PCNXL3 | H1822Q | - | 448,861 | 0.954 | 0.029 | 0.005 | 1.8E-08 | 4.4E-01 | |
| 8 | 12:48143315 | rs145878042 | A | G | RAPGEF3 | L300P | - | 470,513 | 0.990 | 0.085 | 0.010 | 7.2E-17 | 7.3E-03 | |
| 9 | 12:108618630 | rs3764002 | C | T | WSCD2 | T266I | - | 474,637 | 0.737 | 0.014 | 0.002 | 9.8E-10 | 5.5E-01 | |
| 10 | 15:42032383 | rs17677991 | G | C | MGA | P1523A | - | 469,874 | 0.345 | 0.015 | 0.002 | 3.5E-11 | 9.1E-01 | |
| 11 | 16:4432029 | rs3810818 | A | C | VASN | E384A | - | 424,163 | 0.231 | 0.016 | 0.003 | 2.0E-09 | 3.3E-01 | |
| 16:4445327 | rs3747579 | C | T | CORO7 | R193Q | - | 453,078 | 0.299 | 0.018 | 0.002 | 2.2E-13 | 4.3E-02 | ||
| 16:4484396 | rs1139653 | A | T | DNAJA3 | N75Y | - | 434,331 | 0.284 | 0.015 | 0.002 | 4.3E-10 | 1.4E-01 | ||
| 12 | 19:49232226 | rs2287922 | A | G | RASIP1 | R601C | - | 430,272 | 0.494 | 0.014 | 0.002 | 1.6E-09 | 3.7E-02 | |
| 19:49244220 | rs2307019 | G | A | IZUMO1 | A333V | - | 476,147 | 0.558 | 0.012 | 0.002 | 4.7E-08 | 3.9E-02 | ||
| 13 | 20:42965811 | rs144098855 | T | C | R3HDML | P5L | - | 428,768 | 0.001 | 0.172 | 0.032 | 9.7E-08 | 1.0E+00 | G |
| European Ancestry Additive model Sex-combined analyses |
| 14 | 1:173802608 | rs35515638 | G | A | DARS2 | K196R | - | 352,646 | 0.001 | 0.201 | 0.038 | 1.4E-07 | 6.0E-02 | G |
| 15 | 14:58838668 | rs1051860 | A | G | ARID4A | synonymous | - | 367,079 | 0.411 | 0.013 | 0.002 | 2.2E-08 | 1.3E-01 | |
| 16 | 15:42115747 | rs3959569 | C | G | MAPKBP1 | R1240H | - | 253,703 | 0.349 | 0.017 | 0.003 | 2.0E-08 | 6.3E-01 |
| Variants in Previously Identified Loci | ||||||||||||||
| All Ancestry Additive model Sex-combined analyses |
| 1 | 1:119427467 | rs61730011 | A | C | TBX15 | M566R | rs2645294, rs12731372, rs12143789, rs1106529 | 441,461 | 0.957 | 0.041 | 0.005 | 2.2E-14 | 6.7E-01 | |
| 1:119469188 | rs10494217 | T | G | H156N | 472,259 | 0.174 | 0.018 | 0.003 | 1.4E-10 | 6.0E-01 | ||||
| 2 | 1:154987704 | rs141845046 | C | T | ZBTB7B | P190S | rs905938 | 476,440 | 0.976 | 0.037 | 0.007 | 3.8E-08 | 7.9E-07 | C |
| 3 | 2:165551201 | rs7607980 | T | C | COBLL1 | N941D | rs1128249, rs10195252, rs12692737, rs12692738, rs17185198 | 389,883 | 0.879 | 0.026 | 0.004 | 1.6E-13 | 3.0E-30 | |
| 4 | 2:188343497 | rs7586970 | T | C | TFPI | N221S | rs1569135 | 452,638 | 0.697 | 0.016 | 0.002 | 3.0E-12 | 6.3E-01 | |
| 5 | 3:52558008 | rs13303 | T | C | STAB1 | M113T | rs2276824 | 470,111 | 0.445 | 0.019 | 0.002 | 5.5E-18 | 6.7E-02 | |
| 3:52833805 | rs3617 | C | A | ITIH3 | Q315K | 452,150 | 0.541 | 0.015 | 0.002 | 1.6E-12 | 4.0E-01 | C | ||
| 6 | 3:129137188 | rs62266958 | C | T | EFCAB12 | R197H | rs10804591 | 476,382 | 0.936 | 0.036 | 0.004 | 8.3E-17 | 9.3E-05 | |
| 3:129284818 | rs2625973 | A | C | PLXND1 | L1412V | 476,338 | 0.733 | 0.016 | 0.002 | 9.2E-11 | 1.6E-05 | |||
| 7 | 4:89625427 | rs1804080 | G | C | HERC3 | E946Q | rs9991328 | 446,080 | 0.838 | 0.021 | 0.003 | 1.5E-12 | 4.1E-06 | |
| 4:89668859 | rs7657817 | C | T | FAM13A | V443I | 476,383 | 0.815 | 0.016 | 0.003 | 5.0E-09 | 9.6E-05 | |||
| 8 | 5:176516631 | rs1966265 | A | G | FGFR4 | V10I | rs6556301 | 455,246 | 0.236 | 0.023 | 0.003 | 1.7E-19 | 2.1E-01 | |
| 9 | 6:7211818 | rs1334576g | G | A | RREB1 | G195R | rs1294410 | 451,044 | 0.565 | 0.017 | 0.002 | 3.9E-15 | 1.5E-01 | |
| 10 | 6:34827085 | rs9469913 | A | T | UHRF1BP1 | Q984H | rs1776897 | 309,684 | 0.847 | 0.021 | 0.004 | 1.2E-08 | 2.7E-01 | C |
| 11 | 6:127476516 | rs1892172 | A | G | RSPO3 | synonymous | rs11961815, rs72959041, rs1936805 | 476,358 | 0.543 | 0.031 | 0.002 | 2.6E-47 | 7.7E-09 | |
| 6:127767954 | rs139745911g | A | G | KIAA0408 | P504S | 391,469 | 0.010 | 0.103 | 0.012 | 6.8E-19 | 2.0E-04 | |||
| 12 | 7:73012042 | rs35332062 | G | A | MLXIPL | A358V | rs6976930 | 451,158 | 0.880 | 0.020 | 0.003 | 1.8E-09 | 1.5E-01 | |
| 7:73020337 | rs3812316 | C | G | Q241H | 454,738 | 0.881 | 0.021 | 0.003 | 2.0E-10 | 5.8E-02 | ||||
| 13 | 10:95931087 | rs17417407 | T | G | PLCE1 | R240L | rs10786152 | 476,475 | 0.173 | 0.018 | 0.003 | 2.5E-11 | 5.9E-01 | |
| 14 | 11:64031241 | rs35169799 | T | C | PLCB3 | S778L | rs11231693 | 476,457 | 0.061 | 0.034 | 0.004 | 9.1E-15 | 1.3E-04 | |
| 15 | 12:123444507 | rs58843120 | G | T | ABDB9 | F92L | rs4765219, rs863750 | 466,498 | 0.987 | 0.053 | 0.009 | 1.3E-08 | 3.5E-01 | |
| 12:124265687 | rs11057353 | T | C | DNAH10 | S228P | 476,360 | 0.373 | 0.018 | 0.002 | 2.1E-16 | 2.7E-08 | |||
| 12:124330311 | rs34934281 | C | T | T1785M | 476,395 | 0.889 | 0.025 | 0.003 | 2.9E-14 | 3.1E-08 | ||||
| 12:124427306 | rs11057401 | T | A | CCDC92 | S53C | 467,649 | 0.695 | 0.029 | 0.002 | 7.3E-37 | 5.5E-11 | |||
| 16 | 15:56756285 | rs1715919 | G | T | MNS1 | Q55P | rs8030605 | 476,274 | 0.096 | 0.023 | 0.004 | 8.8E-11 | 2.7E-02 | |
| 17 | 16:67397580 | rs9922085 | G | C | LRRC36 | R101P | rs6499129 | 469,474 | 0.938 | 0.034 | 0.005 | 3.8E-13 | 5.9E-01 | |
| 16:67409180 | rs8052655 | G | A | G388S | 474,035 | 0.939 | 0.034 | 0.005 | 5.5E-13 | 4.0E-01 | ||||
| 18 | 19:18285944 | rs11554159 | A | G | IFI30 | R76Q | rs12608504 | 476,389 | 0.257 | 0.015 | 0.002 | 3.5E-10 | 3.1E-03 | |
| 19:18304700 | rs874628 | G | A | MPV17L2 | M72V | 476,388 | 0.271 | 0.015 | 0.002 | 1.2E-10 | 2.5E-03 | |||
| 19 | 20:33971914 | rs4911494 | T | C | UQCC1 | R51Q | rs224333 | 451,064 | 0.602 | 0.018 | 0.002 | 2.5E-16 | 1.5E-03 | |
| 20:34022387 | rs224331 | A | C | GDF5 | S276A | 345,805 | 0.644 | 0.017 | 0.003 | 1.8E-11 | 3.2E-03 |
| All Ancestry Recessive model Sex-combined analyses |
| 20 | 17:17425631 | rs897453 | C | T | PEMT | V58L | rs4646404 | 476,546 | 0.569 | 0.025 | 0.004 | 4.1E-11 | 8.2E-01 |
| European Ancestry Additive model Sex-combined analyses |
| 6 | 3:129293256 | rs2255703 | T | C | PLXND1 | M870V | rs10804591 | 420,520 | 0.620 | 0.014 | 0.002 | 3.1E-09 | 1.6E-04 |
Abbreviations: GRCh37=human genome assembly build37;rsID=based on dbSNP; VEP=Ensembl Variant Effect Predictor toolset; GTEx=Genotype-Tissue Expression project;SD=standard deviation; SE=standard error;N=sample size; EAF=effect allele frequency; EA=effect allele; OA=other allele.
Coding variants refer to variants located in the exons and splicing junction regions.
Variant positions are reported according to Human assembly build 37 and their alleles are coded based on the positive strand.
The gene the variant falls in and amino acid change from the most abundant coding transcript is shown (protein annotation is based on VEP toolset and transcript abundance from GTEx database).
Previously published variants within +/−1Mb are from Shungin et al.10, except for rs6976930 and rs10786152 from Graff et al.14 and rs6499129 from Ng. et al 16.
Effect size is based on standard deviation (SD) per effect allele
P-value for sex heterogeneity, testing for difference between women-specific and men-specific beta estimates and standard errors, was calculated using EasyStrata: Winkler, T.W. et al. EasyStrata: evaluation and visualization of stratified genome-wide association meta-analysis data. Bioinformatics 2015: 31, 259–61.PMID: 25260699. Bolded P-values met significance threshold after bonferonni correction (P-value<7.14E-04; i.e. 0.05/70 variants).
rs1334576 in RREB1 is a new signal in a known locus that is independent from the known signal, rs1294410; rs139745911 in KIAA0408 is a new signal in a known locus that is independent from all known signals rs11961815, rs72959041, rs1936805, in a known locus (see Supplementary Table 4).
Each flag indicates a that a secondary criterion for significance may not be met, G- P-value > 5×10⁻⁸ (GWAS significant), C- Association Signal was not robust against collider bias; S- variant was not available in stage 2 studies for validation of Stage 1 association.
Table 2. Association results for Sex-stratified analyses.
Association results based on an additive or recessive model for coding variants that met array-wide significance (P < 2 × 10⁻⁷) in the sex-specific meta-analyses and reach Bonferonni corrected P-value for sex heterogeneity (Psexhet< 7.14 × 10⁻⁴).
| Locus (+/−1Mb of a given variant) | Chr:Position (GRCh37)c | rsID | EA | OA | Gened | Amino Acid Changed | In sex-combined analysese | If locus is known, nearby (< 1 MB) published variant(s)f | P-value for Sex-heterogeneityg | Men | Women | Other Criteria For Sigj | ||||||||
|---|---|---|---|---|---|---|---|---|---|---|---|---|---|---|---|---|---|---|---|---|
| N | EAF | βh | SE | P | N | EAF | βh | SE | P | |||||||||||
| Variants in Novel Loci | ||||||||||||||||||||
| All Ancestry Additive model Men only analyses | ||||||||||||||||||||
| 1 | 13:96665697 | rs148108950 | A | G | UGGT2 | P175L | No | - | 1.5E-06 | 203,009 | 0.006 | 0.130 | 0.024 | 6.1E-08 | 221,390 | 0.004 | −0.044 | 0.027 | 1.1E-01 | G |
| 2 | 14:23312594 | rs1042704 | A | G | MMP14 | D273N | No | - | 2.6E-04 | 226,646 | 0.202 | 0.021 | 0.004 | 2.6E-08 | 250,018 | 0.197 | 0.002 | 0.004 | 6.1E-01 | |
| All Ancestry Additive model Women only analyses | ||||||||||||||||||||
| 3 | 1:205130413 | rs3851294 | G | A | DSTYK | C641R | No | - | 9.8E-08 | 225,803 | 0.914 | −0.005 | 0.005 | 3.4E-01 | 249,471 | 0.912 | 0.034 | 0.005 | 4.5E-11 | |
| 4 | 2:158412701 | rs55920843 | T | G | ACVR1C | N150H | Yes | - | 1.7E-07 | 210,071 | 0.989 | 0.006 | 0.015 | 7.2E-01 | 245,808 | 0.989 | 0.113 | 0.014 | 1.7E-15 | |
| 5 | 19:8429323 | rs116843064 | G | A | ANGPTL4 | E40K | No | - | 1.3E-07 | 203,098 | 0.981 | −0.017 | 0.011 | 1.4E-01 | 243,351 | 0.981 | 0.064 | 0.011 | 1.2E-09 | |
| Variants in Previously Identified Loci | ||||||||||||||||||||
| All Ancestry Additive model Women only analyses | ||||||||||||||||||||
| 1 | 1:154987704 | rs141845046 | C | T | ZBTB7B | P190S | Yes | rs905938 | 7.9E-07 | 226,709 | 0.975 | 0.004 | 0.010 | 6.9E-01 | 250,084 | 0.977 | 0.070 | 0.010 | 2.3E-13 | |
| 2 | 2:165551201 | rs7607980 | T | C | COBLL1 | N941D | Yes | rs1128249, rs10195252, rs12692737, rs12692738, rs17185198 | 3.0E-30 | 173,600 | 0.880 | −0.018 | 0.005 | 5.8E-04 | 216,636 | 0.878 | 0.062 | 0.005 | 6.7E-39 | |
| 3 | 3:129137188 | rs62266958 | C | T | EFCAB12 | R197H | Yes | rs10804591 | 9.3E-05 | 226,690 | 0.937 | 0.018 | 0.006 | 3.1E-03 | 250,045 | 0.936 | 0.051 | 0.006 | 8.1E-18 | |
| 3:129284818 | rs2625973 | A | C | PLXND1 | L1412V | Yes | 1.6E-05 | 226,650 | 0.736 | 0.005 | 0.003 | 1.9E-01 | 250,023 | 0.730 | 0.025 | 0.003 | 8.2E-14 | |||
| 3:129293256 | rs2255703 | T | C | M870V | Yes | 5.0E-04 | 226,681 | 0.609 | 0.003 | 0.003 | 3.1E-01 | 250,069 | 0.602 | 0.018 | 0.003 | 1.9E-09 | ||||
| 4 | 4:89625427 | rs1804080 | G | C | HERC3 | E946Q | Yes | rs9991328 | 4.1E-06 | 222,556 | 0.839 | 0.008 | 0.004 | 6.6E-02 | 223,877 | 0.837 | 0.034 | 0.004 | 2.1E-16 | |
| 4:89668859 | rs7657817 | C | T | FAM13A | V443I | Yes | 9.6E-05 | 226,680 | 0.816 | 0.006 | 0.004 | 1.5E-01 | 242,970 | 0.815 | 0.026 | 0.004 | 5.9E-12 | |||
| 5 | 6:127476516 | rs1892172 | A | G | RSPO3 | synonymous | Yes | rs11961815, rs72959041, rs1936805 | 7.7E-09 | 226,677 | 0.541 | 0.018 | 0.003 | 5.6E-10 | 250,034 | 0.545 | 0.042 | 0.003 | 3.4E-48 | |
| 6:127767954 | rs139745911i | A | G | KIAA0408 | P504S | Yes | 2.0E-04 | 188,079 | 0.010 | 0.057 | 0.017 | 6.8E-04 | 205,203 | 0.010 | 0.143 | 0.016 | 5.9E-19 | |||
| 6 | 11:64031241 | rs35169799 | T | C | PLCB3 | S778L | Yes | rs11231693 | 1.3E-04 | 226,713 | 0.061 | 0.016 | 0.006 | 9.6E-03 | 250,097 | 0.061 | 0.049 | 0.006 | 6.7E-16 | |
| 7 | 12:124265687 | rs11057353 | T | C | DNAH10 | S228P | Yes | rs4765219, rs863750 | 2.7E-08 | 226,659 | 0.370 | 0.005 | 0.003 | 8.3E-02 | 250,054 | 0.376 | 0.029 | 0.003 | 3.1E-22 | |
| 12:124330311 | rs34934281 | C | T | T1785M | Yes | 3.1E-08 | 226,682 | 0.891 | 0.006 | 0.005 | 1.9E-01 | 250,066 | 0.887 | 0.043 | 0.005 | 1.4E-20 | ||||
| 12:124427306 | rs11057401 | T | A | CCDC92 | S53C | Yes | 5.5E-11 | 223,324 | 0.701 | 0.013 | 0.003 | 4.3E-05 | 244,678 | 0.689 | 0.043 | 0.003 | 1.0E-41 | |||
Abbreviations: GRCh37=human genome assembly build 37;rsID=based on dbSNP; VEP=Ensembl Variant Effect Predictor toolset; GTEx=Genotype-Tissue Expression project; SD=standard deviation; SE=standard error;N=sample size; EA=effect allele; OA=other allele; EAF=effect allele frequency.
Coding variants refer to variants located in the exons and splicing junction regions.
Bonferonni corrected Pvalue for the number of SNPs tested for sex-heterogeneity is <7.14E-04 i.e. 0.05/70 variants.
Variant positions are reported according to Human assembly build 37 and their alleles are coded based on the positive strand.
The gene the variant falls in and amino acid change from the most abundant coding transcript is shown (protein annotation is based on VEP toolset and transcript abundance from GTEx database).
Variant was also identified as array-wide significant in the sex-combined analyses.
Previously published variants within +/−1Mb are from Shungin D et al. New genetic loci link adipose and insulin biology to body fat distribution. Nature 2015; 518, 187–196 doi:10.1038/nature14132 (PMID 25673412).
P-value for sex heterogeneity, testing for difference between women-specific and men-specific beta estimates and standard errors, was calculated using EasyStrata: Winkler, T.W. et al. EasyStrata: evaluation and visualization of stratified genome-wide association meta-analysis data. Bioinformatics 2015: 31, 259–61. PMID: 25260699.
Effect size is based on standard deviation (SD) per effect allele
rs139745911 in KIAA0408 is a new signal in a known locus that is independent from all known signals rs11961815, rs72959041, rs1936805, in a known locus (see Supplementary 8A/B).
Each flag indicates a that a secondary criterion for significance may not be met, G- P-value > 5×10⁻⁸ (GWAS significant), C- Association Signal was not robust against collider bias; S- variant was not availabel in Stage 2 studies for validation of Stage 1 association.
In our primary meta-analysis, including all Stage 1+2 samples, we identified 48 coding variants (16 novel) across 43 genes, 47 assuming an additive model, and one under a recessive model (Table 1, Supplementary Figures 1–4). Due to possible heterogeneity, we also performed European-only meta-analysis. Here, four additional coding variants were significant (three novel) assuming an additive model (Table 1, Supplementary Figures 5–8). Of these 52 significant variants, eleven were LF/RV and displayed larger effect estimates than many previously reported common variants10, including seven novel variants in RAPGEF3, FGFR2, R3HDML, HIST1H1T, PCNXL3, ACVR1C, and DARS2. Variants with MAF ≤ 1% had effect sizes approximately three times greater than those of common variants (MAF ≥ 5%). Despite large sample size, we cannot rule out the possibility that additional LF/RV with smaller effects exist (See estimated 80% power in Figure 2). However, in the absence of common variants with similarly large effects, our results point to the importance of investigating LF/RV.
Figure 2.
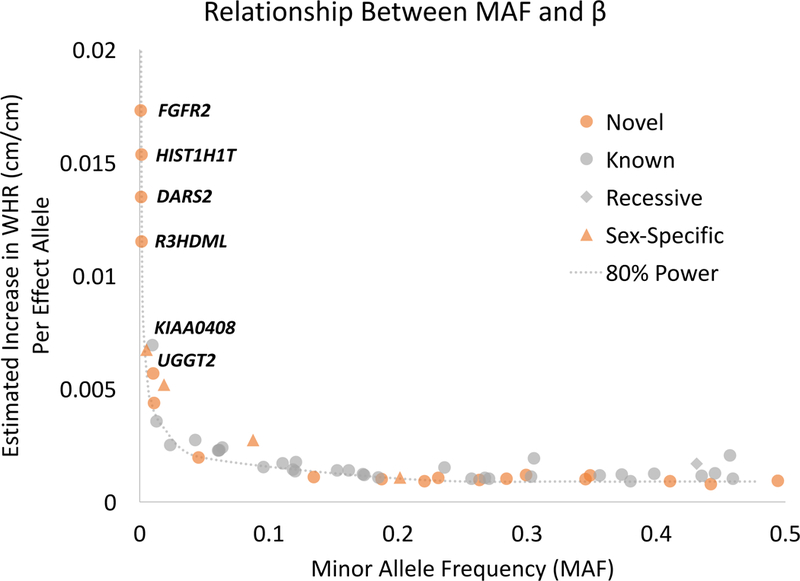
Minor allele frequency compared to estimated effect. This scatter plot displays the relationship between minor allele frequency (MAF) and the estimated effect (β) for each significant coding variant in our meta-analyses. All novel WHRadjBMI variants are highlighted in orange, and variants identified only in models that assume recessive inheritance are denoted by diamonds and only in sex-specific analyses by triangles. Eighty percent power was calculated based on the total sample size in the Stage 1+2 meta-analysis and P = 2 × 10⁻⁷. Estimated effects are shown in original units (cm/cm) calculated by using effect sizes in standard deviation (SD) units times SD of WHR in the ARIC study (sexes combined = 0.067, men = 0.052, women = 0.080). WHR; waist-to-hip ratio
Given established sex differences in the genetic underpinnings of WHRadjBMI10,11, we also performed sex-stratified analyses. We detected four additional novel variants that exhibit significant sex-specific effects (Psexhet < 7.14 × 10⁻⁴, Online Methods) in UGGT2 and MMP14 for men; and DSTYK and ANGPTL4 for women (Table 2, Supplementary Figures 9–15); including LF/RV in UGGT2 and ANGPTL4 (MAFmen = 0.6% and MAFwomen = 1.9%, respectively). Additionally, 14 variants from the sex-combined meta-analyses displayed significantly stronger effects in women, including the novel, LF/RV in ACVR1C (rs55920843, MAF=1.1%). Overall, 19 of the 56 variants (32%) identified across all meta-analyses (48 from all ancestry, 4 from European-only and 4 from sex-stratified analyses) showed significant sex-specific effects on WHRadjBMI: 16 variants with significantly stronger effects in women, and three in men (Figure 1).
In summary, we identified 56 array-wide significant coding variants (P < 2.0 × 10⁻⁷); 43 common (14 novel) and 13 LF/RV (9 novel). For the 55 significant variants from the additive model, we examined potential collider bias17,18 (Online Methods, Supplementary Table 1, Supplementary Note). Overall, 51 of 55 variants were robust to collider bias17,18. Of these, 25 variants were nominally associated with BMI (PBMI < 0.05), yet effect sizes changed little after correction for potential biases (15% change in effect estimate on average). For four of the 55 SNPs (rs141845046, rs1034405, rs3617, rs9469913), attenuation following correction was noted (Pcorrected > 9 × 10⁻⁴, 0.05/55), including one novel variant, rs1034405 in C3orf18, demonstrating a possible overestimation of these effects in the current analysis.
Using Stage 1 results, we then aggregated LF/RV across genes and tested their joint effect with SKAT and burden tests19 (Supplementary Table 2, Online Methods). None of the five genes that reached array-wide significance (P < 2.5 × 10⁻⁶, 0.05/16,222 genes tested: RAPGEF3, ACVR1C, ANGPTL4, DNAI1, and NOP2) remained significant after conditioning on the most significant single variant.
Conditional analyses
We next implemented conditional analyses to determine (1) the total number of independent signals identified, and (2) whether the 33 variants near known GWAS signals (< +/− 1 Mb) represent independent novel associations. We used approximate joint conditional analyses to test for independence in Stage 1 (Online Methods; Supplementary Table 3)19. Only the RSPO3-KIAA0408 locus contains two independent variants 291 Kb apart, rs1892172 in RSPO3 (MAF = 46.1%, Pconditional = 4.37 × 10⁻²³ in the combined sexes, and Pconditional = 2.4 × 10⁻²⁰ in women) and rs139745911 in KIAA0408 (MAF = 0.9%, Pconditional = 3.68 × 10⁻¹¹ in combined sexes, and Pconditional = 1.46 × 10⁻¹¹ in women; Figure 3a). For the 33 variants within one Mb of previously identified WHRadjBMI SNPs, sex-combined conditional analyses identified one coding variant representing a novel independent signal in a known locus [RREB1; Stage 1 meta-analysis, rs1334576, EAF=44%, Pconditional = 3.06 × 10⁻⁷, (Supplementary Data 7, Figure 3b); UKBB analysis, rs1334576, RREB1, Pconditional = 1.24 × 10⁻⁸, (Supplementary Table 4).
Figure 3.
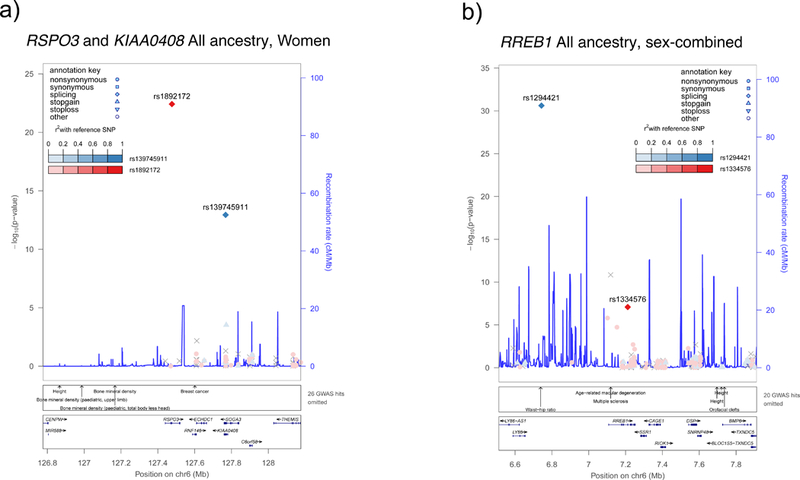
Regional association plots for known loci with novel coding signals identified by conditional analyses. Point color reflects r2 calculated from the ARIC dataset. In a) there are two independent variants in RSPO3 and KIAA0408, based on results from the stage 1 All Ancestry women (N = 180,131 for RSPO3 and 139,056 for KIAA0408). In b) we have a variant in RREB1 that is independent of the GWAS variant rs1294421, based on results from the stage 1 All Ancestry sex-combined individuals (N = 319,090).
In summary, we identified 56 WHRadjBMI-associated coding variants in 41 independent association signals, 24 of which are new or independent of known GWAS-identified tag SNPs (either > 1 MB +/− or array-wide significant following conditional analyses) (Figure 1). Thus, we identified 15 common and 9 LF/RV novel and independent variants following conditional analyses.
Gene set and pathway enrichment analysis
To determine if significant coding variants highlight novel or previously identified biological pathways, we applied two complementary methods, EC-DEPICT (ExomeChip Data-driven Expression Prioritized Integration for Complex Traits)20,21 and PASCAL22 (Online Methods). For PASCAL all variants were used, for EC-DEPICT we examined only 361 variants with suggestive significance (P < 5 × 10⁻⁴)10,23 from the all ancestries combined sexes analysis (which after clumping and filtering became 101 lead variants in 101 genes). We separately analyzed variants that exhibited significant sex-specific effects (Psexhet < 5 × 10⁻⁴).
The sex-combined analyses identified 49 significantly enriched gene sets (FDR < 0.05) that grouped into 25 meta-gene sets (Supplementary Note, Supplementary Data 8–9). We noted a cluster of meta-gene sets with direct relevance to metabolic aspects of obesity (“enhanced lipolysis,” “abnormal glucose homeostasis,” “increased circulating insulin level,” and “decreased susceptibility to diet-induced obesity”); we observed two significant adiponectin-related gene sets within these meta-gene sets. While these pathway groups had previously been identified in the GWAS DEPICT analysis (Figure 4), many of the individual gene sets within these meta-gene sets were not significant in the previous GWAS analysis, such as “insulin resistance,” “abnormal white adipose tissue physiology,” and “abnormal fat cell morphology” (Supplementary Data 8, Figure 4, Supplementary Figure 16a), but represent similar biological underpinnings implied by the shared meta-gene sets. Despite their overlap with the GWAS results, these analyses highlight novel genes that fall outside known GWAS loci and with strong contributions to the significantly enriched gene sets related to adipocyte and insulin biology (e.g. MLXIPL, ACVR1C, and ITIH5) (Figure 4).
Figure 4.
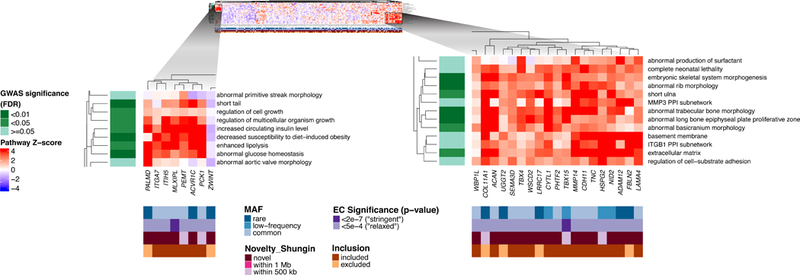
Heat maps showing DEPICT gene set enrichment results from the stage 1 All Ancestry sex-combined individuals (N = 344,369). For any given square, the color indicates how strongly the corresponding gene (x-axis) is predicted to belong to the reconstituted gene set (y-axis). This value is based on the gene’s z-score for gene set inclusion in DEPICT’s reconstituted gene sets, where red indicates a higher and blue a lower z-score. To visually reduce redundancy and increase clarity, we chose one representative “meta-gene set” for each group of highly correlated gene sets based on affinity propagation clustering (Online Methods, Supplementary Note). Heatmap intensity and DEPICT P-values (Supplementary Data 8–9) correspond to the most significantly enriched gene set within the meta-gene set. Annotations for the genes indicate (1) the minor allele frequency of the significant ExomeChip (EC) variant (blue; if multiple variants, the lowest-frequency variant was kept), (2) whether the variant’s P-value reached array-wide significance (< 2 × 10⁻⁷) or suggestive significance (< 5 × 10⁻⁴) (shades of purple), (3) whether the variant was novel, overlapping “relaxed” GWAS signals from Shungin et al.10 (GWAS P < 5 × 10⁻⁴), or overlapping “stringent” GWAS signals (GWAS P < 5 × 10⁻⁸) (pink), and (4) whether the gene was included in the gene set enrichment analysis or excluded by filters (shades of brown/orange) (Online Methods, Supplementary Note). Annotations for the gene sets indicate if the meta-gene set was found significant (shades of green; FDR < 0.01, < 0.05, or not significant) in the DEPICT analysis of GWAS results from Shungin et al.10
Also, we conducted pathway analyses after excluding variants from previous WHRadjBMI analyses10 (Supplemental Note). Seventy-five loci/genes were included in the EC-DEPICT analysis, and we identified 26 significantly enriched gene sets (13 meta-gene sets). Here, all but one gene set, “lipid particle size”, were related to skeletal biology, likely reflecting an effect on the pelvic skeleton (hip circumference), shared signaling pathways between bone and fat (such as TGF-beta) and shared developmental origin24 (Supplementary Data 9, Supplementary Figure 16b). These previously identified GWAS DEPICT significant findings provide a fully independent replication of their biological relevance for WHRadjBMI.
We used PASCAL (Online Methods) to further distinguish between enrichment based on coding-only variant associations (this study) and regulatory-only variant associations (up to 20 kb upstream of the gene from a previous GIANT study10), finding 116 significantly enriched coding pathways (FDR < 0.05; Supplementary Data 10). We also compared the coding pathways to those identified in the total previous GWAS effort (using both coding and regulatory variants) identifying a total of 158 gene sets. Forty-two gene sets were enriched in both analyses, and we found high concordance in the -log10 (p-values) between ExomeChip and GWAS gene set enrichment [Pearson’s r (coding vs regulatory only) = 0.38, P < 10−300; Pearson’s r (coding vs coding+regulatory) = 0.51, P < 10−300)]. Nonetheless, some gene sets were enriched specifically for variants in coding regions (e.g., decreased susceptibility to diet-induced obesity, abnormal skeletal morphology) or unique to variants in regulatory regions (e.g. transcriptional regulation of white adipocytes) (Supplementary Figure 17).
The EC-DEPICT and PASCAL results showed a moderate but strongly significant correlation (for EC-DEPICT and the PASCAL max statistic, r = .28, P = 9.8 × 10−253; for EC-DEPICT and the PASCAL sum statistic, r = 0.287, P = 5.42 × 10−272). Common gene sets strongly implicate a role for skeletal biology, glucose homeostasis/insulin signaling, and adipocyte biology (Supplementary Figure 18).
Cross-trait associations
To assess the clinical relevance of our identified variants with cardiometabolic, anthropometric, and reproductive traits, we conducted association lookups from existing ExomeChip studies of 15 traits (Supplementary Data 11, Supplementary Figure 19).21,25–29 Variants in STAB1 and PLCB3 displayed the greatest number of significant associations with seven different traits (P < 9.8 × 10⁻⁴, 0.05/51 variants tested). Also, these two genes cluster together with RSPO3, DNAH10, MNS1, COBLL1, CCDC92, and ITIH3. The WHR-increasing alleles in this cluster exhibit a previously described pattern of increased cardiometabolic risk (e.g. increased fasting insulin, two-hour glucose [TwoHGlu], and triglycerides; and decreased high-density lipoprotein cholesterol [HDL]), but also decreased BMI.30–36 The impact of central obesity may be causal, as a 1 SD increase in genetic risk of central adiposity was previously associated with higher total cholesterol, triglycerides, fasting insulin and TwoHGlu, and lower HDL.9
We conducted a search in the NHGRI-EBI GWAS Catalog37,38 to determine if our variants are in high LD (R2 > 0.7) with variants associated with traits or diseases not covered by our cross trait lookups (Supplementary Data 12). We identified several cardiometabolic traits (adiponectin, coronary heart disease, etc.), diet/behavioral traits potentially related to obesity (carbohydrate, fat intake, etc.), behavioral and neurological traits (schizophrenia, bipolar disorder, etc.), and inflammatory or autoimmune diseases (Crohn’s Disease, multiple sclerosis, etc.).
Given the established correlation between total body fat percentage and WHR of up to 0.48339–41, we examined the association of our top exome variants with both total body fat percentage (BF%) and truncal fat percentage (TF%) available in a sub-sample of UKBB (N = 118,160) (Supplementary Tables 5–6). Seven of the common novel variants were significantly associated (P < 0.001, 0.05/48 variants examined) with both BF% and TF% in the sexes-combined analysis (COBLL1, UHRF1BP1, WSCD2, CCDC92, IFI30, MPV17L2, IZUMO1) and two with TF% in women only (EFCAB12, GDF5). Only rs7607980 in COBLL1 is near a known BF% GWAS locus (rs6738627; R2 = 0.1989, distance = 6,751 bp, with our tag SNP)42. Of the nine SNPs associated with at least one of these two traits, all variants displayed much greater magnitude of effect on TF% compared to BF% (Supplementary Figure 20).
Previous studies have demonstrated the importance of examining common and LF/RV within genes with mutations known to cause monogenic diseases.43,44 Thus, we assessed enrichment of WHRadjBMI variants within monogenic lipodystrophy and/or insulin resistance genes.43,44 (Supplementary Data 13). No significant enrichment was observed, possibly due in part to the small number of implicated genes and the relatively small number of variants in monogenic disease-causing genes (Supplementary Figure 21).
Genetic architecture of WHRadjBMI coding variants
We used summary statistics from our Stage 1 primary meta-analysis results to estimate the phenotypic variance explained by subsets of variants across various significance thresholds (P < 2 × 10⁻⁷ to 0.2) and conservatively using only independent SNPs (Supplementary Table 7, Online Methods, and Supplementary Figure 22). For only independent coding variants that reached suggestive significance in Stage 1 (P < 2 × 10⁻⁶), 33 SNPs explain 0.38% of the variation. The 1,786 independent SNPs with a liberal threshold of P<0.02 explain 13 times more variation (5.12%), however, these large effect estimates may be subject to winner’s curse. When considering all coding variants on the ExomeChip in combined sexes, 46 SNPs with a P < 2 × 10⁻⁶ and 5,917 SNPs with a P < 0.02 explain 0.51% and 13.75% of the variance in WHRadjBMI, respectively. As expected given the design of the ExomeChip, the majority of the variance explained is attributable to rare and low frequency coding variants. However, for LF/RVs, those that passed significance in Stage 1 explain only 0.10% of the variance in WHRadjBMI. We also estimated variance explained for the same SNPs in women and men separately and observed a greater variance explained in women compared to men (PRsqDiff < 0.002 = 0.05/21, Bonferroni-corrected threshold) at each significance threshold considered (differences ranged from 0.24% to 0.91%).
We conducted penetrance analysis using the UKBB (both sexes combined, and men- and women-only) to determine if there is a significant accumulation of the minor allele in either the centrally obese or non-obese groups (Online Methods). Three rare variants (MAF ≤ 1%) with larger effect sizes (effect size > 0.90) were included in the penetrance analysis using World Health Organization cut-offs for central obesity. Of these, one SNP (rs55920843-ACVR1C; Psex-combined = 9.25 × 10⁻⁵; Pwomen= 4.85 × 10⁻⁵) showed a statistically significant difference in the number of carriers and non-carriers of the minor allele in the combined and female-only analysis (sex-combined obese carriers = 2.2%; non-obese carriers = 2.6%; women obese carriers = 2.1%; non-obese women carriers = 2.6%, Supplementary Table 8, Supplementary Figure 23).
Drosophila Knockdown
Considering the genetic evidence of adipose and insulin biology in determining body fat distribution10, and the lipid signature of the variants described herein, we examined whole-body triglyceride levels in adult Drosophila, a model organism in which the fat body is an organ functionally analogous to mammalian liver and adipose tissue as triglycerides are the major source of fat storage45. Of the 51 genes harboring our 56 significantly associated variants, we identified 27 Drosophila orthologues for functional follow-up analyses. We selected genes with large changes in triglyceride levels (> 20% increase or > 40% decrease, as chance alone is unlikely to cause changes of this magnitude) from an existing large-scale screen with ≤2 replicates per knockdown strain.45 Two orthologues, for PLXND1 and DNAH10, met these criteria and were subjected to additional knockdown experiments with ≥5 replicates using tissue-specific drivers (fat body [cg-Gal4] and neuronal [elav-Gal4] specific RNAi-knockdowns) (Supplementary Table 9). A significant (P < 0.025, 0.05/2 orthologues) increase in the total body triglyceride levels was observed in DNAH10 orthologue knockdown strains for both the fat body and neuronal drivers. Only the neuronal driver knockdown for PLXND1 produced a significant change in triglyceride storage. DNAH10 and PLXND1 both lie within previous GWAS identified regions. Adjacent genes have been highlighted as likely candidates for the DNAH10 association region, including CCDC92 and ZNF664 based on expression quantitative trait locus (eQTL) evidence. Of note, rs11057353 in DNAH10 showed suggestive significance after conditioning on the known GWAS variants in nearby CCDC92 (sex-combined Pconditional = 7.56 × 10⁻⁷; women-only rs11057353 Pconditional = 5.86 × 10⁻⁷, Supplementary Table 4) thus providing some evidence of multiple causal variants/genes underlying this signal. Further analyses are needed to determine whether the implicated coding variants from the current analysis are the putatively functional variants.
eQTL Lookups
We examined the cis-association of variants with expression level of nearby genes in subcutaneous and visceral omental adipose, skeletal muscle, and pancreas tissue from the Genotype-Tissue Expression (GTEx)46 project, and assessed whether exome and eQTL associations implicated the same signal (Online Methods, Supplementary Data 14–15). The lead exome variant was associated with expression level of the gene itself for DAGLB, MLXIPL, CCDC92, MAPKBP1, LRRC36 and UQCC1. However, for MLXIPL, MAPKBP1, and LRRC36, the lead variant is also associated with expression of additional nearby genes. At three additional loci, the lead exome variant is only associated with expression level of nearby genes (HEMK1 at C3orf18; NT5DC2, SMIM4 and TMEM110 at STAB1/ITIH3; and C6orf106 at UHRF1BP1). Thus, although detected with a missense variant, these results are also consistent with a regulatory mechanism of effect, and the association signal may well be due to linkage disequilibrium (LD) with nearby regulatory variants.
Some of the coding genes implicated by eQTL analyses are known to be involved in adipocyte differentiation or insulin sensitivity: e.g. for MLXIPL, the encoded carbohydrate responsive element binding protein is a transcription factor, regulating glucose-mediated induction of de novo lipogenesis in adipose tissue, and expression of its beta-isoform in adipose tissue is positively correlated with adipose insulin sensitivity47,48. For CCDC92, the reduced adipocyte lipid accumulation upon knockdown confirmed the involvement of its encoded protein in adipose differentiation49.
Biological Curation
To investigate the possible functional role of the identified variants, we conducted thorough searches of the literature and publicly available bioinformatics databases (Supplementary Data 16–17, Box 1, Online Methods). Many of our novel LF/RV are in genes that are intolerant of nonsynonymous mutations (e.g. ACVR1C, DARS2, FGFR2; ExAC Constraint Scores >0.5). Other coding variants lie within genes that are involved in glucose homeostasis (e.g. ACVR1C, UGGT2, ANGPTL4), angiogenesis (RASIP1), adipogenesis (RAPGEF3), and lipid biology (ANGPTL4, DAGLB).
Box 1. Genes of biological interest harboring WHR-associated variants.
PLXND1– (3:129284818, rs2625973, known locus) The major allele of a common non-synonymous variant in Plexin D1 (L1412V, MAF = 26.7%) is associated with increased WHRadjBMI (β (SE)= 0.0156 (0.0024), P-value = 9.16 × 10⁻¹¹). PLXND1 encodes a semaphorin class 3 and 4 receptor gene, and therefore, is involved in cell to cell signaling and regulation of growth in development for a number of different cell and tissue types, including those in the cardiovascular system, skeleton, kidneys, and the central nervous system77–81. Mutations in this gene are associated with Moebius syndrome82–85, and persistent truncus arteriosus79,86. PLXND1 is involved in angiogenesis as part of the SEMA and VEGF signalling pathways87–90. PLXND1 was implicated in the development of T2D through its interaction with SEMA3E in mice. SEMA3E and PLXND1 are upregulated in adipose tissue in response to diet-induced obesity, creating a cascade of adipose inflammation, insulin resistance, and diabetes mellitus81. PLXND1 is highly expressed in adipose (both subcutaneous and visceral) (GTeX). PLXND1 is highly intolerant of mutations and therefore highly conserved (Supplementary Data 16). Last, our lead variant is predicted as damaging or possibly damaging for all algorithms examined (SIFT, Polyphen2/HDIV, Polyphen2/HVAR, LRT, MutationTaster).
ACVR1C– (2:158412701, rs55920843, novel locus) The major allele of a low frequency non-synonymous variant in activin A receptor type 1C (rs55920843, N150H, MAF = 1.1%) is associated with increased WHRadjBMI (β (SE)= 0.0652 (0.0105), P-value = 4.81 × 10⁻¹⁰). ACVR1C, also called Activin receptor-like kinase 7 (ALK7), encodes a type I receptor for TGFB (Transforming Growth Factor, Beta-1), and is integral for the activation of SMAD transcription factors; therefore, ACVR1C plays an important role in cellular growth and differentiation64–68, including adipocytes68. Mouse Acvr1c decreases secretion of insulin and is involved in lipid storage69,72,73,69,72,73,91. ACVR1C exhibits the highest expression in adipose tissue, but is also highly expressed in the brain (GTEx)69–71. Expression is associated with body fat, carbohydrate metabolism and lipids in both obese and lean individuals70. ACVR1C is moderately tolerant of mutations (ExAC Constraint Scores: synonymous = -0.86, nonsynonymous = 1.25, LoF = 0.04, Supplementary Data 16). Last, our lead variant is predicted as damaging for two of five algorithms examined (LRT and MutationTaster).
FGFR2– (10:123279643, rs138315382, novel locus) The minor allele of a rare synonymous variant in Fibroblast Growth Factor Receptor 2 (rs138315382, MAF=0.09%) is associated with increased WHRadjBMI (β (SE) = 0.258 (0.049), P-value = 1.38 × 10−07). The extracellular portion of the FGFR2 protein binds with fibroblast growth factors, influencing mitogenesis and differentiation. Mutations in this gene have been associated with many rare monogenic disorders, including skeletal deformities, craniosynostosis, eye abnormalities, and LADD syndrome, as well as several cancers including breast, lung, and gastric cancer. Methylation of FGFR2 is associated with high birth weight percentile92. FGFR2 is tolerant of synonymous mutations, but highly intolerant of missense and loss-of-function mutations (ExAC Constraint scores: synonymous = -0.9, missense = 2.74, LoF=1.0, Supplementary Data 16)). Last, this variant is not predicted to be damaging based on any of the five algorithms tested.
ANGPTL4– (19:8429323, rs116843064, novel locus) The major allele of a nonsynonymous low frequency variant in Angiopoietin Like 4 (rs116843064, E40K, EAF=98.1%) is associated with increased WHRadjBMI (β (SE) = 0.064 (0.011) P-value = 1.20 × 10−09). ANGPTL4 encodes a glycosylated, secreted protein containing a C-terminal fibrinogen domain. The encoded protein is induced by peroxisome proliferation activators and functions as a serum hormone that regulates glucose homeostasis, triglyceride metabolism93,94, and insulin sensitivity95. Angptl4-deficient mice have hypotriglyceridemia and increased lipoprotein lipase (LPL) activity, while transgenic mice overexpressing Angplt4 in the liver have higher plasma triglyceride levels and decreased LPL activity96. The major allele of rs116843064 has been previously associated with increased risk of coronary heart disease and increased triglycerides63. ANGPTL4 is moderately tolerant of mutations (ExAC constraint scores synonymous = 1.18, missense = 0.21, LoF = 0.0, Supplementary Data 16). Last, our lead variant is predicted damaging for four of five algorithms (SIFT, Polyphen 2/HDIV, Polyphen2/HVAR, and MutationTaster).
RREB1– (6:7211818, rs1334576, novel association signal) The major allele of a common non-synonymous variant in the Ras responsive element binding protein 1 (rs1334576, G195R, EAF = 56%) is associated with increased WHRadjBMI (β (SE) = 0.017 (0.002), P-value = 3.9 × 10⁻¹⁵). This variant is independent of the previously reported GWAS signal in the RREB1 region (rs1294410; 6:673875210). The protein encoded by this gene is a zinc finger transcription factor that binds to RAS-responsive elements (RREs) of gene promoters. It has been shown that the calcitonin gene promoter contains an RRE and
PLXND1– (3:129284818, rs2625973, known locus) The major allele of a common non-synonymous variant in Plexin D1 (L1412V, MAF = 26.7%) is associated with increased WHRadjBMI (β (SE)= 0.0156 (0.0024), P-value = 9.16 × 10⁻¹¹). PLXND1 encodes a semaphorin class 3 and 4 receptor gene, and therefore, is involved in cell to cell signaling and regulation of growth in development for a number of different cell and tissue types, including those in the cardiovascular system, skeleton, kidneys, and the central nervous system77–81. Mutations in this gene are associated with Moebius syndrome82–85, and persistent truncus arteriosus79,86. PLXND1 is involved in angiogenesis as part of the SEMA and VEGF signalling pathways87–90. PLXND1 was implicated in the development of T2D through its interaction with SEMA3E in mice. SEMA3E and PLXND1 are upregulated in adipose tissue in response to diet-induced obesity, creating a cascade of adipose inflammation, insulin resistance, and diabetes mellitus81. PLXND1 is highly expressed in adipose (both subcutaneous and visceral) (GTeX). PLXND1 is highly intolerant of mutations and therefore highly conserved (Supplementary Data 16)). Last, our lead variant is predicted as damaging or possibly damaging for all algorithms examined (SIFT, Polyphen2/HDIV, Polyphen2/HVAR, LRT, MutationTaster).
ACVR1C– (2:158412701, rs55920843, novel locus) The major allele of a low frequency non-synonymous variant in activin A receptor type 1C (rs55920843, N150H, MAF = 1.1%) is associated with increased WHRadjBMI (β (SE)= 0.0652 (0.0105), P-value = 4.81 × 10⁻¹⁰). ACVR1C, also called Activin receptor-like kinase 7 (ALK7), encodes a type I receptor for TGFB (Transforming Growth Factor, Beta-1), and is integral for the activation of SMAD transcription factors; therefore, ACVR1C plays an important role in cellular growth and differentiation64–68, including adipocytes68. Mouse Acvr1c decreases secretion of insulin and is involved in lipid storage69,72,73,69,72,73,91. ACVR1C exhibits the highest expression in adipose tissue, but is also highly expressed in the brain (GTEx)69–71. Expression is associated with body fat, carbohydrate metabolism and lipids in both obese and lean individuals70. ACVR1C is moderately tolerant of mutations (ExAC Constraint Scores: synonymous = -0.86, nonsynonymous = 1.25, LoF = 0.04, Supplementary Data 16)). Last, our lead variant is predicted as damaging for two of five algorithms examined (LRT and MutationTaster).
FGFR2– (10:123279643, rs138315382, novel locus) The minor allele of a rare synonymous variant in Fibroblast Growth Factor Receptor 2 (rs138315382, MAF=0.09%) is associated with increased WHRadjBMI (β (SE) = 0.258 (0.049), P-value = 1.38 × 10−07). The extracellular portion of the FGFR2 protein binds with fibroblast growth factors, influencing mitogenesis and differentiation. Mutations in this gene have been associated with many rare monogenic disorders, including skeletal deformities, craniosynostosis, eye abnormalities, and LADD syndrome, as well as several cancers including breast, lung, and gastric cancer. Methylation of FGFR2 is associated with high birth weight percentile92. FGFR2 is tolerant of synonymous mutations, but highly intolerant of missense and loss-of-function mutations (ExAC Constraint scores: synonymous = -0.9, missense = 2.74, LoF=1.0, Supplementary Data 16)). Last, this variant is not predicted to be damaging based on any of the five algorithms tested.
ANGPTL4– (19:8429323, rs116843064, novel locus) The major allele of a nonsynonymous low frequency variant in Angiopoietin Like 4 (rs116843064, E40K, EAF=98.1%) is associated with increased WHRadjBMI (β (SE) = 0.064 (0.011) P-value = 1.20 × 10−09). ANGPTL4 encodes a glycosylated, secreted protein containing a C-terminal fibrinogen domain. The encoded protein is induced by peroxisome proliferation activators and functions as a serum hormone that regulates glucose homeostasis, triglyceride metabolism93,94, and insulin sensitivity95. Angptl4-deficient mice have hypotriglyceridemia and increased lipoprotein lipase (LPL) activity, while transgenic mice overexpressing Angplt4 in the liver have higher plasma triglyceride levels and decreased LPL activity96. The major allele of rs116843064 has been previously associated with increased risk of coronary heart disease and increased triglycerides63. ANGPTL4 is moderately tolerant of mutations (ExAC constraint scores synonymous = 1.18, missense = 0.21, LoF = 0.0, Supplementary Data 16). Last, our lead variant is predicted damaging for four of five algorithms (SIFT, Polyphen 2/HDIV, Polyphen2/HVAR, and MutationTaster).
RREB1– (6:7211818, rs1334576, novel association signal) The major allele of a common non-synonymous variant in the Ras responsive element binding protein 1 (rs1334576, G195R, EAF = 56%) is associated with increased WHRadjBMI (β (SE) = 0.017 (0.002), P-value = 3.9 × 10⁻¹⁵). This variant is independent of the previously reported GWAS signal in the RREB1 region (rs1294410; 6:673875210). The protein encoded by this gene is a zinc finger transcription factor that binds to RAS-responsive elements (RREs) of gene promoters. It has been shown that the calcitonin gene promoter contains an RRE and that the encoded protein binds there and increases expression of calcitonin, which may be involved in Ras/Raf-mediated cell differentiation97–99. The ras responsive transcription factor RREB1 is a candidate gene for type 2 diabetes associated end-stage kidney disease98. This variant is highly intolerant to loss of function (ExAC constraint score LoF = 1, Supplementary Data 16)).
DAGLB – (7:6449496, rs2303361, novel locus) The minor allele of a common non-synonymous variant (rs2303361, Q664R, MAF = 22%) in DAGLB (Diacylglycerol lipase beta) is associated with increased WHRadjBMI (β (SE) = 0.0136 (0.0025), P-value = 6.24 × 10⁻⁸). DAGLB encodes a diacylglycerol (DAG) lipase that catalyzes the hydrolysis of DAG to 2-arachidonoyl-glycerol, the most abundant endocannabinoid in tissues. In the brain, DAGL activity is required for axonal growth during development and for retrograde synaptic signaling at mature synapses (2-AG)100. The DAGLB variant, rs702485 (7:6449272, r2 = 0.306 and D’=1 with rs2303361) has been previously associated with high-density lipoprotein cholesterol (HDL) previously. Pathway analysis indicate a role in the triglyceride lipase activity pathway 101. DAGLB is tolerant of synonymous mutations, but intolerant of missense and loss of function mutations (ExAC Constraint scores: synonymous = -0.76, missense = 1.07, LoF = 0.94, Supplementary Data 16)). Last, this variant is not predicted to be damaging by any of the algorithms tested.
MLXIPL (7:73012042, rs35332062 and 7:73020337, rs3812316, known locus) The major alleles of two common non-synonymous variants (A358V, MAF = 12%; Q241H, MAF = 12%) in MLXIPL (MLX interacting protein like) are associated with increased WHRadjBMI (β (SE) = 0.02 (0.0033), P-value = 1.78 × 10⁻⁹; β (SE) = 0.0213 (0.0034), P-value = 1.98 × 10⁻¹⁰). These variants are in strong linkage disequilibrium (r2=1.00, D’=1.00, 1000 Genomes CEU). This gene encodes a basic helix-loop-helix leucine zipper transcription factor of the Myc/Max/Mad superfamily. This protein forms a heterodimeric complex and binds and activates carbohydrate response element (ChoRE) motifs in the promoters of triglyceride synthesis genes in a glucose-dependent manner74,75. This gene is possibly involved in the growth hormone signaling pathway and lipid metabolism. The WHRadjBMI-associated variant rs3812316 in this gene has been associated with the risk of non-alcoholic fatty liver disease and coronary artery disease74,102,103. Furthermore, Williams-Beuren syndrome (an autosomal dominant disorder characterized by short stature, abnormal weight gain, various cardiovascular defects, and mental retardation) is caused by a deletion of about 26 genes from the long arm of chromosome 7 including MLXIPL. MLXIPL is generally intolerant to variation, and therefore conserved (ExAC Constraint scores: synonymous = 0.48, missense = 1.16, LoF = 0.68, Supplementary Data 16)). Last, both variants reported here are predicted as possible or probably damaging by one of the algorithms tested (PolyPhen).
RAPGEF3 (12:48143315, rs145878042, novel locus) The major allele of a low frequency non-synonymous variant in Rap Guanine-Nucleotide-Exchange Factor (GEF) 3 (rs145878042, L300P, MAF = 1.1%) is associated with increased WHRadjBMI (β (SE) = 0.085 (0.010), P-value = 7.15 × 10⁻¹⁷). RAPGEF3 codes for an intracellular cAMP sensor, also known as Epac (the Exchange Protein directly Activated by Cyclic AMP). Among its many known functions, RAPGEF3 regulates the ATP sensitivity of the KATP channel involved in insulin secretion104, may be important in regulating adipocyte differentiation105–107, plays an important role in regulating adiposity and energy balance108. RAPGEF3 is tolerant of mutations (ExAC Constraint Scores: synonymous = -0.47, nonsynonymous = 0.32, LoF = 0, Supplementary Data 16)). Last, our lead variant is predicted as damaging or possibly damaging for all five algorithms examined (SIFT, Polyphen2/HDIV, Polyphen2/HVAR, LRT, MutationTaster).
TBX15 (1:119427467, rs61730011, known locus) The major allele of a low frequency non-synonymous variant in T-box 15 (rs61730011, M460R, MAF = 4.3%) is associated with increased WHRadjBMI (β(SE) = 0.041(0.005)). T-box 15 (TBX15) encodes a developmental transcription factor expressed in adipose tissue, but with higher expression in visceral adipose tissue than in subcutaneous adipose tissue, and is strongly downregulated in overweight and obese individuals109. TBX15 negatively controls depot-specific adipocyte differentiation and function110 and regulates glycolytic myofiber identity and muscle metabolism111. TBX15 is moderately intolerant of mutations and therefore conserved (ExAC Constraint Scores: synonymous = 0.42, nonsynonymous = 0.65, LoF = 0.88, Supplementary Data 16)). Last, our lead variant is predicted as damaging or possibly damaging for four of five algorithms (Polyphen2/HDIV, Polyphen2/HVAR, LRT, MutationTaster).
DISCUSSION
Our analysis of coding variants from ExomeChip data in up to 476,546 individuals identified a total of 56 array-wide significant WHRadjBMI associated variants in 41 independent association signals, including 24 newly identified (23 novel and one independent of known GWAS signals). Nine of these variants were LF/RV, indicating an important role for such variants in the polygenic architecture of fat distribution. While, due to their rarity, these coding variants explain a small proportion of the trait variance at a population level, they may be more functionally tractable than non-coding variants and have a critical impact at the individual level. For instance, the association between a LF/RV (rs11209026; R381Q; MAF < 5% in ExAC) located in the IL23R gene and multiple inflammatory diseases50–53 led to development of new therapies targeting IL23 and IL12 in the same pathway.54–56 Thus, we are encouraged that our LF/RV displayed large effect sizes; all but one of the nine novel LF/RV display larger effects than the 49 SNPs reported in Shungin et al. 201510, and some of these effects were up to 7-fold larger than those previously reported for GWAS. This finding mirrors results for other cardiometabolic traits57, and suggests variants of possible clinical significance with even larger effect and rarer variants will likely be detected with greater sample sizes.
We continue to observe sexual dimorphism in the genetic architecture of WHRadjBMI11. We identified 19 coding variants with significant sex differences, of which 16 (84%) display larger effects in women compared to men. Of the variants outside of GWAS loci, we reported three (two LF/RV) that show a significantly stronger effect in women and two (one LF/RV) that show a stronger effect in men. Genetic variants continue to explain a higher proportion of the phenotypic variation in body fat distribution in women compared to men.10,11 Of the novel female (DSTYK and ANGPTL4) and male (UGGT2 and MMP14) specific signals, only ANGPTL4 implicated fat distribution related biology associated with both lipid biology and cardiovascular traits (Box 1). Sexual dimorphism in fat distribution is apparent58−60 and at sexually dimorphic loci, hormones with different levels in men and women may interact with genomic and epigenomic factors to regulate gene activity, though this remains to be tested. Dissecting the underlying molecular mechanisms of the sexual dimorphism in body fat distribution, and how it is correlated with – and causing – important comorbidities like cardiometabolic diseases will be crucial for improved understanding of disease pathogenesis.
Overall, we observe fewer significant associations, pathways, and cross-trait associations between WHRadjBMI and coding variants on the ExomeChip than Turcot et al for BMI25. One reason for this may be smaller sample size (NWHRadjBMI = 476,546, NBMI = 718,639), and thus, lower statistical power. Power is likely not the only contributing factor, as trait architecture, heritability (possibly overestimated in some phenotypes), and phenotype precision all likely contribute to our study’s capacity to identify LF/RV with large effects. Further, it is possible that the comparative lack of significant findings for WHRadjBMI may be a result of higher selective pressure against genetic predisposition to cardiometabolic phenotypes, thus rarer risk variants.61 The ExomeChip is limited by the variants present on the chip, which was largely dictated by sequencing studies in European-ancestry populations and MAF detection criteria of ~0.012%. It is likely that through increased sample size, use of chips designed to detect variation across a range of continental ancestries, and high quality, deep imputation with large reference samples future studies will detect additional variation from the entire allele frequency spectrum that contributes to fat distribution.
The collected genetic and epidemiologic evidence has demonstrated that increased central adiposity is correlated with risk of T2D and CVD, and that this association is likely causal with potential mediation through blood pressure, triglyceride-rich lipoproteins, glucose, and insulin9. This observation yields an immediate follow-up question: Which mechanisms regulate depot-specific fat accumulation and are risks for disease driven by increased visceral and/or decreased subcutaneous adipose tissue mass. Pathway analysis identified several novel pathways and gene sets related to metabolism and adipose regulation, bone growth and development and adiponectin, a hormone which has been linked to “healthy” expansion of adipose tissue and insulin sensitivity.62 Similarly, expression/eQTL results support the relevance of adipogenesis, adipocyte biology, and insulin signaling, supporting our previous findings for WHRadjBMI.10 We also provide evidence suggesting known biological functions and pathways contributing to body fat distribution (e.g., diet-induced obesity, angiogenesis, bone growth/morphology, and lipolysis).
The ultimate aim of genetic investigations of obesity-related traits is to identify dysregulated genomic pathways leading to obesity pathogenesis that may result in a myriad of downstream illnesses. Thus, our findings may enhance the understanding of central obesity and identify new molecular targets to avert its negative health consequences. Significant cross-trait associations are consistent with expected direction of effect for several traits, i.e. the WHR-increasing allele is associated with higher values of triglycerides, DBP, fasting insulin, total cholesterol, LDL and T2D across many significant variants. However, it is worth noting that there are some exceptions. For example, rs9469913-A in UHRF1BP1 is associated with both increased WHRadjBMI and increased HDL. Also, we identified two variants in MLXIPL (rs3812316 and rs35332062), a well-known lipids-associated locus, in which the WHRadjBMI-increasing allele also increases all lipid levels, risk for hypertriglyceridemia, SBP and DBP. However, our findings show a significant and negative association with HbA1C, and nominally significant and negative associations with two-hour glucose, fasting glucose, and Type 2 diabetes, and potential negative associations with biomarkers for liver disease (e.g. gamma glutamyl transpeptidase). Other notable exceptions include ITIH3 (negatively associated with BMI, HbA1C, LDL and SBP), DAGLB (positively associated with HDL), and STAB1 (negatively associated with total cholesterol, LDL, and SBP). Therefore, caution in selecting pathways for therapeutic targets is warranted; we must look beyond the effects on central adiposity to the potential cascading effects of related diseases.
A major finding from this study is the importance of lipid metabolism for body fat distribution. In fact, pathway analyses that highlight enhanced lipolysis, cross-trait associations with circulating lipid levels, existing biological evidence from the literature, and knockdown experiments in Drosophila, point to novel candidate genes (ANGPTL4, ACVR1C, DAGLB, MGA, RASIP1, and IZUMO1) and new candidates in known regions (DNAH1010 and MLXIPL14) related to lipid biology and their role in fat storage. ACVR1C, MLXIPL, and ANGPTL4, all of which are involved in lipid homeostasis, all are excellent candidate genes for central adiposity. Carriers of inactivating mutations in ANGPTL4 (Angiopoietin Like 4), for example, display low triglycerides and low risk of coronary artery disease63. ACVR1C encodes the activin receptor-like kinase 7 protein (ALK7), a receptor for the transcription factor TGFB-1, well known for its central role in general growth and development64–68, and adipocyte development particularly68. ACVR1C exhibits the highest expression in adipose tissue, but is also highly expressed in the brain69–71. In mice, decreased activity of ACVR1C upregulates PPARγ and C/EBPα pathways and increases lipolysis in adipocytes, thus decreasing weight and diabetes.69,72,73 Such activity suggests a role for ALK7 in adipose tissue signaling and a possible therapeutic target. MLXIPL, also important for lipid metabolism and postnatal cellular growth, encodes a transcription factor which activates triglyceride synthesis genes in a glucose-dependent manner.74,75 The lead exome variant in MLXIPL is highly conserved, most likely damaging, and associated with reduced MLXIPL expression in adipose tissue. Furthermore, in a recent longitudinal, in vitro transcriptome analysis of adipogenesis in human adipose-derived stromal cells, gene expression of MLXIPL was up-regulated during the maturation of adipocytes, suggesting a critical role in the regulation of adipocyte size and accumulation.76 However, given our cross-trait associations with variants in MLXIPL and diabetes-related traits, development of therapeutic targets must be approached cautiously.
Our 24 novel variants for WHRadjBMI highlight the importance of lipid metabolism in the genetic underpinnings of body fat distribution. We continue to demonstrate the critical role of adipocyte biology and insulin resistance for central obesity and offer support for potentially causal genes underlying previously identified fat distribution loci. Notably, our findings offer potential new therapeutic targets for intervention in the risks associated with abdominal fat accumulation and represents a major advance in our understanding of the underlying biology and genetic architecture of central adiposity.
ONLINE METHODS
Studies
Stage 1 included 74 studies (12 case/control, 59 population-based, and five family) comprising 344,369 adults of European (N=288,492), African (N=15,687), South Asian (N=29,315), East Asian (N=6,800), and Hispanic (N=4,075) descent. Stage 1 meta-analyses were conducted in each ancestry and in all ancestries together, for both sex-combined and sex-specific analyses. Follow-up analyses were performed in 132,177 individuals of European ancestry from deCODE and the UK Biobank, Release 1112 (UKBB) (Supplementary Data 1–3). Informed consent was obtained by the parent study and protocols approved by each study’s institutional review boards.
Phenotypes
For each study, WHR (waist circumference divided by hip circumference) was corrected for age, BMI, and genomic principal components (derived from GWAS data, the variants with MAF >1% on the ExomeChip, and ancestry informative markers available on the ExomeChip), as well as any additional study-specific covariates (e.g. recruiting center), in a linear regression model. For studies with unrelated individuals, residuals were calculated separately by sex, whereas for family-based studies sex was included as a covariate in models with both men and women. Residuals for case/control studies were calculated separately. Finally, residuals were inverse normal transformed and used as the outcome in association analyses. Phenotype descriptives by study are shown in Supplementary Data 3.
Genotypes and QC
The majority of studies followed a standardized protocol and performed genotype calling using the algorithms indicated in Supplementary Data 2, which typically included zCall3. For 10 studies from the Cohorts for Heart and Aging Research in Genomic Epidemiology (CHARGE) Consortium, raw intensity data for samples from seven genotyping centers were combined for joint calling4. Study-specific quality control (QC) of the genotyped variants was implemented before association analysis (Supplementary Data 1–2). To assess whether any significant associations with rare and low-frequency variants could be due to allele calling in smaller studies, we performed a sensitivity meta-analysis of all large studies (>5,000 participants) compared to all studies. We found very high concordance for effect sizes, suggesting that smaller studies do not bias our results (Supplementary Fig. 24).
Study-level statistical analyses
Each cohort performed single variant analyses for both additive and recessive models in each ancestry, for sexes combined and sex-specific groups, with either RAREMETALWORKER (see URLs) or RVTESTs (see URLs). to associate inverse normal transformed WHRadjBMI with genotype accounting for cryptic relatedness (kinship matrix) in a linear mixed model. Both programs perform score-statistic rare-variant association analysis, accommodate unrelated and related individuals, and provide single-variant results and variance-covariance matrices. The covariance matrix captures linkage disequilibrium (LD) between markers within 1 Mb, which is used for gene-level meta-analyses and conditional analyses113,114.
Centralized quality-control
Individual cohorts identified ancestry outliers based on 1000 Genomes Phase 1 reference populations. A centralized QC procedure implemented in EasyQC115 was applied to individual cohort summary statistics to identify cohort-specific problems: (1) possible errors in phenotype residual transformation; (2) strand issues, and (3) inflation due to population stratification, cryptic relatedness and genotype biases.
Meta-analyses
Meta-analyses were carried out in parallel by two analysts at two sites using RAREMETAL113. We excluded variants if they had call rate <95%, Hardy-Weinberg equilibrium P-value <1×10⁻⁷, or large allele frequency deviations from reference populations (>0.6 for all ancestries analyses and >0.3 for ancestry-specific population analyses). We also excluded markers not present on the Illumina ExomeChip array 1.0, Y-chromosome and mitochondrial variants, indels, multiallelic markers, and problematic variants based on Blat-based sequence alignment. Significance for single-variant analyses was defined at an array-wide level (P<2×10⁻⁷). For all suggestive significant variants (P<2×10⁻⁶) from Stage 1, we calculated Psexhet for each SNP, testing for differences between women-specific and men-specific beta estimates and standard errors using EasyStrata116. Each SNP that reached Psexhet<0.05/# of variants tested (70 variants brought forward from Stage 1, Psexhet<7.14×10⁻⁴) was considered significant. Additionally, while each individual study was asked to perform association analyses stratified by ancestry and adjusted for population stratification, all study-specific summary statistics were combined in our all ancestry meta-analyses. To investigate potential heterogeneity across ancestries, we examined ancestry-specific meta-analysis results for our top 70 variants from Stage 1 and found no evidence of significant across-ancestry heterogeneity for any of our top variants (I2 values noted in Supplementary Data 4–6).
For the gene-based analyses, we applied two sets of criteria to select variants with a MAF<5% within each ancestry based on coding variant annotation from five prediction algorithms (PolyPhen2, HumDiv and HumVar, LRT, MutationTaster, and SIFT)117. Our broad gene-based tests included nonsense, stop-loss, splice site, and missense variants annotated as damaging by at least one algorithm mentioned above. Our strict gene-based tests included only nonsense, stop-loss, splice site, and missense variants annotated as damaging by all five algorithms. These analyses were performed using the sequence kernel association test (SKAT) and variable threshold (VT) methods in RAREMETAL113. Statistical significance for gene-based tests was set at a Bonferroni-corrected threshold of P<2.5×10⁻⁶ (0.05/~20,000 genes).
Genomic inflation
We observed marked genomic inflation of the test statistics even after controlling for population stratification arising mainly from common markers; λGC in the primary meta-analysis (combined ancestries and combined sexes) was 1.06 for all variants and 1.37 for common coding and splice site markers, respectively (Supplementary Figures 3, 7 and 13, Supplementary Table 10). Such inflation is expected for a highly polygenic trait like WHRadjBMI, for studies using a non-random set of variants across the genome, and is consistent with our very large sample size115,118,119.
Conditional analyses
The RAREMETAL R-package113 was used to identify independent WHRadjBMI association signals across all ancestries and European meta-analysis results. RAREMETAL performs conditional analyses using covariance matrices to distinguish true signals from shadows of adjacent significant variants in LD. First, we identified lead variants (P<2×10⁻⁷) based on a 1Mb window centered on the most significant variant. We then conditioned on the lead variants in RAREMETAL and kept new lead signals at P<2×10⁻⁷ for conditioning in a second round of analysis. The process was repeated until no additional signal emerged below the pre-specified P-value threshold (P<2×10⁻⁷).
To test if the associations detected were independent of previously published WHRadjBMI variants 10,14,16, we used RAREMETAL to perform conditional analyses in the Stage 1 discovery set if the GWAS variant or its proxy (r2≥0.8) was on the ExomeChip. All variants identified in our meta-analysis and the previously published variants were available in the UKBB dataset112, which was used as a replacement dataset if a good proxy was not on the ExomeChip. All conditional analyses in the UKBB were performed using SNPTEST120-122.
The conditional analyses were carried out reciprocally, conditioning on the ExomeChip variant and then the previously published variant. An association was considered independent if it was significant prior to conditional analysis (P<2×10⁻⁷) with both the exome chip variant and the previously published variant, and the observed association with our variant remained significant upon conditional analysis. Conditional p-values between 9×10⁻⁶ and 0.05 was considered inconclusive, while those < 9×10⁻⁶ were considered suggestive.
Stage 2 meta-analyses
In Stage 2, we sought to validate 70 Stage 1 variants (P<2×10⁻⁶) in two independent studies, UKBB (N=119,572) and deCODE (N=12,605), using the same QC and analytical methodology. Genotyping, study descriptions and phenotype descriptives are provided in Supplementary Data 1–3. Stage 1+ 2 meta-analysis was performed using the inverse-variance weighted fixed effects method. Significant associations were defined as those nominally significant (P<0.05) in Stage 2 when available in Stage 2, and array-wide significance for Stage 1+2 at P<2×10⁻⁷ (0.05/~250,000 246,328 variants tested). Variants are considered novel and statistically significant if they were greater than one megabase (Mb) from a previously-identified WHRadjBMI lead SNP10–16 and achieved a significance threshold of P<2×10⁻⁷.
Pathway enrichment analyses: EC-DEPICT
We adapted DEPICT, a gene set enrichment analysis method for GWAS data, for use with the ExomeChip (‘EC-DEPICT’) described further in a companion manuscript21. DEPICT uses “reconstituted” gene sets, where different types of gene sets (e.g. canonical pathways, protein-protein interaction networks, and mouse phenotypes) were extended through large-scale microarray data (see Pers et al.20 for details). EC-DEPICT computes p-values based on Swedish ExomeChip data (Malmö Diet and Cancer (MDC), All New Diabetics in Scania (ANDIS), and Scania Diabetes Registry (SDR) cohorts, N=11,899) and, unlike DEPICT, takes as input only genes directly containing significant (coding) variants rather than all genes within a specified LD (Supplementary Note).
Two analyses were performed for WHRadjBMI ExomeChip: one with all variants p<5×10⁻⁴ (49 significant gene sets in 25 meta-gene sets, FDR <0.05) and one with all variants > 1 Mb from known GWAS loci10 (26 significant gene sets in 13 meta-gene sets, FDR <0.05). Affinity propagation clustering123 was used to group highly correlated gene sets into “meta-gene sets”; for each meta-gene set, the member gene set with the best p-value was used for visualization (Supplementary Note). EC-DEPICT was written in Python (see URLs).
Pathway enrichment analyses: PASCAL
We also applied PASCAL pathway analysis22 to summary statistics from Stage 1 for all coding variants. PASCAL derives gene-based scores (SUM and MAX) and tests for over-representation of high gene scores in predefined biological pathways. We performed both MAX and SUM estimations for pathway enrichment. MAX is sensitive to genesets driven by a single signal, while SUM is better for multiple variant associations in the same gene. We used standard pathway libraries from KEGG, REACTOME and BIOCARTA, and also added dichotomized (Z-score>3) reconstituted gene sets from DEPICT20. To accurately estimate SNP-by-SNP correlations even for rare variants, we used the UK10K data (TwinsUK124 and ALSPAC125, N=3781). To distinguish contributions of regulatory and coding variants, we also applied PASCAL to summary statistics of only regulatory variants (20 kb upstream) and regulatory+coding variants from the Shungin et al10 study. In this way, we could investigate what is gained by analyzing coding variants.
Monogenic obesity enrichment analyses
We compiled two lists consisting of 31 genes with strong evidence that disruption causes monogenic forms of insulin resistance or diabetes; and eight genes with evidence that disruption causes monogenic forms of lipodystrophy. To test for association enrichment, we conducted simulations by matching each gene with others based on gene length and number of variants tested to create 1,000 matched gene sets and assessed how often the number of variants exceeding set significance thresholds was greater than in our monogenic obesity gene set.
Variance explained
We estimated phenotypic variance explained by Stage 1 associations in all ancestries for men, women, and combined sexes126. For each associated region, we pruned subsets of SNPs within 500 kb of SNPs with the lowest P-value and used varying P-value thresholds (ranging from 2×10⁻⁷ to 0.02) from the combined sexes results. Additionally, we examined all variants and independent variants across a range of MAFs. The variance explained by each subset of SNPs in each stratum was estimated by summing the variance explained by individual top coding variants. To compare variance explained between men and women, we tested for significant differences assuming the weighted sum of χ2-distributed variables tend to a Gaussian distribution following Lyapunov’s central limit theorem.126,127
Cross-trait lookups
To evaluate relationships between WHRadjBMI and related cardiometabolic, anthropometric, and reproductive traits, association results for the 51 WHRadjBMI coding SNPs were requested from seven consortia, including ExomeChip data from GIANT (BMI, height), Global Lipids Genetics Consortium (GLGC) (total cholesterol, triglycerides, HDL-cholesterol, LDL-cholesterol), International Consortium for Blood Pressure (IBPC)128 (systolic and diastolic blood pressure), Meta-Analyses of Glucose and Insulin-related traits Consortium (MAGIC) (glycemic traits), and DIAbetes Genetics Replication And Meta-analysis (DIAGRAM) consortium (type 2 diabetes). )21,25–29. For coronary artery disease, we accessed 1000 Genomes Project-imputed GWAS data released by CARDIoGRAMplusC4D129 and for age at menarche and menopause, we used a combination of ExomeChip and 1000 Genomes Project-imputed GWAS data from ReproGen. Heatmaps were generated with gplots (R v3.3.2) using Euclidean distance based on p-value and direction of effect and complete linkage clustering (see URLs).
GWAS Catalog Lookups
To determine if significant coding variants were associated with any related cardiometabolic or anthropometric traits, we also searched the NHGRI-EBI GWAS Catalog for previous associations near our lead SNPs (+/− 500 kb). We used PLINK to calculate LD using ARIC European participants. All GWAS Catalog SNPs within the specified regions with an r2 > 0.7 were evaluated37. Consistent direction of effect was based on WHRadjBMI-increasing allele, LD, and allele frequency. We do not comment on direction of effect when a GWAS Catalog variant was not identical or in high LD (r2 > 0.9) with the WHR variant, and MAF >45%.
Body-fat percentage associations
We performed body fat percent and truncal fat percent look-ups of 48 of the 56 WHRadjBMI identified variants (Tables 1 and 2) available in UKBB. GWAS for body fat percent and truncal fat percent in UKBB excluded pregnant or possibly pregnant women, individuals with BMI < 15, or those without genetically confirmed European ancestry, resulting in a sample size of 120,286. Estimated body fat percent and truncal fat percent were obtained using the Tanita BC418MA body composition analyzer (Tanita, Tokyo, Japan). Participants were non-fasting and did not follow any specific instructions prior to bioimpedance measurements. SNPTEST was used to perform the analyses based on residuals adjusted for age, 15 principal components, assessment center and the genotyping chip120.
Collider bias
To evaluate SNPs for possible collider bias17, we used results from a recent GIANT BMI GWAS25. For each significant SNP from our additive models, WHRadjBMI associations were corrected for potential bias due to associations between each variant and BMI (Supplementary Note). Variants meeting Bonferroni-corrected significance (Pcorrected<9.09×10⁻⁴, 0.05/55 variants examined) were considered robust against collider bias.
Drosophila RNAi knockdown experiments
For each gene with WHRadjBMI-associated coding variants in the final combined meta-analysis (P < 2×10⁻⁷), its corresponding Drosophila orthologues were identified in the Ensembl ortholog database (see URLs), when available. Drosophila triglyceride content values were mined from a publicly available genome-wide fat screen data set45 to identify potential genes for follow-up knockdowns. Estimated values represent fractional changes in triglyceride content in adult male flies. Data are from male progeny of crosses between male UAS-RNAi flies from the Vienna Drosophila Resource Center (VDRC) and Hsp70-GAL4; Tub-GAL8ts virgin females. (Supplementary Note). The screen comprised one to three biological replicates. We followed up each gene with a >0.2 increase or >0.4 decrease in triglyceride content.
Orthologues for two genes were brought forward for follow-up, DNAH10 and PLXND1. For both genes, we generated adipose tissue (cg-Gal4) and neuronal (elav-Gal4) specific RNAi-knockdown crosses to knockdown transcripts in a tissue specific manner, leveraging upstream activation sequence (UAS)-inducible short-hairpin knockdown lines, available through the VDRC (Vienna Drosophila Resource Center). Specifically, elav-Gal4, which drives expression of the RNAi construct in post mitotic neurons starting at embryonic stages all the way to adulthood, was used. Cg drives expression in the fat body and hemocytes starting at embryonic stage 12, all the way to adulthood. (Supplementary Note). Resulting triglyceride values were normalized to fly weight and larval/population density. We used the non-parametric Kruskall-Wallis test to compare wild type with knockdown lines.
Expression quantitative trait loci (eQTLs) analysis
We queried the significant variant (Exome coding SNPs)-gene pairs associated with eGenes across five metabolically relevant tissues (skeletal muscle, subcutaneous adipose, visceral adipose, liver and pancreas) with at least 70 samples in the GTEx database46. For each tissue, variants were selected based on the following thresholds: the minor allele was observed in at least 10 samples, and MAF ≥ 1%. eGenes, genes with a significant eQTL, are defined on a false discovery rate (FDR)130 threshold of ≤0.05 of beta distribution-adjusted empirical p-value from FastQTL. Nominal p-values were generated for each variant-gene pair by testing the alternative hypothesis that the slope of a linear regression model between genotype and expression deviates from 0. To identify all significant variant-gene pairs associated with eGenes, a genome-wide empirical p-value threshold64 (pt) was defined as the empirical p-value of the gene closest to the 0.05 FDR threshold. pt was then used to calculate a nominal p-value threshold for each gene based on the beta distribution model (from FastQTL) of the minimum p-value distribution f(pmin) obtained from the permutations for the gene. For each gene, variants with a nominal p-value below the gene-level threshold were considered significant and included in the final list of variant-gene pairs64. For each eGene, we also listed the most significantly associated variants (eSNP). Only these exome SNPs with r2 > 0.8 with eSNPs were considered for biological interpretation (Supplementary eQTL GTEx).
We also performed cis-eQTL analysis in 770 METSIM subcutaneous adipose tissue samples as described in Civelek, et al.131 A false discovery rate (FDR) was calculated using all p-values from the cis-eQTL detection in the q-value package in R. Variants associated with nearby genes at an FDR less than 1% were considered to be significant (equivalent p-value < 2.46 × 10⁻⁴).
For loci with more than one microarray probeset of the same gene associated with the exome variant, we selected the probeset that provided the strongest LD r2 between the exome variant and the eSNP. In reciprocal conditional analysis, we conditioned on the lead exome variant by including it as a covariate in the cis-eQTL detection and reporting the p-value of the eSNP and vice versa. Signals were considered coincident if both the lead exome variant and the eSNP were no longer significant after conditioning on the other and the variants were in high LD (r2 > 0.80).
For loci that also harbored reported GWAS variants, we performed reciprocal conditional analysis between the GWAS lead variant and the lead eSNP. For loci with more than one reported GWAS variant, the GWAS variant with the strongest LD r2 with the lead eSNP was reported.
Penetrance analysis
Phenotype and genotype data from UKBB were used for penetrance analysis. Three of 16 rare and low frequency variants (MAF ≤ 1%) detected in the final Stage 1+2 meta-analysis were available in UKBB and had relatively larger effect sizes (>0.90). Phenotype data for these three variants were stratified by WHR using World Health Organization (WHO) guidelines, which consider women and men with WHR greater than 0.85 and 0.90 as obese, respectively. Genotype and allele counts were used to calculate the number of carriers of the minor allele. The number of obese vs. non-obese carriers for women, men and sexes combined was compared using a χ2 test. Significance was determined using a Bonferroni correction for the number of tests performed (0.05/9=5.5×10−3).
Supplementary Material
ACKNOWLEDGEMENTS
This work was primarily supported through funding from the National Institute of Health (NIH): 1K99HL130580, R01-DK089256, 2R01HD057194, U01HG007416, R01DK101855, T32 HL007055, KL2TR001109; and the American Heart Association (AHA): 13POST16500011 and 13GRNT16490017. Co-author Yucheng Jia recently passed away while this work was in process. This study was completed as part of the Genetic Investigation of ANtropometric Traits (GIANT) Consortium. This research has been conducted using the UK Biobank resource. A full list of acknowledgements is provided in the Supplementary Data 18.
Footnotes
COMPETING INTERESTS
The authors declare the following competing interests: ASB holds interest in AstraZeneca, Biogen, Bioverativ, Merck, Novartis and Pfizer. ASC and CSF are current employees of Merck. Authors affiliated with deCODE (VSt, GT, UT and KS) are employed by deCODE Genetics/Amgen, Inc. HDW has the following financial and non-financial competing interests to declare: Research Grants: Sanofi Aventis; Eli Lilly; NIH; Omthera Pharmaceuticals, Pfizer, Elsai Inc. AstraZeneca; DalCor and Services; Lecture fees: Sanofi Aventis; Advisory Boards: Acetelion, Sirtex, CSL Boehring. JD has received grants from AstraZeneca, Biogen, Merck, Novartis and Pfizer. LMYA and RAS are employee stock holders of GlaxoSmithKline. MPD received honoraria and holds minor equity in Dalcor. VS has participated in a conference trip sponsored by Novo Nordisk.
URLS
Ensembl ortholog database, http://www.ensembl.org; RAREMETALWORKER, http://genome.sph.umich.edu/wiki/RAREMETALWORKER; RVTESTs, http://zhanxw.github.io/rvtests/; EC-DEPICT, code available at: https://github.com/RebeccaFine/obesity-ec-depict; gplots, https://CRAN.R-project.org/package=gplots.
DATA AVAILABILITY
Summary statistics of all analyses are available at https://portals.broadinstitute.org/collaboration/giant/index.php/GIANT_consortium_data_files.
REFERENCES
- 1.Pischon T et al. General and abdominal adiposity and risk of death in Europe. N Engl J Med 359, 2105–20 (2008). [DOI] [PubMed] [Google Scholar]
- 2.Wang Y, Rimm EB, Stampfer MJ, Willett WC & Hu FB Comparison of abdominal adiposity and overall obesity in predicting risk of type 2 diabetes among men. Am J Clin Nutr 81, 555–63 (2005). [DOI] [PubMed] [Google Scholar]
- 3.Canoy D Distribution of body fat and risk of coronary heart disease in men and women. Curr Opin Cardiol 23, 591–8 (2008). [DOI] [PubMed] [Google Scholar]
- 4.Snijder MB et al. Associations of hip and thigh circumferences independent of waist circumference with the incidence of type 2 diabetes: the Hoorn Study. Am J Clin Nutr 77, 1192–7 (2003). [DOI] [PubMed] [Google Scholar]
- 5.Yusuf S et al. Obesity and the risk of myocardial infarction in 27,000 participants from 52 countries: a case-control study. Lancet 366, 1640–9 (2005). [DOI] [PubMed] [Google Scholar]
- 6.Mason C, Craig CL & Katzmarzyk PT Influence of central and extremity circumferences on all-cause mortality in men and women. Obesity (Silver Spring) 16, 2690–5 (2008). [DOI] [PubMed] [Google Scholar]
- 7.Karpe F & Pinnick KE Biology of upper-body and lower-body adipose tissue--link to whole-body phenotypes. Nat Rev Endocrinol 11, 90–100 (2015). [DOI] [PubMed] [Google Scholar]
- 8.Manolopoulos KN, Karpe F & Frayn KN Gluteofemoral body fat as a determinant of metabolic health. Int J Obes (Lond) 34, 949–59 (2010). [DOI] [PubMed] [Google Scholar]
- 9.Emdin CA et al. Genetic Association of Waist-to-Hip Ratio With Cardiometabolic Traits, Type 2 Diabetes, and Coronary Heart Disease. JAMA 317, 626–634 (2017). [DOI] [PMC free article] [PubMed] [Google Scholar]
- 10.Shungin D et al. New genetic loci link adipose and insulin biology to body fat distribution. Nature 518, 187–96 (2015). [DOI] [PMC free article] [PubMed] [Google Scholar]
- 11.Winkler TW et al. The Influence of Age and Sex on Genetic Associations with Adult Body Size and Shape: A Large-Scale Genome-Wide Interaction Study. PLoS Genet 11, e1005378 (2015). [DOI] [PMC free article] [PubMed] [Google Scholar]
- 12.Wen W et al. Genome-wide association studies in East Asians identify new loci for waist-hip ratio and waist circumference. Sci Rep 6, 17958 (2016). [DOI] [PMC free article] [PubMed] [Google Scholar]
- 13.Gao C et al. A Comprehensive Analysis of Common and Rare Variants to Identify Adiposity Loci in Hispanic Americans: The IRAS Family Study (IRASFS). PLoS One 10, e0134649 (2015). [DOI] [PMC free article] [PubMed] [Google Scholar]
- 14.Graff M et al. Genome-wide physical activity interactions in adiposity - A meta-analysis of 200,452 adults. PLoS Genet 13, e1006528 (2017). [DOI] [PMC free article] [PubMed] [Google Scholar]
- 15.Justice AE et al. Genome-wide meta-analysis of 241,258 adults accounting for smoking behaviour identifies novel loci for obesity traits. Nat Commun 8, 14977 (2017). [DOI] [PMC free article] [PubMed] [Google Scholar]
- 16.Ng MCY et al. Discovery and fine-mapping of adiposity loci using high density imputation of genome-wide association studies in individuals of African ancestry: African Ancestry Anthropometry Genetics Consortium. PLoS Genet 13, e1006719 (2017). [DOI] [PMC free article] [PubMed] [Google Scholar]
- 17.Aschard H, Vilhjalmsson BJ, Joshi AD, Price AL & Kraft P Adjusting for heritable covariates can bias effect estimates in genome-wide association studies. Am J Hum Genet 96, 329–39 (2015). [DOI] [PMC free article] [PubMed] [Google Scholar]
- 18.Day FR, Loh PR, Scott RA, Ong KK & Perry JR A Robust Example of Collider Bias in a Genetic Association Study. Am J Hum Genet 98, 392–3 (2016). [DOI] [PMC free article] [PubMed] [Google Scholar]
- 19.Feng S, Liu D, Zhan X, Wing MK & Abecasis GR RAREMETAL: fast and powerful meta-analysis for rare variants. Bioinformatics 30, 2828–9 (2014). [DOI] [PMC free article] [PubMed] [Google Scholar]
- 20.Pers TH et al. Biological interpretation of genome-wide association studies using predicted gene functions. Nat Commun 6, 5890 (2015). [DOI] [PMC free article] [PubMed] [Google Scholar]
- 21.Marouli E et al. Rare and low-frequency coding variants alter human adult height. Nature 542, 186–190 (2017). [DOI] [PMC free article] [PubMed] [Google Scholar]
- 22.Lamparter D, Marbach D, Rueedi R, Kutalik Z & Bergmann S Fast and Rigorous Computation of Gene and Pathway Scores from SNP-Based Summary Statistics. PLoS Comput Biol 12, e1004714 (2016). [DOI] [PMC free article] [PubMed] [Google Scholar]
- 23.Locke AE et al. Genetic studies of body mass index yield new insights for obesity biology. Nature 518, 197–206 (2015). [DOI] [PMC free article] [PubMed] [Google Scholar]
- 24.Kawai M, de Paula FJ & Rosen CJ New insights into osteoporosis: the bone-fat connection. J Intern Med 272, 317–29 (2012). [DOI] [PMC free article] [PubMed] [Google Scholar]
- 25.Turcot V et al. Protein-altering variants associated with body mass index implicate pathways that control energy intake and expenditure in obesity. Nat Genet 50, 26–41 (2018). [DOI] [PMC free article] [PubMed] [Google Scholar]
- 26.Liu DJ et al. Exome-wide association study of plasma lipids in >300,000 individuals. 49, 1758–1766 (2017). [DOI] [PMC free article] [PubMed] [Google Scholar]
- 27.Kraja AT et al. New Blood Pressure-Associated Loci Identified in Meta-Analyses of 475 000 Individuals. Circ Cardiovasc Genet 10(2017). [DOI] [PMC free article] [PubMed] [Google Scholar]
- 28.Mahajan A et al. Identification and functional characterization of G6PC2 coding variants influencing glycemic traits define an effector transcript at the G6PC2-ABCB11 locus. PLoS Genet 11, e1004876 (2015). [DOI] [PMC free article] [PubMed] [Google Scholar]
- 29.Manning A et al. A Low-Frequency Inactivating AKT2 Variant Enriched in the Finnish Population Is Associated With Fasting Insulin Levels and Type 2 Diabetes Risk. Diabetes 66, 2019–2032 (2017). [DOI] [PMC free article] [PubMed] [Google Scholar]
- 30.Zhao W et al. Identification of new susceptibility loci for type 2 diabetes and shared etiological pathways with coronary heart disease. 49, 1450–1457 (2017). [DOI] [PMC free article] [PubMed] [Google Scholar]
- 31.Morris AP et al. Large-scale association analysis provides insights into the genetic architecture and pathophysiology of type 2 diabetes. Nat Genet 44, 981–90 (2012). [DOI] [PMC free article] [PubMed] [Google Scholar]
- 32.Ng MC et al. Meta-analysis of genome-wide association studies in African Americans provides insights into the genetic architecture of type 2 diabetes. PLoS Genet 10, e1004517 (2014). [DOI] [PMC free article] [PubMed] [Google Scholar]
- 33.Mahajan A et al. Genome-wide trans-ancestry meta-analysis provides insight into the genetic architecture of type 2 diabetes susceptibility. Nat Genet 46, 234–44 (2014). [DOI] [PMC free article] [PubMed] [Google Scholar]
- 34.Saxena R et al. Genome-wide association study identifies a novel locus contributing to type 2 diabetes susceptibility in Sikhs of Punjabi origin from India. Diabetes 62, 1746–55 (2013). [DOI] [PMC free article] [PubMed] [Google Scholar]
- 35.Cook JP & Morris AP Multi-ethnic genome-wide association study identifies novel locus for type 2 diabetes susceptibility. Eur J Hum Genet 24, 1175–80 (2016). [DOI] [PMC free article] [PubMed] [Google Scholar]
- 36.Voight BF et al. Twelve type 2 diabetes susceptibility loci identified through large-scale association analysis. Nat Genet 42, 579–89 (2010). [DOI] [PMC free article] [PubMed] [Google Scholar]
- 37.Burdett T et al. The NHGRI-EBI Catalog of published genome-wide association studies. v1.0 edn Vol. 2015 (2015). [Google Scholar]
- 38.Hindorff LA et al. Potential etiologic and functional implications of genome-wide association loci for human diseases and traits. Proc Natl Acad Sci U S A 106, 9362–7 (2009). [DOI] [PMC free article] [PubMed] [Google Scholar]
- 39.Lutoslawska G et al. Relationship between the percentage of body fat and surrogate indices of fatness in male and female Polish active and sedentary students. J Physiol Anthropol 33, 10 (2014). [DOI] [PMC free article] [PubMed] [Google Scholar]
- 40.Verma M, Rajput M, Sahoo SS, Kaur N & Rohilla R Correlation between the percentage of body fat and surrogate indices of obesity among adult population in rural block of Haryana. J Family Med Prim Care 5, 154–9 (2016). [DOI] [PMC free article] [PubMed] [Google Scholar]
- 41.Pereira PF et al. [Measurements of location of body fat distribution: an assessment of colinearity with body mass, adiposity and stature in female adolescents]. Rev Paul Pediatr 33, 63–71 (2015). [DOI] [PMC free article] [PubMed] [Google Scholar]
- 42.Lu Y et al. New loci for body fat percentage reveal link between adiposity and cardiometabolic disease risk. Nat Commun 7, 10495 (2016). [DOI] [PMC free article] [PubMed] [Google Scholar]
- 43.Chambers JC et al. Common genetic variation near MC4R is associated with waist circumference and insulin resistance. Nat Genet 40, 716–8 (2008). [DOI] [PubMed] [Google Scholar]
- 44.Nead KT et al. Contribution of common non-synonymous variants in PCSK1 to body mass index variation and risk of obesity: a systematic review and meta-analysis with evidence from up to 331 175 individuals. Hum Mol Genet 24, 3582–94 (2015). [DOI] [PMC free article] [PubMed] [Google Scholar]
- 45.Pospisilik JA et al. Drosophila genome-wide obesity screen reveals hedgehog as a determinant of brown versus white adipose cell fate. Cell 140, 148–60 (2010). [DOI] [PubMed] [Google Scholar]
- 46.Consortium GT Human genomics. The Genotype-Tissue Expression (GTEx) pilot analysis: multitissue gene regulation in humans. Science 348, 648–60 (2015). [DOI] [PMC free article] [PubMed] [Google Scholar]
- 47.Baraille F, Planchais J, Dentin R, Guilmeau S & Postic C Integration of ChREBP-Mediated Glucose Sensing into Whole Body Metabolism. Physiology (Bethesda) 30, 428–37 (2015). [DOI] [PubMed] [Google Scholar]
- 48.Kursawe R et al. Decreased transcription of ChREBP-alpha/beta isoforms in abdominal subcutaneous adipose tissue of obese adolescents with prediabetes or early type 2 diabetes: associations with insulin resistance and hyperglycemia. Diabetes 62, 837–44 (2013). [DOI] [PMC free article] [PubMed] [Google Scholar]
- 49.Lotta LA et al. Integrative genomic analysis implicates limited peripheral adipose storage capacity in the pathogenesis of human insulin resistance. Nat Genet 49, 17–26 (2017). [DOI] [PMC free article] [PubMed] [Google Scholar]
- 50.Cargill M et al. A large-scale genetic association study confirms IL12B and leads to the identification of IL23R as psoriasis-risk genes. Am J Hum Genet 80, 273–90 (2007). [DOI] [PMC free article] [PubMed] [Google Scholar]
- 51.Hazlett J, Stamp LK, Merriman T, Highton J & Hessian PA IL-23R rs11209026 polymorphism modulates IL-17A expression in patients with rheumatoid arthritis. Genes Immun 13, 282–7 (2012). [DOI] [PubMed] [Google Scholar]
- 52.Karaderi T et al. Association between the interleukin 23 receptor and ankylosing spondylitis is confirmed by a new UK case-control study and meta-analysis of published series. Rheumatology (Oxford) 48, 386–9 (2009). [DOI] [PubMed] [Google Scholar]
- 53.Duerr RH et al. A genome-wide association study identifies IL23R as an inflammatory bowel disease gene. Science 314, 1461–3 (2006). [DOI] [PMC free article] [PubMed] [Google Scholar]
- 54.Abdollahi E, Tavasolian F, Momtazi-Borojeni AA, Samadi M & Rafatpanah H Protective role of R381Q (rs11209026) polymorphism in IL-23R gene in immune-mediated diseases: A comprehensive review. J Immunotoxicol 13, 286–300 (2016). [DOI] [PubMed] [Google Scholar]
- 55.Abraham C, Dulai PS, Vermeire S & Sandborn WJ Lessons Learned From Trials Targeting Cytokine Pathways in Patients With Inflammatory Bowel Diseases. Gastroenterology 152, 374–388 e4 (2017). [DOI] [PMC free article] [PubMed] [Google Scholar]
- 56.Molinelli E, Campanati A, Ganzetti G & Offidani A Biologic Therapy in Immune Mediated Inflammatory Disease: Basic Science and Clinical Concepts. Curr Drug Saf 11, 35–43 (2016). [DOI] [PubMed] [Google Scholar]
- 57.Fuchsberger C et al. The genetic architecture of type 2 diabetes. Nature 536, 41–7 (2016). [DOI] [PMC free article] [PubMed] [Google Scholar]
- 58.Wells JC Sexual dimorphism of body composition. Best Pract Res Clin Endocrinol Metab 21, 415–30 (2007). [DOI] [PubMed] [Google Scholar]
- 59.Loomba-Albrecht LA & Styne DM Effect of puberty on body composition. Curr Opin Endocrinol Diabetes Obes 16, 10–5 (2009). [DOI] [PubMed] [Google Scholar]
- 60.Rogol AD, Roemmich JN & Clark PA Growth at puberty. J Adolesc Health 31, 192–200 (2002). [DOI] [PubMed] [Google Scholar]
- 61.Gibson G Rare and common variants: twenty arguments. Nat Rev Genet 13, 135–45 (2012). [DOI] [PMC free article] [PubMed] [Google Scholar]
- 62.Stern JH, Rutkowski JM & Scherer PE Adiponectin, Leptin, and Fatty Acids in the Maintenance of Metabolic Homeostasis through Adipose Tissue Crosstalk. Cell Metab 23, 770–84 (2016). [DOI] [PMC free article] [PubMed] [Google Scholar]
- 63.Dewey FE et al. Inactivating Variants in ANGPTL4 and Risk of Coronary Artery Disease. N Engl J Med 374, 1123–33 (2016). [DOI] [PMC free article] [PubMed] [Google Scholar]
- 64.Bondestam J et al. cDNA cloning, expression studies and chromosome mapping of human type I serine/threonine kinase receptor ALK7 (ACVR1C). Cytogenet Cell Genet 95, 157–62 (2001). [DOI] [PubMed] [Google Scholar]
- 65.Jornvall H, Blokzijl A, ten Dijke P & Ibanez CF The orphan receptor serine/threonine kinase ALK7 signals arrest of proliferation and morphological differentiation in a neuronal cell line. J Biol Chem 276, 5140–6 (2001). [DOI] [PubMed] [Google Scholar]
- 66.Kim BC et al. Activin receptor-like kinase-7 induces apoptosis through activation of MAPKs in a Smad3-dependent mechanism in hepatoma cells. J Biol Chem 279, 28458–65 (2004). [DOI] [PubMed] [Google Scholar]
- 67.Watanabe R et al. The MH1 domains of smad2 and smad3 are involved in the regulation of the ALK7 signals. Biochem Biophys Res Commun 254, 707–12 (1999). [DOI] [PubMed] [Google Scholar]
- 68.Kogame M et al. ALK7 is a novel marker for adipocyte differentiation. J Med Invest 53, 238–45 (2006). [DOI] [PubMed] [Google Scholar]
- 69.Murakami M et al. Expression of activin receptor-like kinase 7 in adipose tissues. Biochem Genet 51, 202–10 (2013). [DOI] [PubMed] [Google Scholar]
- 70.Carlsson LM et al. ALK7 expression is specific for adipose tissue, reduced in obesity and correlates to factors implicated in metabolic disease. Biochem Biophys Res Commun 382, 309–14 (2009). [DOI] [PMC free article] [PubMed] [Google Scholar]
- 71.Carithers LJ & Moore HM The Genotype-Tissue Expression (GTEx) Project. Biopreserv Biobank 13, 307–8 (2015). [DOI] [PMC free article] [PubMed] [Google Scholar]
- 72.Yogosawa S, Mizutani S, Ogawa Y & Izumi T Activin receptor-like kinase 7 suppresses lipolysis to accumulate fat in obesity through downregulation of peroxisome proliferator-activated receptor gamma and C/EBPalpha. Diabetes 62, 115–23 (2013). [DOI] [PMC free article] [PubMed] [Google Scholar]
- 73.Yogosawa S & Izumi T Roles of activin receptor-like kinase 7 signaling and its target, peroxisome proliferator-activated receptor gamma, in lean and obese adipocytes. Adipocyte 2, 246–50 (2013). [DOI] [PMC free article] [PubMed] [Google Scholar]
- 74.Seifi M, Ghasemi A, Namipashaki A & Samadikuchaksaraei A Is C771G polymorphism of MLX interacting protein-like (MLXIPL) gene a novel genetic risk factor for non-alcoholic fatty liver disease? Cell Mol Biol (Noisy-le-grand) 60, 37–42 (2014). [PubMed] [Google Scholar]
- 75.Cairo S, Merla G, Urbinati F, Ballabio A & Reymond A WBSCR14, a gene mapping to the Williams--Beuren syndrome deleted region, is a new member of the Mlx transcription factor network. Hum Mol Genet 10, 617–27 (2001). [DOI] [PubMed] [Google Scholar]
- 76.Ambele MA, Dessels C, Durandt C & Pepper MS Genome-wide analysis of gene expression during adipogenesis in human adipose-derived stromal cells reveals novel patterns of gene expression during adipocyte differentiation. Stem Cell Res 16, 725–34 (2016). [DOI] [PubMed] [Google Scholar]
- 77.Marchler-Bauer A et al. CDD: NCBI’s conserved domain database. Nucleic Acids Res 43, D222–6 (2015). [DOI] [PMC free article] [PubMed] [Google Scholar]
- 78.Toyofuku T et al. Semaphorin-4A, an activator for T-cell-mediated immunity, suppresses angiogenesis via Plexin-D1. EMBO J 26, 1373–84 (2007). [DOI] [PMC free article] [PubMed] [Google Scholar]
- 79.Gitler AD, Lu MM & Epstein JA PlexinD1 and semaphorin signaling are required in endothelial cells for cardiovascular development. Dev Cell 7, 107–16 (2004). [DOI] [PubMed] [Google Scholar]
- 80.Luchino J et al. Semaphorin 3E suppresses tumor cell death triggered by the plexin D1 dependence receptor in metastatic breast cancers. Cancer Cell 24, 673–85 (2013). [DOI] [PubMed] [Google Scholar]
- 81.Shimizu I et al. Semaphorin3E-induced inflammation contributes to insulin resistance in dietary obesity. Cell Metab 18, 491–504 (2013). [DOI] [PubMed] [Google Scholar]
- 82.Verzijl HT, van der Zwaag B, Cruysberg JR & Padberg GW Mobius syndrome redefined: a syndrome of rhombencephalic maldevelopment. Neurology 61, 327–33 (2003). [DOI] [PubMed] [Google Scholar]
- 83.Verzijl HT, van der Zwaag B, Lammens M, ten Donkelaar HJ & Padberg GW The neuropathology of hereditary congenital facial palsy vs Mobius syndrome. Neurology 64, 649–53 (2005). [DOI] [PubMed] [Google Scholar]
- 84.Fujita M, Reinhart F & Neutra M Convergence of apical and basolateral endocytic pathways at apical late endosomes in absorptive cells of suckling rat ileum in vivo. J Cell Sci 97 ( Pt 2), 385–94 (1990). [DOI] [PubMed] [Google Scholar]
- 85.Briegel W Neuropsychiatric findings of Mobius sequence -- a review. Clin Genet 70, 91–7 (2006). [DOI] [PubMed] [Google Scholar]
- 86.Ta-Shma A et al. Isolated truncus arteriosus associated with a mutation in the plexin-D1 gene. Am J Med Genet A 161A, 3115–20 (2013). [DOI] [PubMed] [Google Scholar]
- 87.Mazzotta C et al. Plexin-D1/Semaphorin 3E pathway may contribute to dysregulation of vascular tone control and defective angiogenesis in systemic sclerosis. Arthritis Res Ther 17, 221 (2015). [DOI] [PMC free article] [PubMed] [Google Scholar]
- 88.Yang WJ et al. Semaphorin-3C signals through Neuropilin-1 and PlexinD1 receptors to inhibit pathological angiogenesis. EMBO Mol Med 7, 1267–84 (2015). [DOI] [PMC free article] [PubMed] [Google Scholar]
- 89.Zygmunt T et al. Semaphorin-PlexinD1 signaling limits angiogenic potential via the VEGF decoy receptor sFlt1. Dev Cell 21, 301–14 (2011). [DOI] [PMC free article] [PubMed] [Google Scholar]
- 90.Kim J, Oh WJ, Gaiano N, Yoshida Y & Gu C Semaphorin 3E-Plexin-D1 signaling regulates VEGF function in developmental angiogenesis via a feedback mechanism. Genes Dev 25, 1399–411 (2011). [DOI] [PMC free article] [PubMed] [Google Scholar]
- 91.Bertolino P et al. Activin B receptor ALK7 is a negative regulator of pancreatic beta-cell function. Proc Natl Acad Sci U S A 105, 7246–51 (2008). [DOI] [PMC free article] [PubMed] [Google Scholar]
- 92.Haworth KE et al. Methylation of the FGFR2 gene is associated with high birth weight centile in humans. Epigenomics 6, 477–91 (2014). [DOI] [PubMed] [Google Scholar]
- 93.Chi X et al. Angiopoietin-like 4 Modifies the Interactions between Lipoprotein Lipase and Its Endothelial Cell Transporter GPIHBP1. J Biol Chem 290, 11865–77 (2015). [DOI] [PMC free article] [PubMed] [Google Scholar]
- 94.Catoire M et al. Fatty acid-inducible ANGPTL4 governs lipid metabolic response to exercise. Proc Natl Acad Sci U S A 111, E1043–52 (2014). [DOI] [PMC free article] [PubMed] [Google Scholar]
- 95.van Raalte DH et al. Angiopoietin-like protein 4 is differentially regulated by glucocorticoids and insulin in vitro and in vivo in healthy humans. Exp Clin Endocrinol Diabetes 120, 598–603 (2012). [DOI] [PubMed] [Google Scholar]
- 96.Koster A et al. Transgenic angiopoietin-like (angptl)4 overexpression and targeted disruption of angptl4 and angptl3: regulation of triglyceride metabolism. Endocrinology 146, 4943–50 (2005). [DOI] [PubMed] [Google Scholar]
- 97.Thiagalingam A et al. RREB-1, a novel zinc finger protein, is involved in the differentiation response to Ras in human medullary thyroid carcinomas. Mol Cell Biol 16, 5335–45 (1996). [DOI] [PMC free article] [PubMed] [Google Scholar]
- 98.Bonomo JA et al. The ras responsive transcription factor RREB1 is a novel candidate gene for type 2 diabetes associated end-stage kidney disease. Hum Mol Genet 23, 6441–7 (2014). [DOI] [PMC free article] [PubMed] [Google Scholar]
- 99.Thiagalingam A, Lengauer C, Baylin SB & Nelkin BD RREB1, a ras responsive element binding protein, maps to human chromosome 6p25. Genomics 45, 630–2 (1997). [DOI] [PubMed] [Google Scholar]
- 100.Bisogno T et al. Cloning of the first sn1-DAG lipases points to the spatial and temporal regulation of endocannabinoid signaling in the brain. J Cell Biol 163, 463–8 (2003). [DOI] [PMC free article] [PubMed] [Google Scholar]
- 101.Global Lipids Genetics, C. et al. Discovery and refinement of loci associated with lipid levels. Nat Genet 45, 1274–83 (2013). [DOI] [PMC free article] [PubMed] [Google Scholar]
- 102.Kooner JS et al. Genome-wide scan identifies variation in MLXIPL associated with plasma triglycerides. Nat Genet 40, 149–51 (2008). [DOI] [PubMed] [Google Scholar]
- 103.Pan LA et al. G771C Polymorphism in the MLXIPL Gene Is Associated with a Risk of Coronary Artery Disease in the Chinese: A Case-Control Study. Cardiology 114, 174–8 (2009). [DOI] [PubMed] [Google Scholar]
- 104.Kang G, Leech CA, Chepurny OG, Coetzee WA & Holz GG Role of the cAMP sensor Epac as a determinant of KATP channel ATP sensitivity in human pancreatic beta-cells and rat INS-1 cells. J Physiol 586, 1307–19 (2008). [DOI] [PMC free article] [PubMed] [Google Scholar]
- 105.Ji Z, Mei FC & Cheng X Epac, not PKA catalytic subunit, is required for 3T3-L1 preadipocyte differentiation. Front Biosci (Elite Ed) 2, 392–8 (2010). [DOI] [PMC free article] [PubMed] [Google Scholar]
- 106.Martini CN, Plaza MV & Vila Mdel C PKA-dependent and independent cAMP signaling in 3T3-L1 fibroblasts differentiation. Mol Cell Endocrinol 298, 42–7 (2009). [DOI] [PubMed] [Google Scholar]
- 107.Petersen RK et al. Cyclic AMP (cAMP)-mediated stimulation of adipocyte differentiation requires the synergistic action of Epac- and cAMP-dependent protein kinase-dependent processes. Mol Cell Biol 28, 3804–16 (2008). [DOI] [PMC free article] [PubMed] [Google Scholar]
- 108.Yan J et al. Enhanced leptin sensitivity, reduced adiposity, and improved glucose homeostasis in mice lacking exchange protein directly activated by cyclic AMP isoform 1. Mol Cell Biol 33, 918–26 (2013). [DOI] [PMC free article] [PubMed] [Google Scholar]
- 109.Gesta S et al. Evidence for a role of developmental genes in the origin of obesity and body fat distribution. Proc Natl Acad Sci U S A 103, 6676–81 (2006). [DOI] [PMC free article] [PubMed] [Google Scholar]
- 110.Gesta S et al. Mesodermal developmental gene Tbx15 impairs adipocyte differentiation and mitochondrial respiration. Proc Natl Acad Sci U S A 108, 2771–6 (2011). [DOI] [PMC free article] [PubMed] [Google Scholar]
- 111.Lee KY et al. Tbx15 controls skeletal muscle fibre-type determination and muscle metabolism. Nat Commun 6, 8054 (2015). [DOI] [PMC free article] [PubMed] [Google Scholar]
REFERENCES – ONLINE METHODS ONLY
- 112.Sudlow C et al. UK biobank: an open access resource for identifying the causes of a wide range of complex diseases of middle and old age. PLoS Med 12, e1001779 (2015). [DOI] [PMC free article] [PubMed] [Google Scholar]
- 113.Liu DJ et al. Meta-analysis of gene-level tests for rare variant association. Nat Genet 46, 200–4 (2014). [DOI] [PMC free article] [PubMed] [Google Scholar]
- 114.Goldstein JI et al. zCall: a rare variant caller for array-based genotyping: genetics and population analysis. Bioinformatics 28, 2543–5 (2012). [DOI] [PMC free article] [PubMed] [Google Scholar]
- 115.Winkler TW et al. Quality control and conduct of genome-wide association meta-analyses. Nat Protoc 9, 1192–212 (2014). [DOI] [PMC free article] [PubMed] [Google Scholar]
- 116.Winkler TW et al. EasyStrata: evaluation and visualization of stratified genome-wide association meta-analysis data. Bioinformatics 31, 259–61 (2015). [DOI] [PMC free article] [PubMed] [Google Scholar]
- 117.Purcell SM et al. A polygenic burden of rare disruptive mutations in schizophrenia. Nature 506, 185–90 (2014). [DOI] [PMC free article] [PubMed] [Google Scholar]
- 118.Yang J et al. Genomic inflation factors under polygenic inheritance. Eur J Hum Genet 19, 807–12 (2011). [DOI] [PMC free article] [PubMed] [Google Scholar]
- 119.Yang J et al. Conditional and joint multiple-SNP analysis of GWAS summary statistics identifies additional variants influencing complex traits. Nat Genet 44, 369–75, S1–3 (2012). [DOI] [PMC free article] [PubMed] [Google Scholar]
- 120.Marchini J, Howie B, Myers S, McVean G & Donnelly P A new multipoint method for genome-wide association studies by imputation of genotypes. Nat Genet 39, 906–13 (2007). [DOI] [PubMed] [Google Scholar]
- 121.Wellcome Trust Case Control, C. Genome-wide association study of 14,000 cases of seven common diseases and 3,000 shared controls. Nature 447, 661–78 (2007). [DOI] [PMC free article] [PubMed] [Google Scholar]
- 122.Marchini J & Howie B Genotype imputation for genome-wide association studies. Nat Rev Genet 11, 499–511 (2010). [DOI] [PubMed] [Google Scholar]
- 123.Frey BJ & Dueck D Clustering by passing messages between data points. Science 315, 972–6 (2007). [DOI] [PubMed] [Google Scholar]
- 124.Moayyeri A, Hammond CJ, Valdes AM & Spector TD Cohort Profile: TwinsUK and healthy ageing twin study. Int J Epidemiol 42, 76–85 (2013). [DOI] [PMC free article] [PubMed] [Google Scholar]
- 125.Boyd A et al. Cohort Profile: the ‘children of the 90s’--the index offspring of the Avon Longitudinal Study of Parents and Children. Int J Epidemiol 42, 111–27 (2013). [DOI] [PMC free article] [PubMed] [Google Scholar]
- 126.Kutalik Z, Whittaker J, Waterworth D, Beckmann JS & Bergmann S Novel method to estimate the phenotypic variation explained by genome-wide association studies reveals large fraction of the missing heritability. Genet Epidemiol 35, 341–9 (2011). [DOI] [PubMed] [Google Scholar]
- 127.Billingsley P Probability and measure, xii, 622 p. (Wiley, New York, 1986). [Google Scholar]
- 128.Surendran P et al. Trans-ancestry meta-analyses identify rare and common variants associated with blood pressure and hypertension. Nat Genet 48, 1151–61 (2016). [DOI] [PMC free article] [PubMed] [Google Scholar]
- 129.Nikpay M et al. A comprehensive 1,000 Genomes-based genome-wide association meta-analysis of coronary artery disease. Nat Genet 47, 1121–30 (2015). [DOI] [PMC free article] [PubMed] [Google Scholar]
- 130.Storey JD & Tibshirani R Statistical significance for genomewide studies. Proc Natl Acad Sci U S A 100, 9440–5 (2003). [DOI] [PMC free article] [PubMed] [Google Scholar]
- 131.Civelek M et al. Genetic Regulation of Adipose Gene Expression and Cardio-Metabolic Traits. Am J Hum Genet 100, 428–443 (2017). [DOI] [PMC free article] [PubMed] [Google Scholar]
Associated Data
This section collects any data citations, data availability statements, or supplementary materials included in this article.