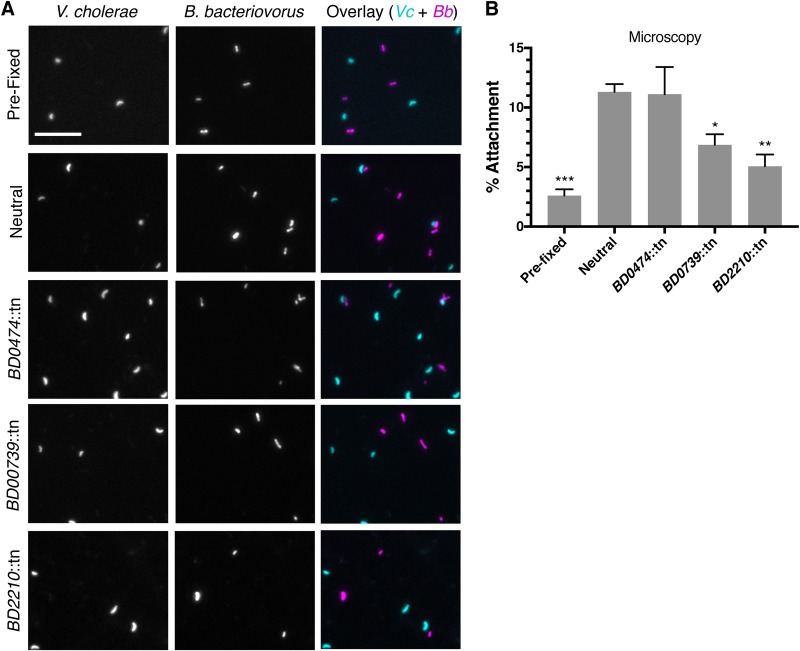
FIG 3.
Microscopy validation of Tn-FACSeq results. (A) Fluorescent microscopy images of V. cholerae (cyan) and B. bacteriovorus (magenta) following infection. Scale bar = 10 μm. (B) Quantification of the results in panel A. A minimum of 1,100 B. bacteriovorus cells were scored under each condition, double blind, for attachment to V. cholerae. The average B. bacteriovorus attachment percentage and standard errors of the mean (SEM) for three biological replicates are shown. Significance was determined by comparing each strain’s attachment percentage to that of the neutral control. *, P < 0.0469; **, P < 0.0061; ***, P < 0.0002 (ANOVA and Dunnett’s multiple-comparison test).

