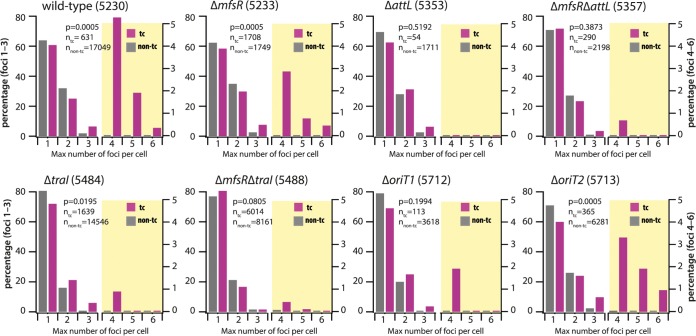
FIG 3.
Distributions of LacI-CFP foci in transfer-competent (tc) and regular cells (non-tc) of P. putida carrying ICEclc (wild type) or ICEclc with different relevant mutations. Focus distributions are represented as the percentage of cells among the total of that category (n, as indicated in each diagram) with the indicated maximum observed number of foci during their entire lifetime. Different scales were used to show the percentages for focus numbers 1 to 3 (left scale axis) and for focus numbers 4 to 6 (right axis; diagram partly shaded in yellow). P values are the simulated P values across 2,000 repetitions of the comparisons of percent-normalized non-tc versus tc focus distributions in Fisher’s exact test. Data from strains 5230, 5233, 5357, and 5488 are in 5, 2, 2, and 2 biological replicates, respectively, with between 4 and 10 technical replicates. The other data are from single biological replicates with between 4 and 10 technical replicates.

