Abstract
The cytokine interferon-γ (IFNγ) is a central coordinator of innate and adaptive immunity, but its highly pleiotropic actions have diminished its prospects for use as an immunotherapeutic agent. Here, we took a structure-based approach to decoupling IFNγ pleiotropy. We engineered an affinity-enhanced variant of the ligand-binding chain of the IFNγ receptor IFNγR1, which enabled us to determine the crystal structure of the complete hexameric (2:2:2) IFNγ–IFNγR1–IFNγR2 signalling complex at 3.25 Å resolution. The structure reveals the mechanism underlying deficits in IFNγ responsiveness in mycobacterial disease syndrome resulting from a T168N mutation in IFNγR2, which impairs assembly of the full signalling complex. The topology of the hexameric complex offers a blueprint for engineering IFNγ variants to tune IFNγ receptor signalling output. Unexpectedly, we found that several partial IFNγ agonists exhibited biased gene-expression profiles. These biased agonists retained the ability to induce upregulation of major histocompatibility complex class I antigen expression, but exhibited impaired induction of programmed death-ligand 1 expression in a wide range of human cancer cell lines, offering a route to decoupling immunostimulatory and immunosuppressive functions of IFNγ for therapeutic applications.
The type II interferon IFNγ is a potent immunomodulatory cytokine with many pleiotropic effects on the innate and adaptive immune systems due to the broad expression of its receptors on immune cells1. IFNγ exhibits an array of immunostimulatory, immunosuppressive, anti-proliferative and antiviral activities that are vital to normal immune homeostasis, and has a key role in tumour surveillance2. Among the most important actions of IFNγ are activating macrophages and dendritic cells, and inducing upregulation of major histocompatibility complex (MHC) molecules to enhance presentation of bacterial, viral and tumour antigens3. However, despite its central role in many important functions related to disease, IFNγ has not achieved therapeutic utility owing to its pleiotropy and counterbalancing immunostimulatory and immunomodulatory activities4.
IFNγ is a homodimer5; it engages two α-receptor chains, IFNγR1, which are constitutively expressed on all nucleated cells, and two β-receptor chains, IFNγR2, the expression of which is tightly regulated6–8. A structure of IFNγ in complex with IFNγR19 revealed the mode of binding of the high-affinity receptor subunit. However, the structure of the complete extracellular hexameric (2:2:2 IFNγ–IFNγR1–IFNγR2) signalling complex has not been solved, principally because of the extremely low affinity of the IFNγR2 subunit within the complex. Determination of the structure of the complete signalling complex is important for understanding IFNγ signalling and the mechanism of receptor-complex assembly, and for providing a blueprint for cytokine engineering to access the full therapeutic potential of IFNγ in cancer and immune diseases. Here, we have taken a receptor engineering approach to stabilize the complete IFNγ receptor complex, which has enabled structure determination and subsequent design of biased agonists.
Stabilization of the IFNγ receptor complex
When considering the assembly of the complete complex, it was important to know whether IFNγ drives the association of the receptors to form the signalling complex, or whether IFNγR1 and IFNγR2 are pre-dimerized, as some studies have suggested10,11. We used two-colour single-molecule co-tracking to quantify binding of IFNγR1 and IFNγR2 in the plasma membrane12–14. By monitoring dimerization of individual receptors on a cell, we found that IFNγR1 and IFNγR2 co-track only on addition of IFNγ (Fig. 1a, b). Similarly when monitoring either IFNγR1 or IFNγR2 binding steps, receptor dimerization was demonstrated to be a ligand-driven event (Extended Data Fig. 1a–c).
Fig. 1. Assembly and engineered stabilization of the IFNγ receptor complex.
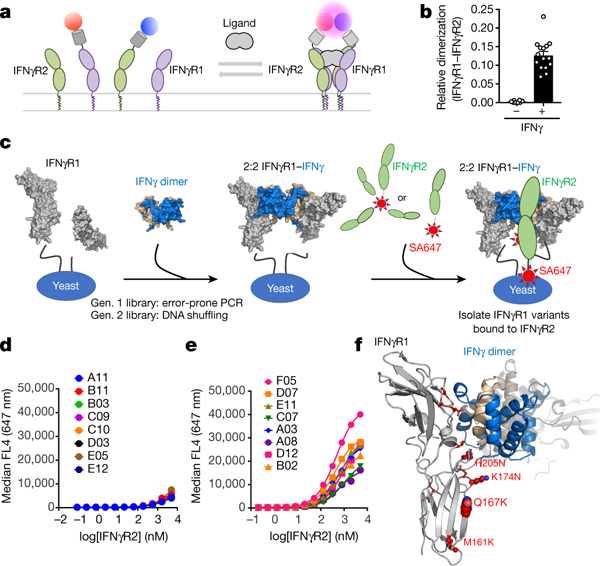
a, Cell-surface labelling of IFNγR1 (purple) and IFNγR2 (green) using Rho-11 (red circle) and DY647-labelled (blue circle) anti-GFP nanobodies is used to determine receptor dimerization. b, Relative co-tracking of Rho-11–IFNγR1 and DY647–IFNγR2 in the absence and presence of ligand. Data are mean ± s.e.m.; n = 8 (−IFNγ), n = 15 (+IFNγ); n is the number of biologically independent samples. c, Experimental design for engineering higher-affinity IFNγR1 variants. IFNγR1 (grey) is displayed on yeast and, in the presence of unlabelled IFNγ dimer (blue and tan), forms the intermediate 2:2 IFNγ–IFNγR1 complex (middle), enabling detection of variants binding to either tetrameric or monomeric IFNγR2 (green; labelled with streptavidin–Alexa Fluor 647 (SA647)). d, Using this platform, a first-generation library was generated using non-biased error-prone PCR followed by DNA shuffling. e, After a single round of selection, eight clones were titrated to estimate their relative binding to IFNγR2. f, Sites of mutations on IFNγR1 F05 (see Extended Data Fig. 1e).
We expressed IFNγR1 on the surface of yeast cells and showed that IFNγR2 only binds to the preformed IFNγR1–IFNγ complex, but not IFNγ alone. This implied that a composite binding surface is formed between IFNγR1 and IFNγ, which subsequently engages IFNγR2 (Extended Data Fig. 1d). We sought to use this readout of cooperativity to engineer and select for a stabilized interaction with IFNγR2 (Fig. 1c). First, we generated an IFNγR1 library using a non-biased error-prone approach with approximately three mutations created in each gene copy, to select for IFNγR1 variants with improved affinity. Second, we used gene shuffling of the first-generation IFNγR1 variants to further select for higher affinity (Fig. 1d and Extended Data Fig. 1e). After a single round of selection, the highest-affinity IFNγR1 variant was IFNγR1 F05, which contains six mutations (Fig. 1e and Extended Data Fig. 1e). The two most common mutations among the selected clones were located in the D2 FNIII domain of IFNγR1 in an area commonly observed forming receptor–receptor, or ‘stem’ contacts in other dimeric cytokine–receptor complexes15 (Fig. 1f).
Structure of the IFNγ receptor complex
We obtained crystals of the deglycosylated and fully glycosylated IFNγ receptor complexes (Extended Data Fig. 2a), which diffracted to 3.25 Å and 3.8 Å resolution, respectively, and determined the structures by molecular replacement using previously determined structures of the 2:2 IFNγ–IFNγR1 intermediate complex (Protein Data Bank (PDB): 1FG9)16 and IFNγR2 (PDB: 5EH1)17 (Extended Data Table 1). The complete 2:2:2 IFNγ receptor complex is star-shaped with a two-fold symmetry imposed by the IFNγ homodimer (Fig. 2a). The structure reveals six total interaction sites: two site 1 interfaces shared between IFNγ and IFNγR1, two site 2 interfaces shared between IFNγ and IFNγR2, and two site 3 interfaces shared between IFNγR1 and IFNγR2. IFNγR2 binds to the composite interface formed by the high affinity IFNγ– IFNγR1 interaction, which enables IFNγR2 to contact the open face of IFNγ site 2, as well as make extensive stem contacts with IFNγR1 site 3 (Fig. 2a). Each of the two site 2 interfaces of IFNγ presents a concave surface that buries a total area of 1,243 Å2 formed by helices A, D and E, and the N terminus of the cytokine (Fig. 2a, 3a, b). In contrast to the site 1 interfaces, in which both chains of IFNγ form the IFNγR1 binding interfaces, only one IFNγ chain is needed to form each IFNγR2 binding site in the site 2 interface. IFNγR2 binds to IFNγ principally through a cluster of aromatic residues in loop 3 (F67, Y69 and F75) and through F109 in loop 4 of IFNγR2, which insert into a small pocket formed by helices A and D of IFNγ (Fig. 3b, left, and Extended Data Fig. 2b). The site 3 stem interfaces (1,469 Å2 of total buried surface area) consist of primarily flat surfaces between IFNγR1 and IFNγR2 that interact through extensive van der Waals interactions (Figs. 2a, 3a, b). IFNγR1 F05 contains two mutations, M161K and Q167K, located at the site 3 interfaces (Fig. 3b, right). IFNγR1(M161K) shares a hydrogen bond with T149 of IFNγR2, and IFNγR1(Q167K) forms a salt bridge with D164 of IFNγR2; both interactions are likely to contribute to the stabilization of the site 3 interfaces (Fig. 3b, right, and Extended Data Fig. 2b).
Fig. 2. Structure of the IFNγ hexameric complex.
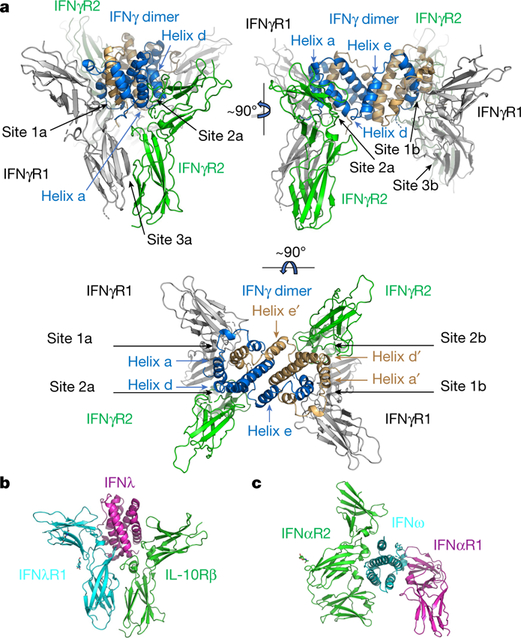
a, The structure of the IFNγ hexameric complex reveals the mechanism of IFNγR2 (green) recognition of IFNγ (blue and tan) and IFNγR1 (grey). IFNγR2 receptors make extensive contacts with the IFNγ dimer at sites 2a and 2b, and site 3a and 3b makes stem–stem contacts with IFNγR1. b, Structure of the IFNλ–IFNλR1–IL-10Rβ signalling complex (PDB: 5T5W)15 shares a similar geometry with the IFNγ signalling complex. The binding mode of IFNγR2 is nearly identical to that of IL-10Rβ. c, Structure of a type I IFN receptor complex (PDB: 3SE4)21 with distinct ligand–receptor geometries compared to either type II or III IFNs.
Fig. 3. Interactions within the IFNγ receptor complex and mechanism of disease mutation.
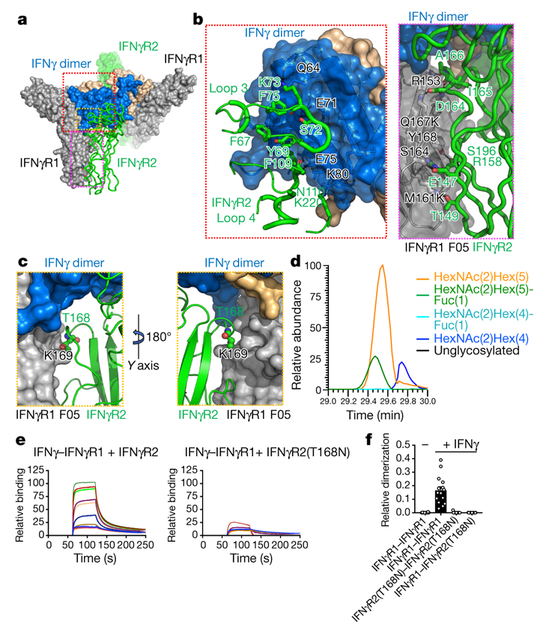
a, Overview of the IFNγ–IFNγR1 F05–IFNγR2 ternary complex. IFNγ, blue and tan; IFNγR1 F05, grey; IFNγR2, green. b, View of the site 2a (identical to site 2b) contacts between IFNγ and IFNγR2 (left). Detailed view of site 3a (identical to site 3b) between IFNγR1 F05 (grey) and IFNγR2 (green) (right). c, The complex structure places the neoglycosylation site of IFNγR2(T168N) at the site 3a (identical to site 3b) interface. d, IFNγR2(T168N) was expressed in HEK293S GnTI− cells and analysed by nano-liquid chromatography followed by tandem mass spectrometry (LC–MS/MS). The peptide containing N168 was identified (see Extended Data Fig. 3), and relative amounts of various glycoforms were determined by extracted ion chromatograms (EICs). The data shown are for a single experiment. e, The affinity (KD) of IFNγR2 to the 2:2 IFNγ–IFNγR1 intermediate complex was determined to be ~5 μM by SPR (left), whereas the mutant IFNγR2(T168N) results in a loss of binding (right). The titration data are from a single experiment. f, Single-molecule dimerization experiments in cells co-expressing IFNγR1 and IFNγR2(T168N). IFNγ retains binding to IFNγR1 but fails to recruit IFNγR2(T168N). Data are mean ± s.e.m.; n = 14, 15, 13, and 17 (left to right); n is the number of independent experiments.
Although the IFNγ signalling complex is ‘doubled’ into a 2:2:2 hexamer (compared to typical 1:1:1 trimeric cytokine-receptor complexes15) because of the homodimeric nature of the ligand, each 1:1:1 half of the hexamer shares structural similarities with the type III IFN trimeric (1:1:1) IFNλ receptor complex (PDB: 5T5W) (Fig. 2b), including the relative binding modes of the high (IFNλR1) and low (IL-10Rβ) affinity receptors binding to one end of the helical bundle of the respective cytokines15 (Fig. 2b). By contrast, the IFNγ complex uses a structural paradigm that is distinct from the trimeric (1:1:1) type I IFN complex in both the relative geometries of the ligand–receptor complexes and the mode of binding to each receptor (Fig. 2c).
Role of the neoglycan in IFNγR2(T168N) to MSMD
Lack of IFNγ responsiveness in mycobacterial disease syndrome (MSMD) has been attributed to a homozygous T168N mutation in IFNγR218, which results in a life-threatening predisposition to mycobacterial infections10. The structure of the complete complex provides further insight into the molecular basis of this disease-associated mutation in IFNγR2. The structure places T168N (IFNγR2) directly at the site 3 interface (Fig. 3c). The additional steric bulk that would result from the addition of an N-linked glycan at this site would introduce steric clashes, and is thereby likely to prevent IFNγR2 from docking to the high affinity 2:2 IFNγ–IFNγR1 intermediate complex. We used two approaches to test the hypothesis that glycosylation at the T168N position of IFNγR2 prevents docking with the 2:2 IFNγ–IFNγR1 intermediate complex. We produced a recombinant form of the neoglycan mutant IFNγR2(T168N) extracellular domain and verified that it was glycosylated at the T168N position with almost quantitative occupancy (Fig. 3d and Extended Data Fig. 3). Using surface plasmon resonance (SPR), we measured the affinity of either wild-type IFNγR2 (Fig. 3e, left) or the neoglycan mutant IFNγR2(T168N) (Fig. 3e, right) for IFNγ–IFNγR1. We detected a loss of binding between IFNγR2(T168N) for IFNγ–IFNγR1. In a second approach, we used single-molecule dimerization assays to quantify binding of the IFNγ receptors in the plasma membrane on addition of the ligand (Fig. 3f). Binding of IFNγR1 is maintained, whereas IFNγR2(T168N) is not recruited to the complex following addition of IFNγ (Fig. 3f). Thus, we propose that the molecular basis for the effect of the T168N mutation in mycobacterial disease syndrome is principally that the neoglycan sterically prevents IFNγR2(T168N) from engaging the IFNγ–IFNγR1 complex to complete the signalling complex.
Structure-guided design of partial agonists
The structure of the IFNγ signalling complex provides a topological blueprint for probing the signalling properties of intermediates in the assembly pathway to the hexameric complex (Fig. 4a). We designed partial agonists by first engineering a version of IFNγ that retains binding to IFNγR1 but abrogates binding to IFNγR2 (Extended Data Fig. 4a, b). On the basis of our structure, we rationally designed the IFNγ(K74A/E75Y/N83R) triple mutant and confirmed loss of measurable binding to IFNγR2 by SPR (Extended Data Fig. 4a, b). Using our knowledge of the site 2-specific mutations, we engineered ‘asymmetric’ single-chain mutants to selectively control receptor occupancy at either one or both IFNγR2 binding sites of IFNγ by expressing the molecules as single-chain fusions, in which, for example, only one chain of IFNγ contained a mutated binding site, and the other was wild-type IFNγ (Extended Data Fig. 5). Using this linker strategy, together with different combinations of site 119,20 and site 2 mutations, we created a panel of partial agonists that control both the number and location of the receptors in the complex (Extended Data Fig. 5b), and characterized receptor-binding stoichiometry and oligomerization of the asymmetric variants by size-exclusion chromatography (SEC) (Extended Data Fig. 5c–e), and measured receptor dimerization and phosphorylated STAT1 (pSTAT1) signalling (Fig. 4b, c and Extended Data Fig. 4c, d).
Fig. 4. Structure-based design of IFNγ partial agonists with biased signalling outputs.
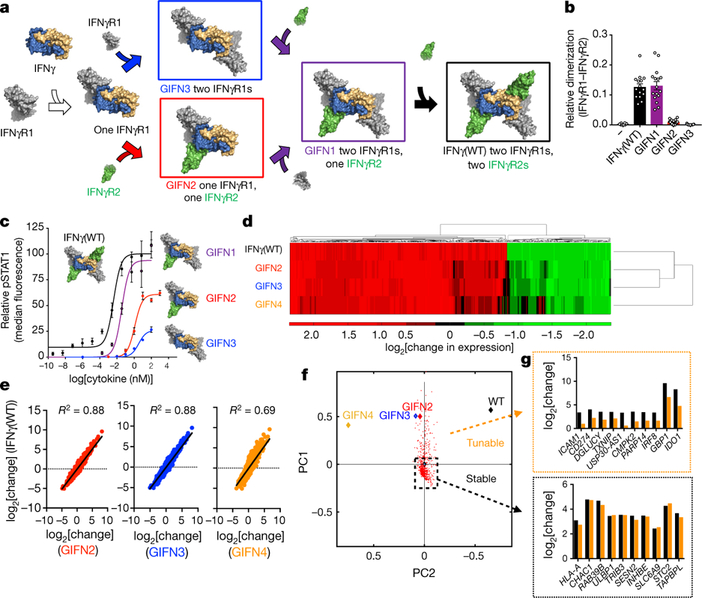
a, Assembly of the hexameric IFNγ signalling complex can proceed through multiple intermediates. b, Co-tracking of IFNγR1 and IFNγR2 for wild-type and variants of IFNγ. Data are mean ± s.e.m.; n = 8, 15, 16, 16, and 15 independent experiments (left to right). c, IFNγ mutants that stabilized intermediate complexes were assayed for STAT1 activation in Hap1 cells. GIFN2, one IFNγR1 and one IFNγR2 binding in cis; GIFN3, two IFNγR1 bound; GIFN4, reduced affinity for both IFNγR1s and IFNγR2s (see Extended Data Fig. 5). Curves were fitted to a first-order logistic model. Data are mean ± s.e.m.; n = 3 biologically independent experiments. d, Heat map depicting the relative expression (log2[change in expression]) of 1,000 genes from the human transcriptome. e, Correlations in relative expression of wild-type IFNγ and GIFNs for all genes. n = 2 independent biological experiments. f, Principal component analysis (PCA) of the top 600 genes induced by IFNγ, were compared to GIFN2–4. n = 2 biologically independent experiments. g, Genes, including CD274 (which encodes PD-L1), that have significantly lowered expression with GIFN4 relative to wild-type IFNγ (top). Genes, including HLA-A, that are robustly expressed with both wild-type IFNγ and GIFN4 (bottom panel).
We observed that there was a relationship between the number and location of receptors bound and the maximal pSTAT1 signal, Emax. The 2:2 IFNγ–IFNγR1 complex (using IFNγ variant 3, termed GIFN3) exhibits a 25% pSTAT1 Emax, whereas addition of only 1 copy of IFNγR2, to create a 2:2:1 IFNγ–IFNγR1–IFNγR2 intermediate complex (using IFNγ variant 1, termed GIFN1), results in 100% pSTAT1 Emax compared to the complete hexameric complex (Fig. 4a, c). The second copy of IFNγR2 therefore appears to be functionally redundant; this also demonstrates the extreme sensitivity of IFNγ responsive cells to expression levels of IFNγR2. Of note, the 2:1:1 complex (using IFNγ variant 2, termed GIFN2) of IFNγ–IFNγR1– IFNγR2 exhibits a 50% Emax for pSTAT1, and appears to be ‘capped’ until a third receptor subunit binds (using IFNγ variant GIFN1) (Fig. 4a, c).
Biased agonists decouple IFNγ gene expression
We carried out gene expression studies of wild-type IFNγ and GIFN variants. We treated A549 cells, a lung carcinoma cell line, with either wild-type IFNγ or GIFN variants, and measured gene expression by next-generation sequencing using an AmpliSeq panel of more than 20,000 genes. Overall, we observe a general trend of the partial agonists inducing lower levels of gene expression in accordance with their pSTAT1 Emax potencies (Fig. 4d, e). However, we find that a subset of genes exhibit discordant, biased expression patterns (Fig. 4f, g). For example, CD274, more commonly known as programmed death ligand 1 (PD-L1), is one of a subset of tunable genes, the expression of which is greatly reduced in response to the partial agonists (Fig. 4g, top), whereas MHC class I remains highly expressed (Fig. 4g, bottom panel).
We measured induction of surface expression of MHC class I and PD-L1, and cytokine secretion in response to wild-type IFNγ or GIFN variants (Fig. 5a, b and Extended Data Fig. 4e, i). The partial agonists retained nearly wild-type levels of activity in inducing upregulation of MHC class I in A549 cells and purified human dendritic cells, but induction of PD-L1 expression by the partial agonists was greatly reduced (Fig. 5a, b and Extended Data Fig. 4f). The GIFNs exhibited bias, with up to approximately 50-fold difference between induction of MHC I and PD-L1 in A549 cells, and similarly for dendritic cells, monocytes, and macrophages (Extended Data Fig. 4g, h). We screened an additional six cancer cell lines, including Hap1, MeWo, HT-29, Hep G2, HeLa and Panc-1 cell lines, finding that the partial agonists consistently decouple MHC I:PD-L1 expression to different degrees depending on the cell line (Fig. 5c, d).
Fig. 5. Decoupled expression of MHC I versus PD-L1 in response to IFNγ or partial agonists.
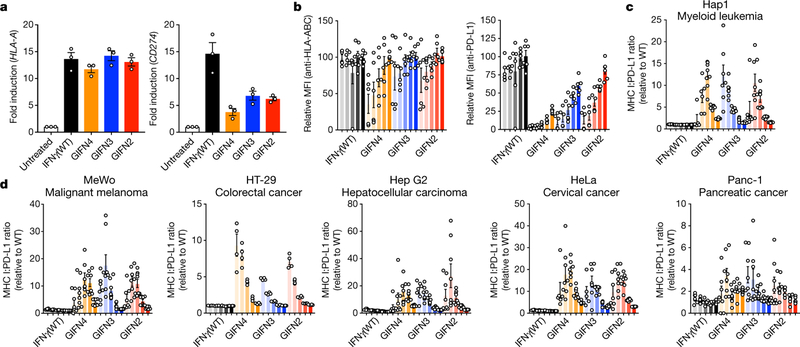
a, b, A549 cells were treated with either IFNγ (wild-type) or partial agonists for 48 h. Upregulation of MHC class I antigen and PD-L1 expression were quantified by reverse transcription with quantitative PCR (RT–qPCR) (a; ligand concentration, 62.5 nM; mean ± s.e.m., n = 3 biologically independent experiments), by using fluorescently labelled HLA-ABC antibody (b, left; ligand concentrations 0.1, 0.5, 2.5, 12.5 and 62.5 nM (left to right, respectively, for each agonist); mean ± s.e.m.; n = 6 independent samples), and using fluorescently labelled PD-L1 antibody (b, right). MFI, median fluorescence intensity. c, d, Six additional cancer cell lines (Hap1, MeWo, HT-29, Hep G2, HeLa, and Panc-1) were screened for MHC I:PD-L1 bias as in b, but after 24 h treatment (ligand concentrations 0.1, 0.5, 2.5, 12.5 and 62.5 nM (left to right, respectively, for each agonist); mean ± s.e.m.; n = 8 independent samples).
The uncoupling of MHC I and PD-L1 expression shows that the partial agonists are also biased agonists that have uncoupled an important pleiotropic activity of IFNγ and, more broadly, that different genes downstream of IFNγ may exhibit different thresholds of activation that can be exploited by structure-based partial and/or biased agonists. This uncoupling of PD-L1 and MHC I expression is potentially of interest in the context of immunotherapy, as these IFNγ variants could enhance presentation of tumour antigens without the concomitant immuno-suppression through checkpoint expression that occurs in response to wild-type IFNγ.
METHODS
Evolution of IFNγR1 on yeast.
IFNγR1 was displayed on yeast as previously described15,22. Staining and selection were performed using streptavidin–Alexa Fluor 647-labelled IFNγR2 with separation of the receptor-yeast population with anti-Alexa Fluor 647 antibody labelled with paramagnetic microparticles. Unlabelled IFNγ (750 nM) was present as a saturating condition during all selections. Expression on the yeast surface was assayed by staining with a Myc-tagged antibody conjugated to Alexa Fluor 647 (Cell Signaling). Progression of the enrichment was monitored by staining the receptor on yeast and analysis by flow cytometry (BD Accuri). Error-prone PCR and DNA shuffling15,23, and 96-well screening were used for engineering IFNγR1 as previously described15.
Protein expression, purification, and structural determination.
IFNγ and signalling variants were expressed in the Hi5 insect expression system (Invitrogen BTI-TN-5B1–4), and purified as previously described21. For crystallization, IFNγ was expressed in the presence of kifunensine. IFNγ DN (K74A, E75Y, and N83R) and related variants were synthesized (Operon) and cloned into the insect expression plasmid. Asymmetric variants were expressed with three tags, allowing for their expression and purification. An 8× His tag at the C terminus was used at the first step of purification from the insect secreted medium. In the second step, rhinovirus 3C protease was used to cleave the encoded 3C linker between the two hetero subunits of the asymmetric IFNγ proteins. After cleavage, the proteins were further purified using a protein C tag encoded at the N terminus and a second 8× His purification to isolate the heterodimeric IFNs. Their receptor binding properties were validated by SEC by injecting 200 μg of each IFNγ alone, in combination with equimolar quantities of IFNγR1, or with IFNγR1 and IFNγR2. IFNγR1 and IFNγR2 were expressed in HEK293S GnTI− cells (ATCC CRL-3022) that were transduced by lentivirus24 encoding each receptor. For glycan-shaved complexes, IFNγ, IFNγR1 F05, and IFNγR2 were deglycosylated by treatment with EndoF and EndoH overnight at 4 °C. Both the deglycosylated and the glycosylated proteins were mixed in equimolar ratios and digested with carboxypeptidase A and B before co-purification by SEC on a Superdex 200 column (GE). The final protein concentration of the glycosylated and deglycosylated complex used in the crystallization screen was 10 mg/ml. Crystals of the deglycosylated complex were obtained within 24 h at 20 °C from the MCSG3 (Anatrace) in the screen condition containing 0.1 M bis-tris propane:HCl, pH 7, 2 M sodium formate. Crystals were cryoprotected by the addition of ethylene glycol to 25%. Diffraction data were collected at 100 K at the Stanford Synchrotron Radiation Lightsource beamline 12–2 to 3.25 Å resolution, using X-rays of wavelength 0.97946 Å. For the glycosylated complex, crystals were grown at 20 °C from the MCSG2 screen in 1.1 M ammonium tartrate dibasic, pH 7.0. Crystals were cryoprotected with 25% ethylene glycol, and diffraction data were acquired at 100 K at the Advanced Light Source beamline 8.2.2 to 3.8 Å resolution using X-rays of wavelength 0.999989 Å.
Data for both structures were processed in XDS25. The structure of the shaved complex was solved by molecular replacement in Phaser26 using models of IFNγ and IFNγR1 from PDB ID 1FG9 and IFNγR2 from PDB ID 5EH1. Iterative cycles of rebuilding and refinement were performed using Coot27, Phenix28,29, and Buster30 using individual atomic B-factors, torsional NCS restraints, and automatically determined TLS groups31. Ligand atoms in the deglycosylated structure include ethylene glycol that was present from the cryoprotectant, glycan residues that remained after digestion of the protein with EndoH, and peaks adjacent to Cys174 on the surface of IFNγR2 that were modelled as disulfide-bound cysteines. Mindful of the low resolution of our data, all heteroatoms were built into mFo − DFc peaks >3σ and assessed after refinement for appropriate hydrogen-bond or disulfide-bond geometry, lack of clashes, and density in the resulting 2mFo − DFc map. The high resolution limit for the final round of refinement was 3.25 Å, chosen by performing paired refinement tests with dmin of 3.1, 3.25 and 3.4 Å resolution as described32. The final model has 97.47% of residues in favoured regions of the Ramachandran plot with zero outliers. The structure of the glycosylated complex was solved by molecular replacement using the refined shaved complex as a search model. Iterative cycles of rebuilding and refinement were performed using Coot and Phenix using torsional NCS restraints, grouped B-factors, and per-chain TLS. To assess our choice of resolution cut-off, we performed paired refinements as above using dmin values of 3.6, 3.8, 4.0 and 4.2 Å, and we selected a 3.8 Å resolution limit for our final refinement. The final structure has 97.39% of residues in favoured regions of the Ramachandran plot with zero outliers. In both structures, partial disorder of one copy of IFNγR2 required the use of NCS-averaged maps for rebuilding. Structure quality was assessed using Molprobity33.
Surface plasmon resonance.
A GE Biacore T100 was used to measure the KD by equilibrium methods. Approximately 100 response units (RU) of IFNγR1 was captured on a SA-chip (GE Healthcare), including a reference channel of an unrelated cytokine receptor (IL-2Rβ). The saturating concentration for both wild-type IFNγ or IFNγ(K74A/E75Y/N83R) was 50 nM and was present in all dilutions of IFNγR2 or IFNγR2(T168N).
Mass spectrometry analysis of IFNγR2(T168N) neo N-glycosylation site.
Approximately 1 μg of purified, recombinant human IFNγR2(T168N) expressed in HEK293S GnTI− (ATCC CRL-3022) cells was denatured and reduced in 8 M urea containing 20% ammonium bicarbonate and 10 mM tris(2-carboxyethyl) phosphine (Thermo Fisher Scientific), then subsequently alkylated with iodoacetamide. After fourfold dilution, the protein was enzymatically digested with chymotrypsin overnight at 37 °C. The resulting digest was then subjected to a C18 Zip-Tip filter clean-up and eluted using 50% acetonitrile, 0.1% formic acid, and filtered through a 0.2-μm nylon spin filter for high-quality peptide purification. A portion of the purified peptides were diluted to 20% acetonitrile and 0.1% formic acid, and 5 μl of ~2ng/μl digests was injected into a Q-Exactive Orbitrap mass spectrometer (Thermo Fisher Scientific) equipped with an Easy nano-LC HPLC system with a C18 EasySpray PepMap RSLC C18 column (50 μm × 15 cm, Thermo Fisher Scientific). Separation of (glyco)peptides was performed with a 30-min binary gradient consisting of solvent A (0.1% formic acid in water) and solvent B (90% acetonitrile and 0.1% formic acid in water) with a constant flow rate of 300 nl/min. Spectra were recorded with a resolution of 35,000 in the positive polarity mode over the range of m/z 350–2,000 and an automatic gain control target value of 1 × 10⁶. The 10 most prominent precursor ions in each full scan were isolated for higher energy collisional dissociation–tandem mass spectrometry (HCD–MS/MS) fragmentation with normalized collision energy of 27%, an automatic gain control target of 2 × 10⁵, an isolation window of m/z 3.0, dynamic exclusion enabled, and fragment resolution of 17,500. Raw data files were analysed using Proteome Discoverer v.2.1.0.81 (Thermo Fisher Scientific) with Byonic v.2.10.5 (Protein Metrics) as a module for automated identification of (glyco)peptides. EICs of all identified (glyco)peptides were generated using Xcalibur v.4.0.27.19 (Thermo Fisher Scientific).
Decoupling of MHC I:PD-L1 expression in cancer and immune cells.
Peripheral blood mononuclear cells (PBMCs) were obtained from healthy donors, who provided written informed consent for research protocols approved by the Stanford Institutional Review Board. Human blood dendritic cells and monocytes were enriched from blood in leukoreduction system chambers by Ficoll-Hypaque density gradient centrifugation. For monocyte enrichment, blood was preincubated with RosetteSep Human Monocyte Enrichment Cocktail (StemCell Technologies). White blood cells were removed and monocytes were isolated with EasySep Human CD14 Positive Selection Kit II (StemCell Technologies). For macrophage differentiation, monocytes were cultured for 6 days in chRPMI (RPMI 1640 (Thermo Fisher Scientific), 10% human serum and 100 U/ml penicillin–streptomycin (GIBCO) and 50 ng/ml recombinant human M-CSF (Peprotech). Dendritic cells were enriched using the EasySep Human Myeloid DC Enrichment kit (19061; StemCell Technologies). The dendritic-cell-enriched samples were stained with DAPI and lineage markers CD19–PE–Cy5 (Beckman Coulter); CD56–FITC, CD3– Alexa700 (Biolegend); CD11c–PE–Cy7, HLA–DR v500, CD14–APC–H7 (BD); and CD304–PE (MACs Miltenyi Biotech). Dendritic cells were sorted on a BD FACsAria II as HLA-DR+CD11c+ cells, which were negative for all other lineage markers. Monocytes, macrophages and dendritic cells were stimulated in chRMPI for 18 or 48 (dendritic cells) hours and harvested using PBS with 5 mM EDTA or Accutase (Fisher Scientific). A549 cells (ATCC CCL-185) were cultured at 37 °C in 5% CO2 and RPMI 1640 (Thermo Fisher Scientific) containing 10% FBS and 100 U/ml penicillin–streptomycin (GIBCO). Cells were plated into 48-well plates, and stimulated for 48 h with various concentrations of protein and harvested using 0.25% trypsin-EDTA (GIBCO). Cells were analysed by flow cytometry using an LSR II (BD). Dead cells were discriminated using the Live/Dead Aqua Fixable Dead Cell Stain Kit (Invitrogen), non-specific antibody binding was minimized using Human FC Block (BD) and surface staining was performed with PE–Dazzle-conjugated anti-PD-L1 (clone 29E.2A3, Biolegend) and v450-conjugated anti-HLA–ABC (clone G46–2.6, BD). The MFI change was calculated by subtracting the MFI of non-stimulated controls from the MFI of stimulated samples, relative to wild-type IFNγ. The relative MHC I:PD-L1 ratio was calculated by dividing the MFI ratios for MHC I that for PD-L1. For screening of cancer cell lines other than A549 cells (ATCC CCL-185), Hap1 (NKI-AVL), MeWo (ATCC HTB-65), Hep G2 (ATCC HB-8065), HT-29 (ATCC HTB-38), Panc-1 (ATCC CRL-1469) or HeLa (ATCC CCL-2) cells were plated in 96-well format, treated with different concentrations of wild-type IFNγ or GIFNs for 24 h, and MHC I:PD-L1 ratios were quantified as previously detailed. For quantification of gene expression by RT– qPCR and next-generation sequencing, 600,000 cells were plated in a 6-well format and treated with proteins for 48 h. RNA was extracted (RNeasy Micro Kit, Qiagen), 1.5 μg of this RNA was then used for RT–qPCR (High Capacity RNA-to-cDNA Kit, Applied Biosystems), and measured by quantitative PCR (qPCR) (PowerSYBR Green PCR Master Mix, Applied Biosystems) on a QuantStudio 3 instrument (Applied Biosystems) according to the manufacturer’s instructions. Primers were purchased from (Operon) for 18S (fwd 5′GTAACCCGTTGAACC CCATT3′, rev 5′CCATCCAATCGGTAGTAGCG3′), HLA-A (fwd 5′CCAGGTAGG CTCTCAACTG3′, rev 5′CCAGGTAGGCTCTCAACTG3′), HLA-B (fwd 5′AACCGTCCTCCTGCTGCTCTC3′, rev 5′CTGTGTGTTCCGGTCCCA ATAC3′), PD-L1 (fwd 5′TGGCATTTGCTGAACGCATTT3′, rev 5′TGCAGCCAG GTCTAATTGTTTT3′). Expression of over 20,000 human genes was measured by next-generation sequencing using the Ion AmpliSeq Human Gene Expression kit (Thermo Fisher). Samples were loaded on a 550 chip and sequenced on an Ion S5 XL sequencer (Thermo Fisher). RNA samples from two biological qPCR experiments were used for sequencing. Samples were barcoded following manufacturer protocols and were as follows: untreated-A (fwd 5′CTAAGGTAAC3′), wild-type-A (fwd 5′TAAGGAGAAC3′), GIFN2-A (fwd 5′AAGAGGATTC3′), GIFN3-A (fwd 5′TACCAAGATC3′), GIFN4-A (fwd 5′CAGAAGGAAC3′), untreated-B (fwd 5′CTGCAAGTTC3′), wild-type-B (fwd 5′TTCGTGATTC3′), GIFN2-B (fwd 5′TTCCGATAAC3′), GIFN3-B (fwd 5′TGAGCGGAAC3′) and GIFN4-B (fwd 5′CTGACCGAAC3′). Gene mapping and analysis was performed using Ion Torrent Suite v.5.10.0 (Thermo Fisher). Heat maps and figures showing PCA of gene expression were generated in MATLAB v.R2018b (MathWorks).
On-cell receptor dimerization.
Receptor homo- and heterodimerization was quantified by two-colour single-molecule co-tracking as described previously34,35. For quantifying receptor heterodimerization, IFNγR1 and IFNγR2 N-terminally fused to variants of monomeric GFP were co-expressed in HeLa cells and labelled using anti-GFP nanobodies Enhancer and Minimizer, respectively. For quantifying homodimerization, GFP-tagged IFNγR1 or IFNγR2 were expressed and labelled with two different colours. Time-lapse dual-colour imaging of individual IFNγR1 and IFNγR2 in the plasma membrane was carried out by total internal reflection fluorescence microscopy with excitation at 561 nm and 640 nm and detection with a single EMCCD camera using an image splitter. Molecules were localized using the multiple-target tracing (MTT) algorithm36. Receptor dimers were identified as molecules that co-localized within a distance threshold of 100 nm for at least 10 consecutive frames.
pSTAT1 signalling and bead-based immunoassay cytokine secretion.
Hap1 cells (NKI-AVL) were plated in a 96-well format and treated with either wildtype IFNγ or partial agonists at varying concentrations for 15 min at 37 °C. The medium was removed and cells were detached with Trypsin (Gibco) for 5 min at 37 °C. Cells were transferred to a deep-well 96-well block containing 10% paraformaldehyde (PFA) by volume and incubated for 15 min at room temperature, washed three times with phosphate-buffered saline containing 0.5% (w/v) BSA (PBSA), resuspended with 100% methanol overnight, and stained with Alexa Fluor 488 conjugated anti-pSTAT1 antibody (Cell Signaling). The half-maximal response concentration (EC50) and Emax of signalling was determined by fitting the data to a sigmoidal dose–response curve (GraphPad Prism v.7). The bead-based immunoassay cytokine secretion assay was performed at the Human Immune Monitoring Center at Stanford University as previously described37 except the experiment was performed on PBMCs isolated from two different donors and measured in triplicate.
Eukaryotic cell lines.
Authentication of cell lines used in this study is guaranteed by the sources. Original validation of Hap1 cells was by whole-genome sequencing, A549 cells by Sanger Sequencing, EBY100 yeast cells by genotyping and sequencing, HeLa cells by the ATCC Cell Line Authentication Service. Invitrogen does not indicate an authentication method for Hi5 cells. ATCC does not provide authentication information for HEK293S GnTI−ATCC (CRL-3022), SF9 (ATCC CTL-1711), MeWo (ATCC HTB-65), Hep G2 (ATCC HB-8065), HT-29 (ATCC HTB-38) or Panc-1 (ATCC CRL-1469) cells. None of the cell lines tested positive for mycoplasma contamination.
Statistical analyses.
No statistical methods were used to predetermine sample size. The experiments were not randomized, and investigators were not blinded to allocation during experiments and outcome assessment. P values were determined for the difference between wild-type and PHA control in the cytokine secretion experiments using the Student’s t-test with a two-tail distribution of a two-sample heteroscedastic test. For the mass-spectrometry experiment, sequence coverage was determined by dividing the number of amino acids identified in the proteomic analysis (179 residues, highlighted in Extended Data Fig. 3b) by the total number of amino acids in the protein (233). The confidence for identification of the peptides in the highlighted region is based on the Byonic algorithm as previously described38.
Reporting summary.
Further information on research design is available in the Nature Research Reporting Summary linked to this paper.
Extended Data
Extended Data Fig. 1. Characterization of IFNγ complex formation and stabilizing mutations.
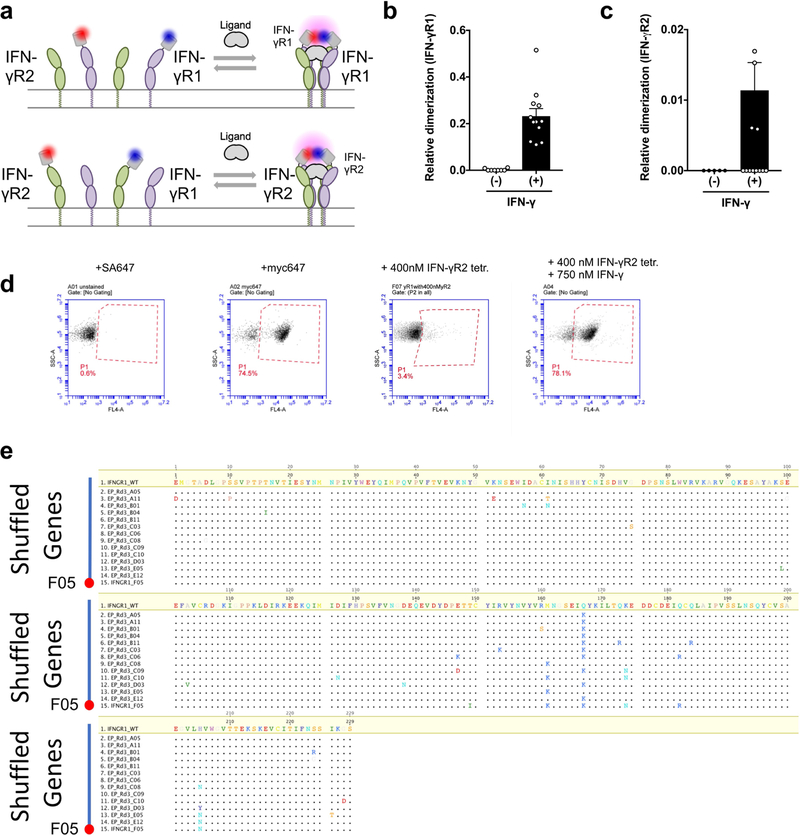
a, Schematic for quantifying the homodimerization of either IFNγR1 (top) or IFNγR2 (bottom) using dye-labelled anti-GFP nanobodies labelled with Rho11 and DY647. b, Homodimerization of IFNγR1 in the absence and presence of ligand. Data are mean ± s.e.m.; n = 8 (−IFNγ) and 12 (+IFNγ); n refers to biologically independent samples. c, Homodimerization of IFNγR2 in absence and presence of ligand. Data are mean ± s.e.m.; where n = 5 (−IFNγ) and 16 (+IFNγ); n refer to biologically independent samples. d, IFNγR1 displays on the surface of the yeast. Second from left, anti-Myc-647 antibody; far left, steptavidin–Alexa Fluor 647. The high avidity form of IFNγR2 only binds to IFNγR1 in the presence of IFNγ (far right) and does not bind IFNγR1 alone (second from right). Data are representative of at least 3 biologically independent experiments. e, Sequence alignment of IFNγR1 genes including 13 first-generation variants and the shuffled IFNγR1 F05 variant relative to wild-type. IFNγR1 F05 combines six mutations including Q167K and M161K. The combination of Q167K and M161K is not seen in any single first-generation mutant.
Extended Data Fig. 2. Purification and electron density maps of the IFNγ hexameric signalling complex.
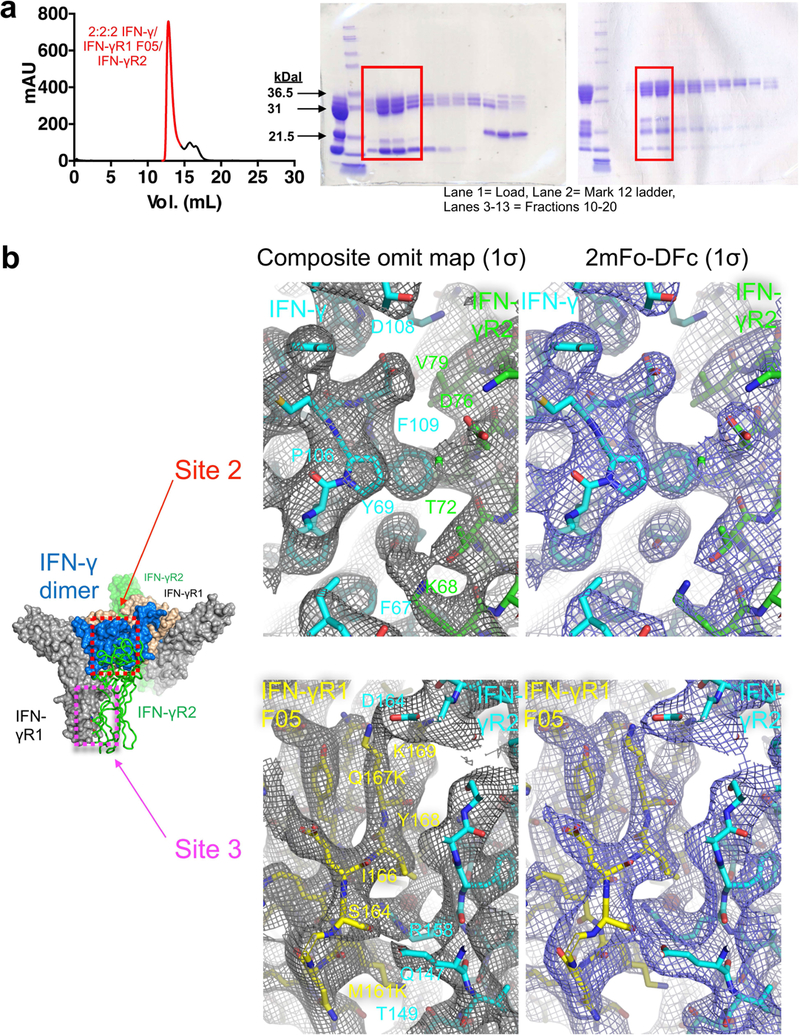
a, SEC (Superdex S200 column) of the 2:2:2 IFNγ–IFNγR1–IFNγR2 complex and SDS–PAGE gels of the deglycosylated (top, left gel) and fully glycosylated (top, right gel) forms. Data shown are representative of at least 3 biologically independent experiments. mAU, milli absorbance units. b, Electron density maps showing interactions at site 2 (top) and site 3 (bottom) in the deglycosylated complex. For each pair of site 2 or site 3 panels, the left panel shows a simulated annealing composite omit map (grey) contoured at 1σ, and the right panel shows a 2mFo − DFc map (blue) calculated using phases from the final refined model and contoured at 1σ. IFNγ (green) engages IFNγR2 (cyan) at site 2, whereas the stems of IFNγR1 F05 (yellow) and IFNγR2 interact at site 3.
Extended Data Fig. 3. Quantification of IFNγR2(T168N) glycoforms by mass spectroscopy.
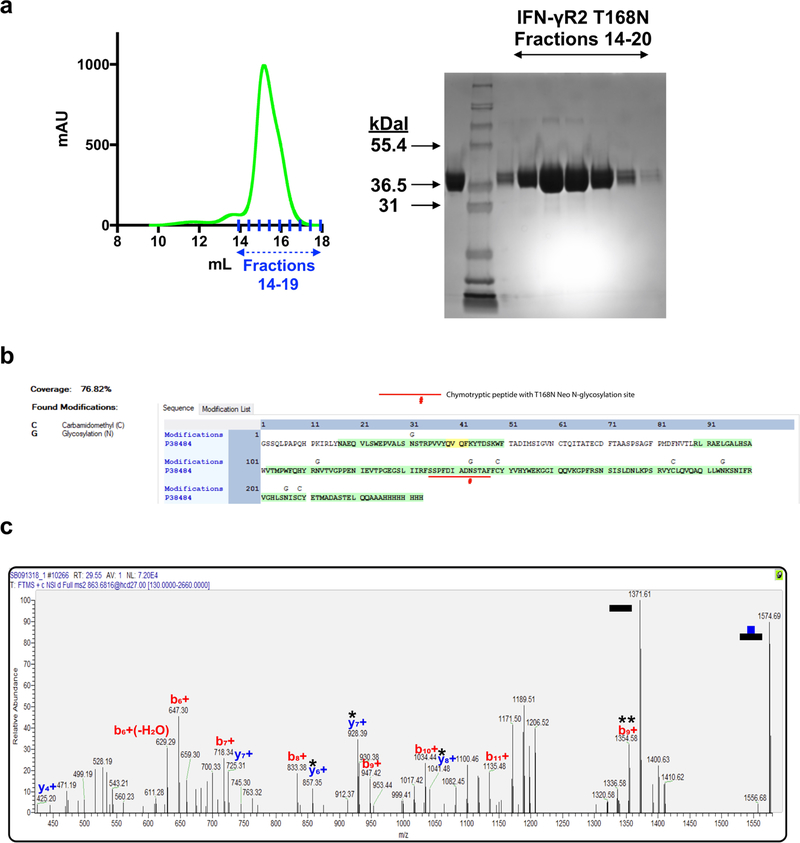
a, The mutant IFNγR2(T168N) protein was expressed in HEK293S GnTI− cells and purified by SEC. The SEC profile is shown (left) with the corresponding fractions on SDS–PAGE (right). Lane 1 shows the sample loaded on the SEC column, lane 2 shows the Mark 12 protein ladder, and lanes 3–9 are fractions 14–20. Data are representative of at least 3 biologically independent experiments. b, The protein coverage map shows sequence coverage of 76.82% for the entire IFNγR2(T168N) protein including the peptide of interest, containing N168, which is underlined. This peptide was detected as a glycopeptide with several glycoforms as quantified in Fig. 3d. Mappings highlighted in green indicate high confidence with a false discovery rate (FDR) below 1% and yellow indicates a FDR of 1–5%. Carbamidomethyl (C) and glycosylation (G) sites are indicated above the site of modification. Confidence levels were determined as previously described38. c, MS2 spectra confirming that the ion used for the EICs shown in Fig. 3d is the peptide SSPFDIADNSTAF from IFNγR2(T168N) modified with a HexNAc2Hex5 glycan attached to N168. The data shown are for a single experiment.
Extended Data Fig. 4. Disrupting IFNγR2 binding and characterization of IFNγ partial agonists.
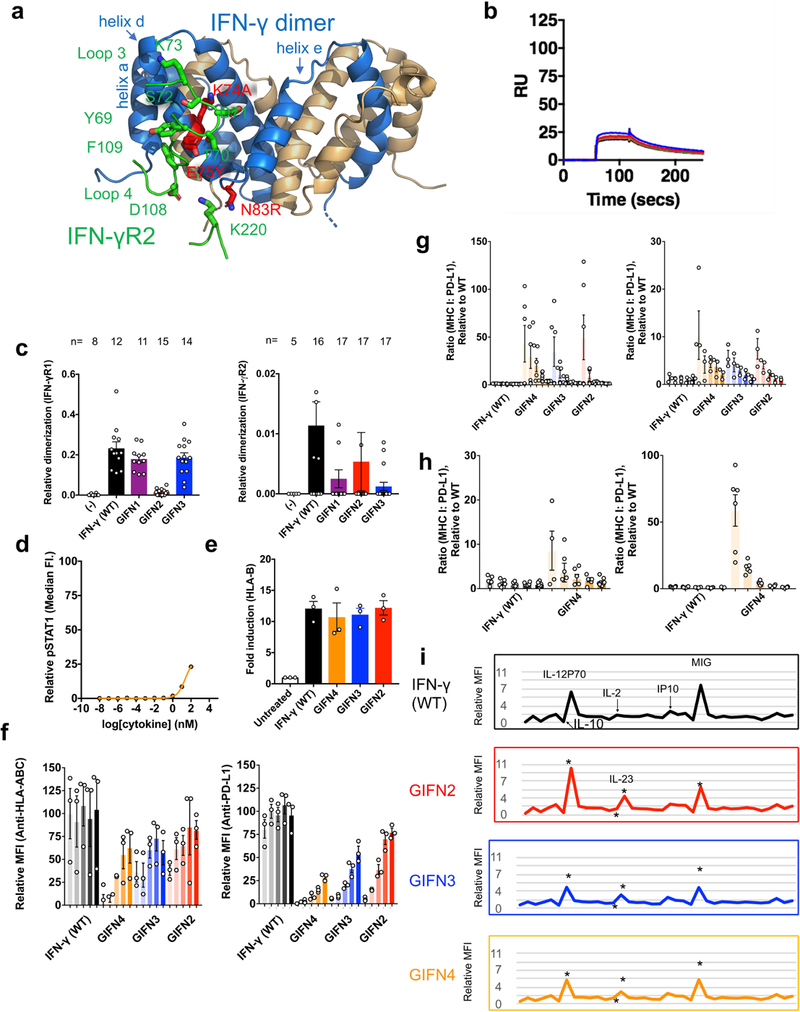
a, The structure of IFNγ (blue and tan cartoon) binding site for IFNγR2 (interacting loops are shown in green). Based on the hexameric complex, positions in IFNγ at the IFNγR2 binding interface were identified to be important for binding to IFNγR2. The location of IFNγ mutations K74A, E75Y, and N83R are shown as sticks coloured in red. b, When complexed with IFNγ R1, the IFNγ triple mutant (K74A/E75Y/N83R) results in the loss of detectable binding to IFNγR2 (up to 100 μM) as determined by SPR. The titration data are from a single experiment. c, Relative co-tracking of binding of IFNγR1 (left panel) and IFNγR2 (right panel) for wild-type IFNγ and variants. GIFN2, one IFNγR1 and one IFNγR2 binding in cis; GIFN3, two IFNγR1 molecules bound; GIFN4, reduced affinity for both IFNγR1 and IFNγR2 (see Extended Data Fig. 5). Data are mean ± s.e.m.; n is indicated over each bar; n refers to the number of biologically independent samples. d, STAT1 activation of GIFN4 in Hap1 cells. Curve was fit to a first-order logistic model. Data are mean; n = 2 biologically independent samples. e, Quantification of MHC class I expression by qPCR using primers against HLA chain b in A549 treated cells. Data are mean ± s.e.m.; n = 3 biologically independent experiments. f, Dendritic cells purified from whole blood were treated for 48 h with either wild-type IFNγ or the partial agonists for 48 h; these agonists upregulate MHC class I antigen expression as quantified by fluorescently labelled antibody (left) or PD-L1 (right). Data shown are for ligand concentrations of 0.1, 0.5, 2.5, 12.5 and 62.5 nM (left to right, respectively, for each agonist). Data are mean ± s.e.m.; n = 3 biologically independent experiments. g, Using the MHC class I and PD-L1 expression data (f and Fig. 5b), the ratio of MHC I:PD-L1 induction was determined for each protein concentration relative to wild-type. Left, dendritic cells; right, A549 cells. Data are mean ± s.e.m.; n = 3 biologically independent experiments. h, Biased MHC I:PD-L1 expression for monocytes (right) and macrophages (left) isolated from PBMCs. Data as shown are for protein concentrations of 0.1, 0.5, 2.5, 12.5 and 62.5 nM (left to right, respectively, for each agonist). Data are mean ± s.e.m.; n = 6 independent samples. i, Cytokine secretion profile of IFNγ and partial agonists for PBMCs treated with 100 nM of each protein for 24 h. Shown are the mean expression of 36 secreted cytokines that are significantly different (P < 0.05) between the wild-type and PFA-treated control. Expression of IL-10, IL-12P70, IL-2, IP-10, MIG and IL-23 are indicated in text or asterisks aligned below the text. Data shown are for n = 2 biologically independent samples, each assayed in triplicate. P values were determined using the Student’s t-test with a two-tailed distribution of a two-sample heteroscedastic test.
Extended Data Fig. 5. Design and biochemical characterization of GIFNs.
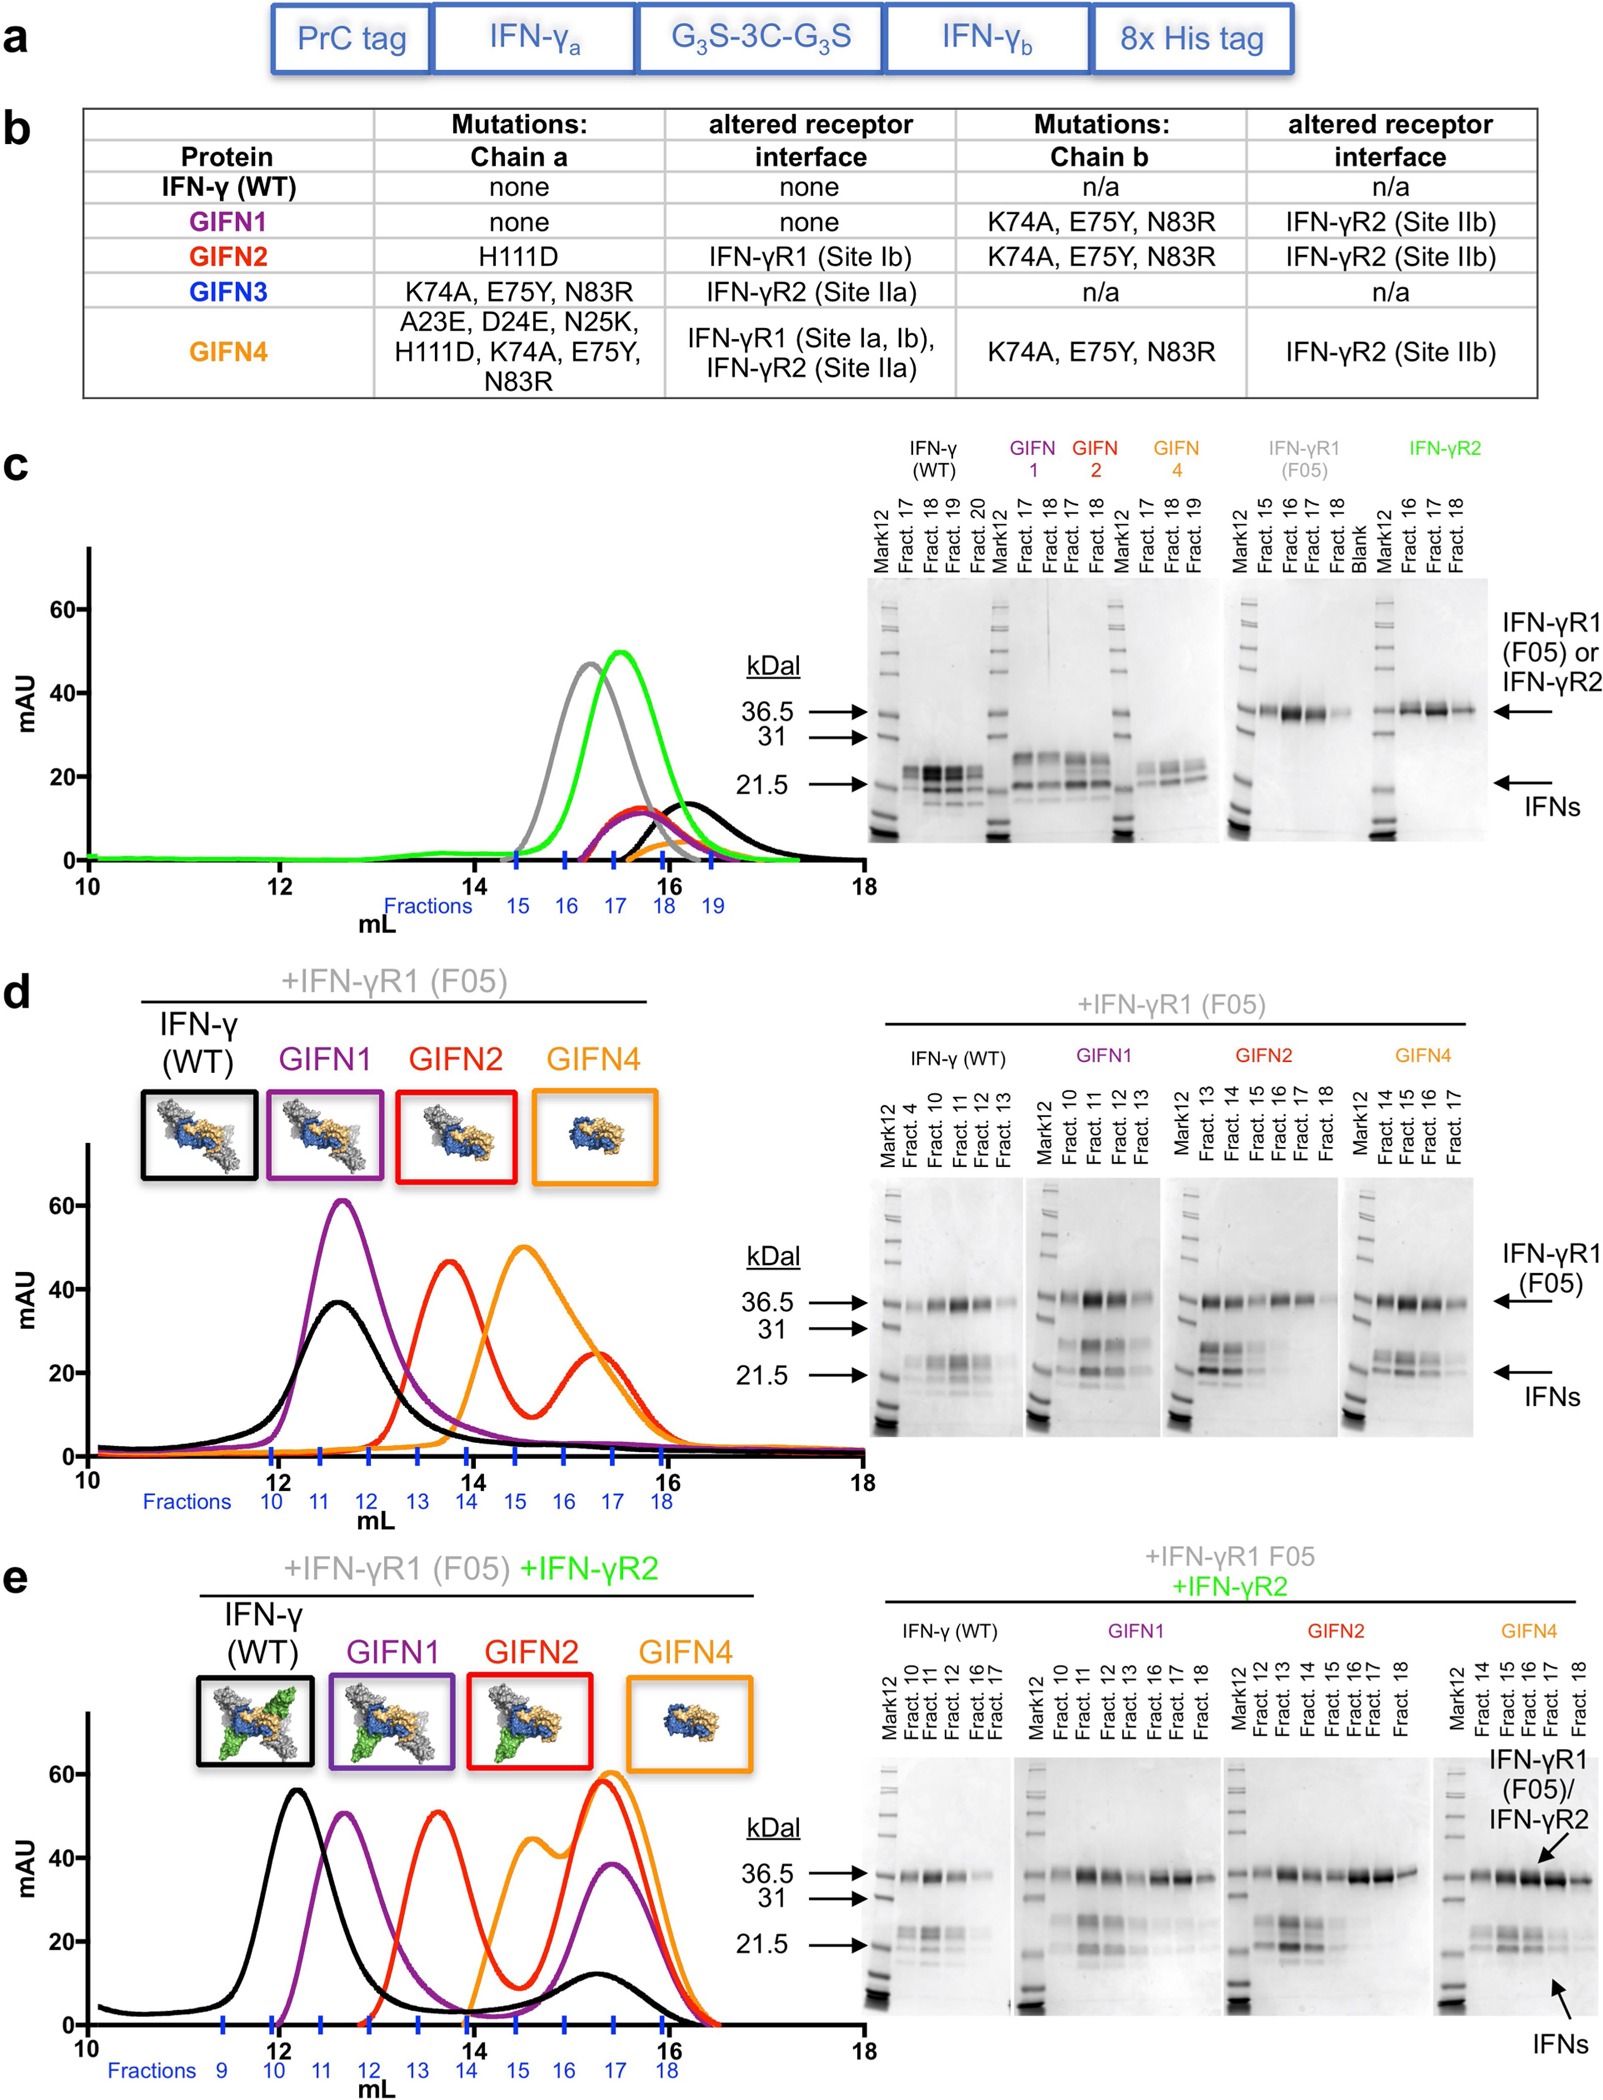
a, Diagram showing the strategy for expression and purification of heterodimeric IFNγ variants. The asymmetric variants containing three tags were expressed as single polypeptides in Hi5 insect cells. The proteins were first harvested from the secreted medium with a C-terminal 8× His tag. Proteins eluted from nickel resin were then treated with 1:100 (by mass) human rhinovirus 3C protease for 24 h at 4 °C to cleave the 3C protease tag. The 3C tag is flanked by Gly-Gly-Gly-Ser motifs at both ends (G3S-3C-G3S) to ensure accessibility of the protease site between the two chains of IFNγ. The cleaved proteins were then purified using the N-terminal protein C-tag and a final 8× His tag purification to ensure isolation of the correctly paired heterodimeric IFNγ proteins. b, Table of mutations for each of the GIFN proteins, indicating the affected receptor binding sites. GIFN2, one IFNγR1 and one IFNγR2 binding in cis; GIFN3, two IFNγR1 molecules bound; GIFN4, reduced affinity for both IFNγR1 and IFNγR2. c, SEC profiles and SDS–PAGE gel fractions for 200 μg wild-type IFNγ (black) or equal molar quantities of GIFN1 (purple), GIFN2 (red), GIFN4 (orange), IFNγR1 F05 (grey), and IFNγR2 (green). Individual proteins have been purified and analysed by SEC at least three times. d, e, To determine the receptor-binding properties of the GIFN proteins, the shifts in the SEC profiles and gels were compared relative to the wild-type protein as described for c except IFNs were mixed with equimolar quantities of IFNγR1 F05 (d) or equimolar quantities of both IFNγR1 F05 and IFNγR2 (e). These data are from single experiments except the wild-type experiments which were performed at least three times.
Extended Data Table 1 |.
Data collection and refinement statistics (molecular replacement)
| Shaved IFN-γ:IFN-γR 1 :IFN-γR2 complexa | Glycosylated IFN-γ:IFN-γR 1 :IFN-γR2 complexb | |
|---|---|---|
| Data collection | ||
| Space group | P212121 | P212121 |
| Cell dimensions | ||
| a, b,c(Å) | 78.284 151.464 | 78.694 150.212 |
| 211.30 | 212.668 | |
| α, β, γ (°) | 90, 90, 90 | 90. 90, 90 |
| Resolution (Å) | 37.19−3.25 (3.366−3.25)* | 48.38−3.8 (3.936−3.8) |
| Rmerge | 0.09555 (1.646) | 0.2724 (3.243) |
| I / σI | 12.66(1.43) | 9.98 (0.95) |
| Completeness (%) | 97.32 (99.85) | 97.32(99.85) |
| Redundancy | 6.5 (6.8) | 14.6(14.9) |
| CC1/2 | 0.999 (0.685) | 0.999(0.461) |
| Refinement | ||
| Resolution (Å) | 37.19−3.25 (3.366−3.25)* | 48.38−3.8 (3.936 3.8) |
| No. reflections | 39329 (3965) | 25569 (2543) |
| Rwork / Rfree | 0.1906/0.2336 | 0.2487/0.2695 |
| No. atoms | 8966 | 8984 |
| Protein | 8677 | 8641 |
| Ligand/ion | 281 | 343 |
| Water | 8 | 0 |
| B-factors | 164.82 | 215.78 |
| Protein | 163.67 | 214.02 |
| Ligand/ion | 202.05 | 260.34 |
| Water | 108.67 | − |
| R.m.s. deviations | ||
| Bond lengths (Å) | 0.003 | 0.004 |
| Bond angles (°) | 0.59 | .80 |
One crystal was used for structure determination.
Values in parentheses are for highest-resolution shell.
Supplementary Material
Acknowledgements
We thank W. Schneider, H.-H. Hoffman and C. Rice for assistance with antiviral experiments; S. Bendall and L. Borges for assistance with CyTOF experiments; and J.-L. Casanova, J. Bustamante and C. Oleaga for assistance with experiments with IFNGR2 T168N cell lines.This work was supported by NIH grants 1U19AI109662, 5R01CA177684 and NIH RO1-AI51321 (to K.C.G.), by the DFG grants SFB 944 and PI 405/10–1 (to J.P.), by NIH HD090156 (to R.S.H.), and by NIH U54 CA209971 and DoD BC140436 (to E.G.E.). K.C.G. is an investigator of the Howard Hughes Medical Institute and is supported by the Ludwig Institute and the Younger Family Chair. J.L.M. is supported by NIH award K01CA175127. We thank the staff at Stanford Synchrotron Radiation Lightsource and Advanced Light Source for their assistance. The Advanced Light Source is a Department of Energy Office of Science User Facility under Contract No. DE-AC02–05CH11231. Use of the Stanford Synchrotron Radiation Lightsource, SLAC National Accelerator Laboratory, is supported by the US Department of Energy, Office of Science, Office of Basic Energy Sciences under Contract No. DE-AC02–76SF00515. The SSRL Structural Molecular Biology Program is supported by the DOE Office of Biological and Environmental Research, and by the National Institutes of Health, National Institute of General Medical Sciences (including P41GM103393).
Competing interests K.C.G. and J.L.M. are co-inventors on provisional patent application 62/712,128, which includes discoveries described in this manuscript. K.C.G. is the founder of Synthekine Therapeutics.
Footnotes
Data availability
Structure factors and coordinates have been deposited in the Protein Data Bank with identification numbers 6E3K and 6E3L. Diffraction images have been deposited in the SBGrid Data Bank with dataset ID 591 and 592. Next-generation sequencing data files from the human transcriptome study were deposited to the NCBI Gene Expression Omnibus (GEO) data repository with accession number GSE122672. Other data and materials are available upon request from the corresponding author.
Online content
Any methods, additional references, Nature Research reporting summaries, source data, statements of data availability and associated accession codes are available at https://doi.org/10.1038/s41586–019-0988–7.
Extended data is available for this paper at https://doi.org/10.1038/s41586–019-0988–7.
Supplementary information is available for this paper at https://doi.org/10.1038/s41586–019-0988–7.
Publisher’s note: Springer Nature remains neutral with regard to jurisdictional claims in published maps and institutional affiliations.
Reviewer information Nature thanks Michael Parker, Antoni Ribas and the other anonymous reviewer(s) for their contribution to the peer review of this work.
Online content
Any methods, additional references, Nature Research reporting summaries, source data, statements of data availability and associated accession codes are available at https://doi.org/10.1038/s41586–019-0988–7.
References
- 1.Pace JL, Russell SW, LeBlanc PA & Murasko DM Comparative effects of various classes of mouse interferons on macrophage activation for tumor cell killing. J. Immunol 134, 977–981 (1985). [PubMed] [Google Scholar]
- 2.Nakajima C et al. A role of interferon-γ (IFN-γ) in tumor immunity: T cells with the capacity to reject tumor cells are generated but fail to migrate to tumor sites in IFN-γ-deficient mice. Cancer Res 61, 3399–3405 (2001). [PubMed] [Google Scholar]
- 3.Stark GR, Kerr IM, Williams BR, Silverman RH & Schreiber RD How cells respond to interferons. Annu. Rev. Biochem 67, 227–264 (1998). [DOI] [PubMed] [Google Scholar]
- 4.Mandai M et al. Dual faces of IFNγ in cancer progression: a role of PD-L1 induction in the determination of pro- and antitumor immunity. Clin. Cancer Res 22, 2329–2334 (2016). [DOI] [PubMed] [Google Scholar]
- 5.Yphantis DA & Arakawa T Sedimentation equilibrium measurements of recombinant DNA derived human interferon gamma. Biochemistry 26, 5422–5427 (1987). [DOI] [PubMed] [Google Scholar]
- 6.Bach EA et al. Ligand-induced autoregulation of IFN-γ receptor β chain expression in T helper cell subsets. Science 270, 1215–1218 (1995). [DOI] [PubMed] [Google Scholar]
- 7.Pernis A et al. Lack of interferon gamma receptor beta chain and the prevention of interferon gamma signaling in TH1 cells. Science 269, 245–247 (1995). [DOI] [PubMed] [Google Scholar]
- 8.Tau GZ, Cowan SN, Weisburg J, Braunstein NS & Rothman PB Regulation of IFN-γ signaling is essential for the cytotoxic activity of CD8+ T cells. J. Immunol 167, 5574–5582 (2001). [DOI] [PMC free article] [PubMed] [Google Scholar]
- 9.Walter MR et al. Crystal structure of a complex between interferon-γ and its soluble high-affinity receptor. Nature 376, 230–235 (1995). [DOI] [PubMed] [Google Scholar]
- 10.Blouin CM et al. Glycosylation-dependent IFN-γR partitioning in lipid and actin nanodomains is critical for JAK activation. Cell 166, 920–934 (2016). [DOI] [PubMed] [Google Scholar]
- 11.Krause CD et al. Seeing the light: preassembly and ligand-induced changes of the interferon γ receptor complex in cells. Mol. Cell. Proteomics 1, 805–815 (2002). [DOI] [PubMed] [Google Scholar]
- 12.Moraga I et al. Tuning cytokine receptor signaling by re-orienting dimer geometry with surrogate ligands. Cell 160, 1196–1208 (2015). [DOI] [PMC free article] [PubMed] [Google Scholar]
- 13.Roder F, Wilmes S, Richter CP & Piehler J Rapid transfer of transmembrane proteins for single molecule dimerization assays in polymer-supported membranes. ACS Chem. Biol 9, 2479–2484 (2014). [DOI] [PubMed] [Google Scholar]
- 14.Richter D et al. Ligand-induced type II interleukin-4 receptor dimers are sustained by rapid re-association within plasma membrane microcompartments. Nat. Commun 8, 15976 (2017). [DOI] [PMC free article] [PubMed] [Google Scholar]
- 15.Mendoza JL et al. The IFN-λ–IFN-λR1–IL-10Rβ complex reveals structural features underlying type III IFN functional plasticity. Immunity 46, 379–392 (2017). [DOI] [PMC free article] [PubMed] [Google Scholar]
- 16.Thiel DJ et al. Observation of an unexpected third receptor molecule in the crystal structure of human interferon-γ receptor complex. Structure 8, 927–936 (2000). [DOI] [PubMed] [Google Scholar]
- 17.Mikulecký P et al. Crystal structure of human interferon-γ receptor 2 reveals the structural basis for receptor specificity. Acta Crystallogr. D 72, 1017–1025 (2016). [DOI] [PMC free article] [PubMed] [Google Scholar]
- 18.Vogt G et al. Gains of glycosylation comprise an unexpectedly large group of pathogenic mutations. Nat. Genet 37, 692–700 (2005). [DOI] [PubMed] [Google Scholar]
- 19.Lundell D, Lunn CA, Senior MM, Zavodny PJ & Narula SK Importance of the loop connecting A and B helices of human interferon-γ in recognition by interferon-γ receptor. J. Biol. Chem 269, 16159–16162 (1994). [PubMed] [Google Scholar]
- 20.Lunn CA et al. A point mutation of human interferon gamma abolishes receptor recognition. Protein Eng 5, 253–257 (1992). [DOI] [PubMed] [Google Scholar]
- 21.Thomas C et al. Structural linkage between ligand discrimination and receptor activation by type I interferons. Cell 146, 621–632 (2011). [DOI] [PMC free article] [PubMed] [Google Scholar]
- 22.Levin AM et al. Exploiting a natural conformational switch to engineer an interleukin-2 ‘superkine’. Nature 484, 529–533 (2012). [DOI] [PMC free article] [PubMed] [Google Scholar]
- 23.Brideau-Andersen AD et al. Directed evolution of gene-shuffled IFN-α molecules with activity profiles tailored for treatment of chronic viral diseases. Proc. Natl Acad. Sci. USA 104, 8269–8274 (2007). [DOI] [PMC free article] [PubMed] [Google Scholar]
- 24.Bandaranayake AD et al. Daedalus: a robust, turnkey platform for rapid production of decigram quantities of active recombinant proteins in human cell lines using novel lentiviral vectors. Nucleic Acids Res 39, e143 (2011). [DOI] [PMC free article] [PubMed] [Google Scholar]
- 25.Kabsch W Xds. Acta Crystallogr. D 66, 125–132 (2010). [DOI] [PMC free article] [PubMed] [Google Scholar]
- 26.McCoy AJ et al. Phaser crystallographic software. J. Appl. Crystallogr 40, 658–674 (2007). [DOI] [PMC free article] [PubMed] [Google Scholar]
- 27.Emsley P, Lohkamp B, Scott WG & Cowtan K Features and development of Coot. Acta Crystallogr. D 66, 486–501 (2010). [DOI] [PMC free article] [PubMed] [Google Scholar]
- 28.Adams PD et al. PHENIX: a comprehensive Python-based system for macromolecular structure solution. Acta Crystallogr. D 66, 213–221 (2010). [DOI] [PMC free article] [PubMed] [Google Scholar]
- 29.Afonine PV et al. Towards automated crystallographic structure refinement with phenix.refine. Acta Crystallogr. D 68, 352–367 (2012). [DOI] [PMC free article] [PubMed] [Google Scholar]
- 30.Smart OS et al. Exploiting structure similarity in refinement automated NCS and target-structure restraints in BUSTER. Acta Crystallogr. D 68, 368–380 (2012). [DOI] [PMC free article] [PubMed] [Google Scholar]
- 31.Painter J & Merritt EA Optimal description of a protein structure in terms of multiple groups undergoing TLS motion. Acta Crystallogr. D 62, 439–450 (2006). [DOI] [PubMed] [Google Scholar]
- 32.Karplus PA & Diederichs K Assessing and maximizing data quality in macromolecular crystallography. Curr. Opin. Struct. Biol 34, 60–68 (2015). [DOI] [PMC free article] [PubMed] [Google Scholar]
- 33.Chen VB et al. MolProbity: all-atom structure validation for macromolecular crystallography. Acta Crystallogr. D 66, 12–21 (2010). [DOI] [PMC free article] [PubMed] [Google Scholar]
- 34.Wilmes S et al. Receptor dimerization dynamics as a regulatory valve for plasticity of type I interferon signaling. J. Cell Biol 209, 579–593 (2015). [DOI] [PMC free article] [PubMed] [Google Scholar]
- 35.Ho CCM et al. Decoupling the functional pleiotropy of stem cell factor by tuning c-Kit signaling. Cell 168,1041–1052 (2015). [DOI] [PMC free article] [PubMed] [Google Scholar]
- 36.Serge A, Bertaux N, Rigneault H & Marguet D Dynamic multiple-target tracing to probe spatiotemporal cartography of cell membranes. Nat Methods 5, 687–694 (2008). [DOI] [PubMed] [Google Scholar]
- 37.Moraga I et al. Synthekines are surrogate cytokine and growth factor agonists that compel signaling through non-natural receptor dimers. eLife 6, e22882 (2017). [DOI] [PMC free article] [PubMed] [Google Scholar]
- 38.Bern M, Kil YJ & Becker C Byonic: advanced peptide and protein Identification software. Curr. Protoc. Bioinformatics 40, 13.20.1–13.20.14 (2012). [DOI] [PMC free article] [PubMed] [Google Scholar]
Associated Data
This section collects any data citations, data availability statements, or supplementary materials included in this article.


