Significance
Most biological tissue is opaque, and the inside fine structures are invisible even with a microscope. Optical clearing methods can reduce the scattering and enable us to “look” inside the biological samples. Current optical clearing methods suffer from large time consumption, tissue distortion, and fluorescence quenching, which greatly limit their applications. Here, we describe a nontoxic ultrafast optical clearing method (FOCM), which could clarify 300-µm-thick brain slices within 2 min without morphology distortion. The fluorescence can be preserved up to 86% even after 11 d. Besides, the cheap reagents and easy operation makes our method have great potential to be widely used. Besides the brain slices, our method can also be applied to other biological tissues.
Keywords: optical clearing, tissue clearing, deep tissue imaging
Abstract
Optical clearing is a versatile approach to improve imaging quality and depth of optical microscopy by reducing scattered light. However, conventional optical clearing methods are restricted in the efficiency-first applications due to unsatisfied time consumption, irreversible tissue deformation, and fluorescence quenching. Here, we developed an ultrafast optical clearing method (FOCM) with simple protocols and common reagents to overcome these limitations. The results show that FOCM can rapidly clarify 300-µm-thick brain slices within 2 min. Besides, the tissue linear expansion can be well controlled by only a 2.12% increase, meanwhile the fluorescence signals of GFP can be preserved up to 86% even after 11 d. By using FOCM, we successfully built the detailed 3D nerve cells model and showed the connection between neuron, astrocyte, and blood vessel. When applied to 3D imaging analysis, we found that the foot shock and morphine stimulation induced distinct c-fos pattern in the paraventricular nucleus of the hypothalamus (PVH). Therefore, FOCM has the potential to be a widely used sample mounting media for biological optical imaging.
Deep tissue imaging with subcellular resolution is one of the most demanded techniques in biological science, since it can restore the morphology of cells and analyze the system-level information (1–3). Up to now, imaging deep inside tissue is still a major challenge due to high scattering properties of biological sample such as brain tissue (4–6). Generally, mechanical tissue sectioning methods are used to image the whole sample (7, 8). However, they may involve sample deformation, losing detail information especially from the edge of each slice, and usually require considerable time and labor. However, current emerged optical imaging techniques can either achieve single-cellular resolution to a depth of several millimeters in the mouse brain by using scattered light (9–12) or recover near diffraction-limited resolution at around 400 μm deep into mouse brain by compensating optical aberrations (13–15). However, these optical systems are usually suffered from low imaging speed and high price. Tissue clearing is an affordable alternative to imaging deep by reducing the tissue scattering and unifying the refractive index (RI) distribution.
Current pioneering optical clearing methods are classified as: (i) SeeDB (16–18) and ClearT (19) immerse the tissue into a high RI solution to match the RI; (ii) CLARITY (20–22), PACT, and PARS (23) remove cell membranes and protein by SDS to decrease the scattering of the sample while preserving native epitope with acrylamide hydrogel; (iii) 3DISCO (24), iDISCO (25), uDISCO (26) and FDISCO (27) as dichloromethane and dibenzyl ether are key organic compounds render tissue transparent by lipid removal and protein denaturation; and (iv) Scale (28) and ScaleS (29) partially denatured protein for hyperhydration with urea. CUBIC (30, 31) further applied delipidation reagents to obtain better results (32, 33).
However, the current optical clearing methods have the disadvantages of large time consumption, morphology distortion, and complex protocols, which greatly restrict their applications especially in the efficiency-first field. In addition, in hydrogel embedding and solvent-based clearing methods, the toxic reagents cause severe fluorescence quenching and the general membrane dyes cannot be targeted due to lipid removal. Moreover, tissue may become fragile after clearing process, making it inconvenient to transfer the sample from incubate chamber to the imaging platform. Here, we report an ultrafast optical clearing method (termed FOCM), which combined dehydration of water-miscible polar solvent and hydration of urea together with almost no tissue deformation, less fluorescent toxicity, and ease of operation. With FOCM, a 300-µm-thick brain section could be cleared within 2 min by four commonly used reagents: dimethyl sulfoxide (DMSO), urea, d-sorbitol, and glycerol. Thus, FOCM enabled a practical and efficient way to reduce tissue scattering and improve optical imaging quality.
Results
FOCM Combines Dehydration of Solvent with Hyperhydration, Enabling an Ultrafast Tissue Clearing with Negligible Distortion.
Considering the clearing efficiency, we used DMSO as a solvent for its features of low toxicity, high dissolving ability, and protein partially denatured capacity. The previous studies demonstrated that the detected signals could be increased as the scattering was substantially reduced by DMSO in both in vivo and in vitro skin (6, 34). Urea was proved to be a good choice in ScaleS and CUBIC for its clearing ability. The other reagents including sorbitol and glycerol were added to enhance the transparency and counterbalance the tissue distortion (SI Appendix, Fig. S1). The final RI of FOCM reagent is 1.495 at 25.1 °C.
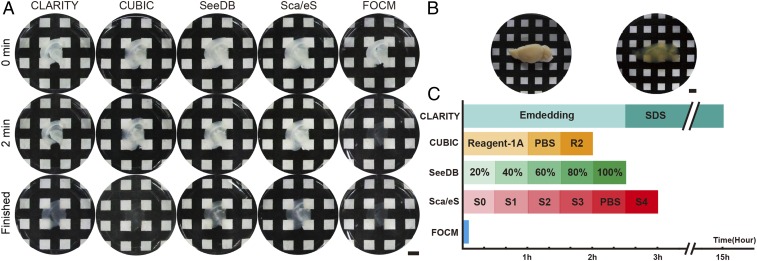
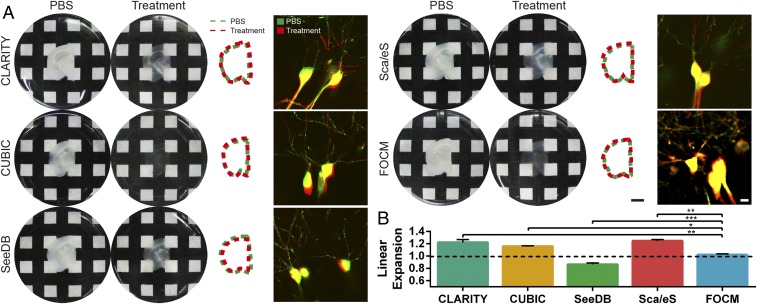
To examine the clearing capacity, we implemented FOCM to 300-µm-thick brain slices (Fig. 1A), brain hemisphere (Fig. 1B), and internal organs (SI Appendix, Fig. S2), respectively. Compared with CLARITY and CUBIC, which aim to achieve a very efficient clearing results of whole organ/body with delipidation, FOCM aims at ultrafast tissue slices clearing with high fluorescent preservation and simple protocol. To be specific, it only took less than 2 min with FOCM to make 300-µm-thick brain slices transparent (Movie S1). The ultrafast clearing process reduced the clearing time ∼450 times versus CLARITY, ∼60 times versus CUBIC, ∼90 times versus ScaleS, and ∼75 times versus SeeDB (Fig. 1C). Besides, there was only 2.12% tissue expansion after FOCM treatment compared with 22.0% expansion with CLARITY, 15.9% expansion with CUBIC, 24.5% expansion with ScaleS, and 13.5% shrinkage with SeeDB. To investigate the relationship between tissue expansion or shrinkage with cell morphology distortion, we merged the images of soma with dendrites before and after clearing. To present the merge results clearly, we cut the image with the original large field of view to a smaller one. The results show that all of the methods preserved the morphology of soma as in phosphate-buffered saline (PBS), but only FOCM could merge the dendrites before and after clearing. The possible reason might be tissue expansion or shrinkage and the unavoidable human-made distortion during multisteps treatment in CLARITY, CUBIC, ScaleS, and SeeDB (Fig. 2). Notably, with the utilization of urea, 300-µm-thick fragile brain slices became much firmer and could be easily handled. (SI Appendix, Fig. S3).
Fig. 1.
Ultrafast tissue clearing process with FOCM. (A) Transparency of samples (300-μm thick) at the 0 min, 2 min, and the time of clearing completed with different methods. (B) A fixed hemisphere of a C57BL/6 mouse (9 wk old) before and after clearing with FOCM. (C) Schedules and clearing time comparison of different clearing methods. (Scale bars: 5 mm.)
Fig. 2.
Tissue morphology preserving with FOCM (A) Sample size (300 μm thick) changes before (Left) and after (Center Left) clearing by CLARITY, CUBIC, ScaleS, SeeDB, and FOCM. In addition, the comparison of slices outlines before and after clearing was shown in Center Right, and distortion of microscopy imaging with Thy1-GFP-M mice before and after clearing was shown in Right. (B) Statistical data showed the sample morphology changes after different methods of treatment. The histogram was shown as the mean ± SEM (n = 3). Statistical significance (***P < 0.001, **P < 0.01, *P < 0.05) was assessed by one-way ANOVA followed by Bonferroni’s multiple comparison tests. Scale bars: Center Right, 5 mm; Right, 10 µm.)
Fluorescent Signals Preserving After FOCM.
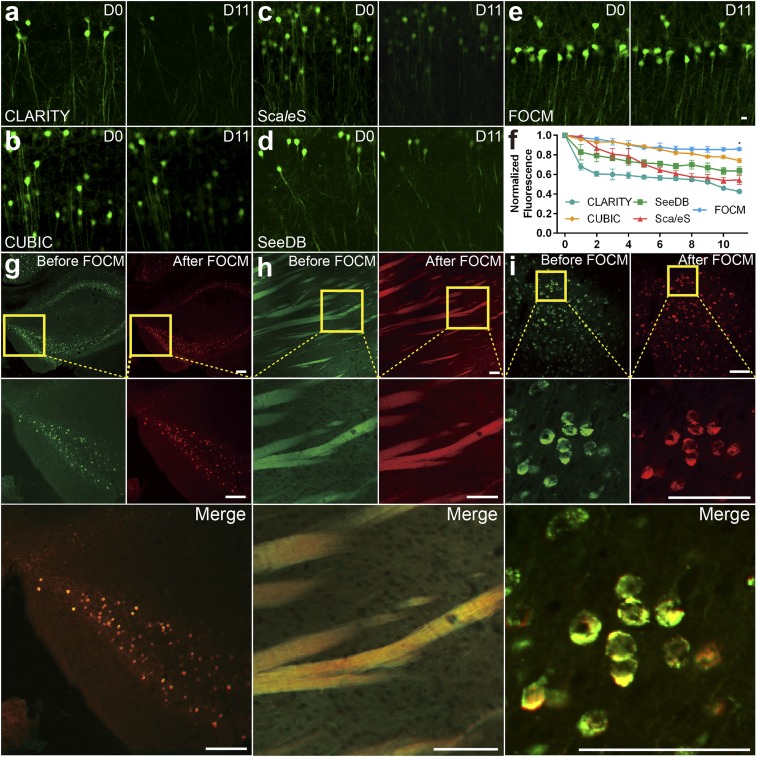
To examine the fluorescent signal quenching after FOCM, adult Thy1-GFP-M mouse brain slices were incubated with different clearing solutions and imaged under the same imaging condition (Olympus FV1000 with 40× UPLSAPO objective lens). Fig. 3 compares the fluorescence preservation effects with various methods in RI matching reagents. The results show that 86% of GFP fluorescent signals by FOCM could be preserved after 11 d (Fig. 3E), compared with 42.6% by CLARITY (Fig. 3A), 74.1% by CUBIC (Fig. 3B), 54.3% by ScaleS (Fig. 3C), and 63.7% by SeeDB (Fig. 3D). We also examined whether FOCM was compatible with general staining methods such as immunofluorescence and chemical dye (35) without cell morphology disorganization. Here, c-fos antibody was applied to label active neurons in hippocampus (Fig. 3G) and DiO solution to label neuron bundles in the striatum (Fig. 3H). We first obtained the control images in PBS before FOCM. Then the same regions were imaged under the same imaging condition after FOCM. From the merged images we found that FOCM had a good compatibility with both immunofluorescence and chemical dye with negligible tissue distortion. Notably, DiO was used to label cell membrane, which confirmed that FOCM could maintain the integrity of neuron cell membrane system. Besides, the virus-labeled mouse slices were also used to test the fluorescent signals preserving capability of FOCM, shown in Fig. 3I. We injected AAV9-Syn-mCherry into the motor cortex of a 9-wk-old C57BL/6 mouse. The results illustrated that the virus-expressed proteins were well preserved by FOCM.
Fig. 3.
Preservation after clearing. (A–E) The imaging of neurons in hippocampus from Thy1-GFP-M mice before (day 0) and after (day 11) clearing by LSCM scanning under the same imaging condition. (A) CLARITY treatment. (B) CUBIC treatment. (C) ScaleS treatment. (D) SeeDB treatment. (E) FOCM treatment. (F) Normalized fluorescence curve of comparison FOCM (n = 6) with CLARITY (n = 3), CUBIC (n = 3), ScaleS (n = 3), and SeeDB (n = 3). The data were shown as the mean ± SEM. Statistical significance (*P < 0.05) was assessed by one-way ANOVA followed by Bonferroni’s multiple comparison tests. (G–I) Comparison of signal position and fluorescence changes under the same imaging condition before and after FOCM clearing with G c-fos–labeled hippocampus, (H) DiO-labeled striatum and (I) AAV9-Syn-mCherry–labeled motor cortex from a 9-wk-old C57BL/6 mouse. (Scale bars E, 10 µm; G–I, 100 µm.)
Imaging Depth and Quality Improvements with FOCM.
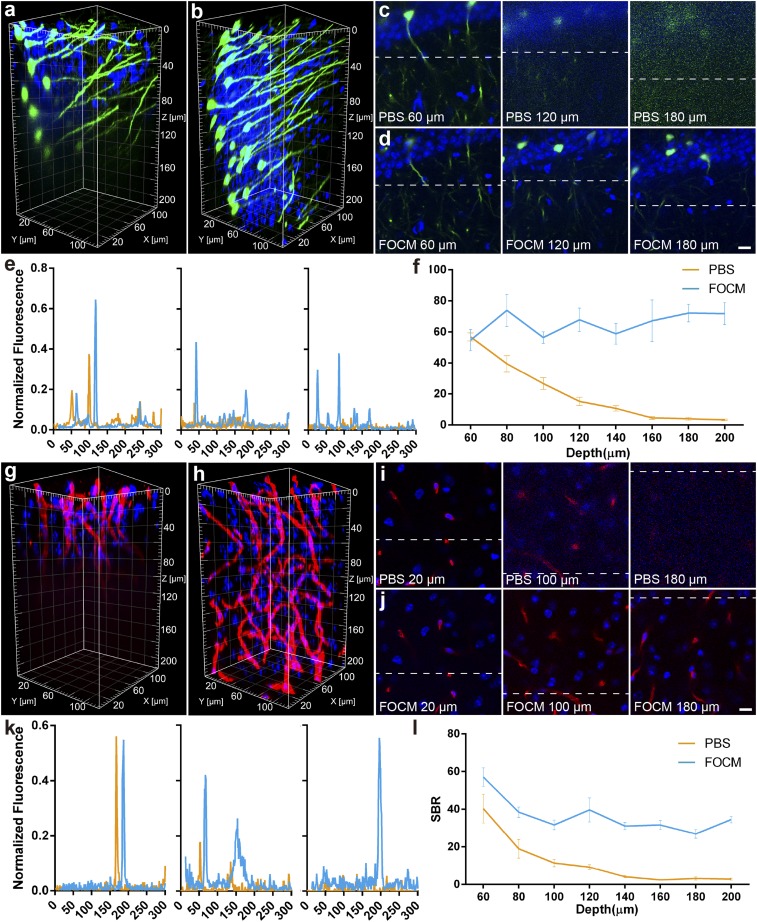
For FOCM achieving extremely fast optical clearing than other methods, we considered whether the short clearing process could improve the imaging quality in deep tissue. To examine its imaging capability, Thy1-GFP-M mice were imaged through the 200-µm-deep imaging volume with LSCM (Olympus BX61 with 40× UPLSAPO objective lens). Before FOCM clearing, the noise started to increase at the depth of 60 µm and details were severely lost at the depth of 120–200 µm in PBS. However, after FOCM clearing, all images through the whole volume remained details of dendrites and cell bodies (Fig. 4 A–E). The images calculation showed that before clearing, the signal-to-background ratio (SBR) declined rapidly from 56.9 ± 2.6 to 15.2 ± 2.7 at the depth of 60–120 µm. By contrast, the SBR maintained in 50–80 through the 200-µm volume after FOCM clearing (Fig. 4F). Besides, we also tested 200-µm-volume LSCM imaging of a mouse brain slice, which immunolabeled with collagen IV (Fig. 4 G–K). The variation of SBR in depth was consistent with the former that the SBR decreased from 40.4 ± 7.6 to 9.2 ± 1.2 at the depth of 60–120 µm in PBS, but remained at least 26.9 ± 2.2 at all depths after FOCM clearing (Fig. 4L). The above results show that FOCM can improve imaging depth nearly three times in LSCM with SBR increasing average 38.2 at the depth of 80 µm and deeper. In addition, FOCM is also compatible with two-photon microscopy (Olympus BX61 with 25× WMP2 XLPLN objective lens). The imaging depth is increased from 250 µm to 1,020 µm (SI Appendix, Fig. S4).
Fig. 4.
Fluorescence imaging quality improvement with the FOCM. (A and B) Three-dimensional reconstruction of Thy1-GFP-M mouse with DAPI staining before (A) and after (B) FOCM clearing. (C and D) Selected single imaging at the depth of 60 µm, 120 µm, and 180 µm before (C) and after (D) FOCM clearing. (E) Normalized fluorescence corresponding to the same dendrites indicated by the dash line in C and D. (F) SBR analysis from the depth of 60 µm to 200 µm. (G and H) Three-dimensional reconstruction of collagen with DAPI staining before (G) and after (H) FOCM clearing. (I and J) Selected single imaging at the depth of 20 µm, 100 µm, and 180 µm before (I) and after (J) FOCM clearing. (K) Normalized fluorescence corresponding to the same blood vessel indicated by the dash line in I and J. (L) SBR analysis from the depth of 60 µm to 200 µm. (Scale bars: 10 µm.)
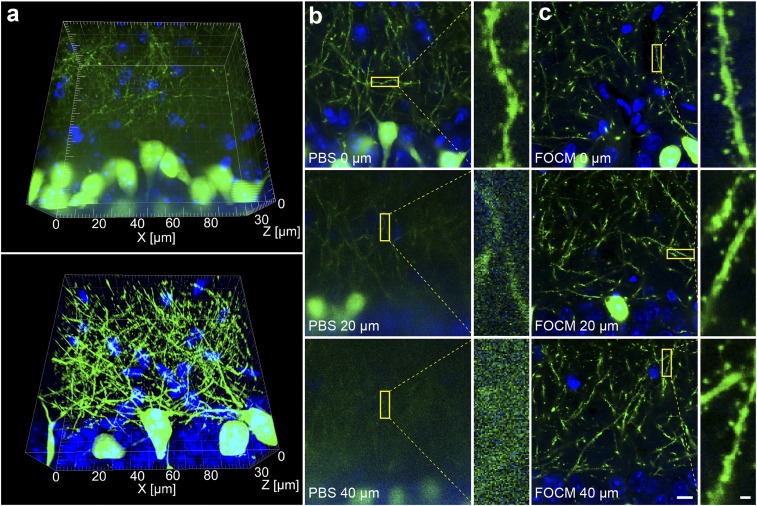
It should be mentioned that FOCM preserved the fine structures of samples while improving the imaging depth. The magnification images [Olympus, UPLSAPO 60×, numerical aperature (N.A.) 1.35, working distance (WD) 0.15 mm] provide the clear dendrites and synaptic buttons at the depth of 0, 20, and 40 µm after FOCM treatment, compared with the details losing at the depth of 20 and 40 µm before clearing (Fig. 5).
Fig. 5.
Fine neuronal structure preserving by FOCM. (A) Three-dimensional reconstruction of neuron dendrites before FOCM clearing (Upper) and after clearing (Lower). (B) Images of dendrites (Left) and synaptic buttons (Right) at the depth of 0, 20, and 40 μm before clearing. (C) Images of dendrites (Left) and synaptic buttons (Right) at the depth of 0, 20, and 40 μm after FOCM clearing. (Scale bars: C, Left, 10 μm; C, Right, 1 μm.)
Overall, our data demonstrated that FOCM fast clearing methods can significantly improve the imaging depth and quality with LSCM and two-photon microscopy.
Three-Dimensional Reconstruction of Neural Morphology with FOCM.
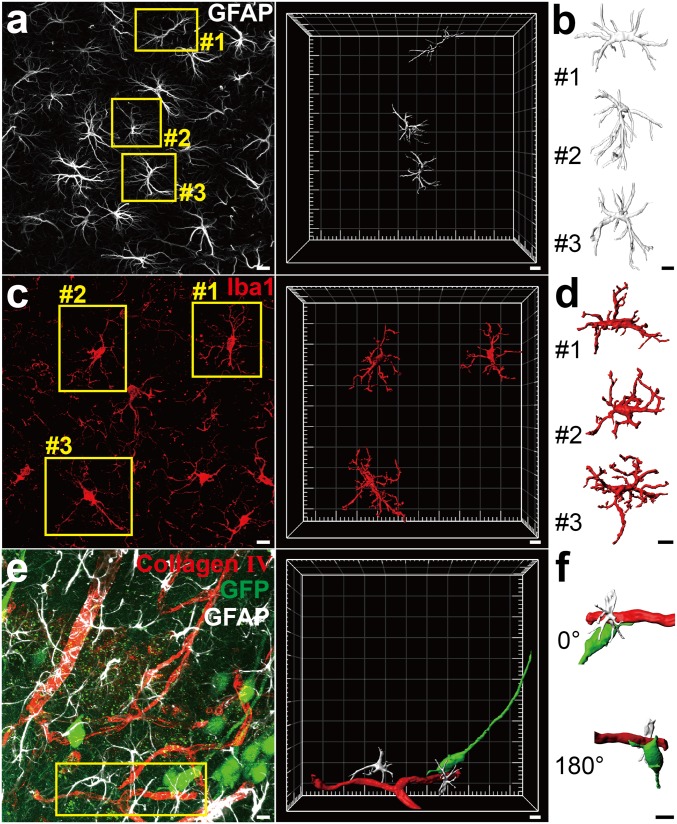
Realizing an efficient and fine reconstruction was one of the important applications of FOCM. To examine it, the adult C57BL/6 mouse slices were immunofluorescent labeled and treated with FOCM. After that, the 3D reconstruction of neuron cells including astrocytes and microglia were obtained through continuous z axis scanning with LSCM (Olympus FV1000 with 60× UPLSAPO objective lens) (Fig. 6 A–D) (Movies S2 and S3). Besides the single neuron cell reconstruction, we also carried out a triple labeling to the blood vessel, astrocyte, and neuron simultaneously. We first simulated the classical connection structures of soma, blood vessel, and astrocyte. In the reconstruction results, we found that the astrocytes connected the neuron cell with blood vessels as a bridge (Movie S4).
Fig. 6.
Three-dimensional visualization of nerve cells and connections after FOCM clearing. (A and B) Three-dimensional reconstructions showed labeling of astrocytes in C57BL/6 mouse slices (9 wk old). (A) Maximum intensity projection of the Z-positions with LSCM imaging and reconstruction of selected astrocytes in yellow boxes. (B) The detailed structure exhibition of astrocytes corresponding to the yellow boxes in A. (C and D) Labeled microglia in C57BL/6 mouse slices. (C) Maximum intensity projection of the Z-positions with LSCM imaging and reconstruction of selected microglia in yellow boxes. (D) The detailed structure exhibition of microglia corresponding to the yellow boxes in C. (E and F) Labeled blood vessel, astrocytes, neurons and their connections in Thy1-GFP-M mouse slices. (E) Maximum-intensity projection of the Z-positions with LSCM imaging and the reconstruction in selected region. Astrocytes are shown in silver, blood vessels are shown in red, and neurons are shown in green. (F) The detailed morphology exhibition of the connection corresponding to the yellow box in E. (Scale bars: 10 μm.)
Fluorescence Spatial Colocation Analysis with FOCM.
Fluorescence colocation (also called image merging) is a common imaging processing approach to examine whether the multifluorescence signals come from the same place, such as from the same cells in a small volume of tissue. However, the strong scattering of biological sample expands the focusing spot of excitation light in deep tissue and fluorophores above or below the focal plane will be excited as well. Thus, when we captured an image in a certain depth, the signals from two close cells might be recorded as from a single cell. In fact, the false-positive results may occur in every merging operation. To overcome this problem, we proposed the “fluorescence spatial colocation” achieved by FOCM to ensure the correctness of image merging.
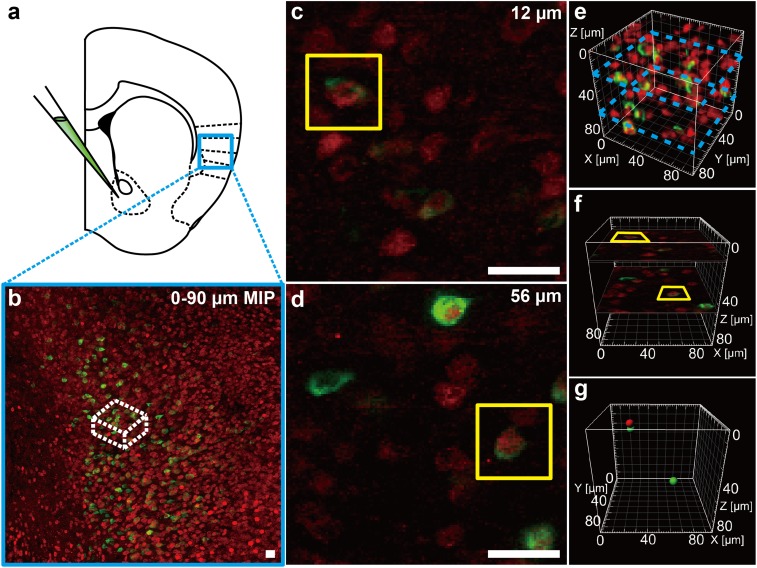
Previous studies showed that the insular cortex is the nucleus in reward pathway and it also can be activated by drug addiction and interoception (36–42). To set insular cortex as an instance of image merging, C57BL/6 mice were injected with B subunit of cholera toxin (CT-B) conjugated with Alexa Fluor 488 into the Nucleus Accumbens (NAc) (43–48). One week later, morphine was injected 2 h before the fixed slices were incubated with c-fos antibody following IgG conjugated to Cy3. Finally, we got the double-labeled imaging with green signals in cell membrane (CT-B) and red signals (c-fos) in soma. The two signals located at the same position represented the neuron both projected to NAc and responded to the stimulation (Fig. 7 A and B). After the fast clearing with FOCM, we examined the positions of the signals in different z axis. To set the example, we detected two colocated signals at the depth of 12 μm and 56 μm (Fig. 7 C and D). Normally, both the two merged signals in 2D images will be considered as positive results. However, as FOCM achieved a fast clearing and higher SBR images in depth, we were able to distinguish the accurate location of signals in time via 3D reconstructions (Fig. 7E). According to the size of signal spots, we set the estimated soma diameter as 8 µm. When two reconstructed signal models blend with each other (signal distance is less than 8 µm in 3D space), we consider the two signals labeled the same cell. Through the reconstruction results, we found that the image at the depth of 12 μm seemed to merge together, yet their spatial positions were separated. However, the signals located at the depth of 56 μm, whose spatial positions were bound together, represented a truly colocation (Fig. 7 F and G). Therefore, nontoxic ultrafast FOCM processing with 3D reconstructions can provide a simple way to reduce errors in image merging.
Fig. 7.
FOCM realized a fast-imaging spatial merging. (A) Experimental design for CT-B injection at NAc in C57BL/6 mouse (9 wk old) slices. (B) Maximum intensity projection (MIP) in insular cortex. (C and D) Selected single imaging at depth of 12 µm (C) and 56 µm (D) in white box in B. (E) Three-dimensional reconstruction of the white region in B. Blue dash boxes correspond to C and E. (F) Specific position of C and D in reconstruction results. (G) Specific position of cell body model corresponding to the cell in yellow boxes in C and D. Red represents c-fos–positive cell and green represents CT-B–positive cell. (Scale bars: 20 µm.)
Quantity Diversity of Neuronal Activity in PVH.
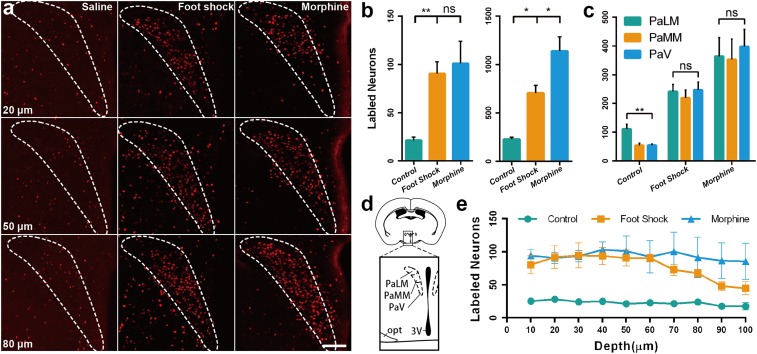
The paraventricular nucleus of the hypothalamus (PVH) is a hypothalamic nucleus lying adjacent to the third ventricle that can be activated by a variety of stressful and physiological changes (49, 50). It controls the hypothalamic-pituitary-adrenal (HPA) axis and glucocorticoid release (Fig. 8D). The published data showed that the signals distribution patterns of c-fos in 2D images under the stimulation of morphine and foot shock had no significant difference (51). However, counting signals in 2D images might lose much information at the edge of each slice. Through 3D fluorescence reconstructions with FOCM, we were able to acquire a more complete signal distribution in a certain area. To set an example, the brain sectioned slices were incubated in c-fos antibody following IgG conjugated to Cy3. With FOCM clearing, the distribution of the c-fos signals in a 100-μm-thick brain slice was obtained (Fig. 8A). As the 3D signal imaging comprehensively contained the information of cell distributions, we examined whether there is a difference between conventional single imaging calculation and 3D imaging calculation. In active neurons counting, the representative images were selected to count the labeled cells number as single imaging calculation. The results showed 90.5 ± 12.2 active cells with foot shock and 101.0 ± 22.9 with morphine injection, which was no significant difference. However, when calculated with 3D imaging, there were 706.5 ± 78.2 active cells with foot shock and 1,139.0 ± 146.7 with morphine injection. The results indicate a significant difference between the two stimulations, which is different with the previous study (51) (Fig. 8B). Besides, the number of active neurons in subregions of PVH were also calculated. The results show that in control group, 111.0 ± 14.4 active neurons in PaLM (paraventricular hypothalamic nucleus, lateral magnocelluar part), which was significantly different with 54.0 ± 6.8 in PaMM (paraventricular hypothalamic nucleus, medial magnocellular part) and 54.4 ± 3.7 in PaV (paraventricular hypothalamic nucleus, ventral part). However, in foot shock group and morphine group, no significant difference was found between the subregions of PVH (Fig. 8C). Furthermore, we present the distribution of the active neurons at various depths with continuous imaging (Fig. 8E). These results confirm that FOCM with simple protocols and ultrafast optical clearing capability can effectively help the scientists to obtain more reliable and convincing statistical results.
Fig. 8.
FOCM realized a spatial signals statistics analysis in PVH under the stimulation of foot shock and morphine injection with C57BL/6 mouse slices (9 wk old). (A) Comparison of c-fos signal spatial distribution at the depth of 20 μm, 50 μm, and 80 μm under the stimulation of saline injection (Left), foot shock (Center), and morphine injection (Right) after the FOCM treatment. (B) The number of active neurons in PVH in single image counting (Left) and 3D counting through 100 μm depth (Right) under different stimulations. (C) The subregional active neurons in PVH through 100 μm depth under different stimulations. (D) Schematic illustrating the location of PVH and the subregion of PaLM, PaMM, PaV. (E) The number of active neurons in PVH at different depth under the different stimulation. Error bars represent the mean ± SEM control group (n = 6), Foot shock and morphine group (n = 4) and statistical significance (ns, no significance; *P < 0.05, **P < 0.01) was examined by one-way ANOVA followed by Bonferroni’s multiple comparison tests. (Scale bars: 100 μm.)
Discussion
We developed FOCM, a DMSO-based ultrafast optical clearing method that contained urea, sorbitol, and glycerol and was compatible with various labeling methods. The advantages of FOCM include ultrafast processing speed, nontoxicity, well-preserved fluorescence signals, little distortion, and simple protocol and common reagents.
It should be mentioned that different clearing methods have their specific aims and application fields. For example, CLARITY and CUBIC aim at whole organ/body clearing with very efficient transparent quality, while FOCM aims at ultrafast tissue slices clearing with high fluorescent preservation and simple protocol. Besides, with the advantages of nontoxicity and simple and ultrafast processing with less fluorescence quenching, FOCM has the potential to be a regularly used imaging step. Although the solvent-based clearing methods and ScaleSQ are also efficient clearing methods, considering the ability of morphology and fluorescence preservation, we did not compare them with FOCM.
Different with the previous studies (32), such as ScaleS, which listed DMSO as a RI matching reagent, it acts as a water-miscible polar solvent in FOCM. The results (Fig. 1A) demonstrate that the clearing efficiency with DMSO as solvent (FOCM) is much higher than that with DMSO as RI matching reagent (ScaleS) for 300-µm-thick brain slices. Besides, through combining “dehydration of water-miscible polar solvent” and “hydration of urea,” we can counter the tissue shrinkage caused by organic solvent-based clearing methods and the tissue expansion caused by hyperhydration methods (Fig. 2A).
The advantages of speedy clearing, nontoxicity, good fluorescence preservation, little distortion, and simple protocol by FOCM may have huge impact and the potential to solve some specific problems include emergent clinical diagnosis and high-throughput analysis of connectome, providing an alternative to those who expect speedy clearing. We believe that FOCM can be very helpful not only for the specific issues addressed above, but also for general problems to improve the processing efficiency.
Materials and Methods
Mice.
All animal studies were approved by Animal Advisory Committee at Zhejiang University and the National Institutes of Health's Guidelines for the Care and Use of Laboratory Animals. Adult male and female mice C57BL/6 and Thy1-GFP-M mice were used in the development of optical clearing method and imaging processing. All mice were reserved in stable condition of temperature (25 °C) and humidity (60%), with a 12-h light/dark cycle (9:00 AM to 9:00 PM) and unlimited access to food and water.
Mouse Brain Samples.
Mice were rapidly anesthetized with chloral hydrate [5%, wt/vol, 0.1 mL/10 g, intraperitoneal (i.p.)] and transcardially perfused with ice-cold 0.01 M PBS (Solarbio) and paraformaldehyde (4% in PBS wt/vol, Sinopharm Chemical Reagent Co., Ltd). Brain tissues were collected and incubated in the same paraformaldehyde solution at 4 °C for 24–48 h for uniform fixation through the sample. After fixation, the tissue was washed in 0.01 M PBS at room temperature for 6–12 h for whole brain or hemibrain. To remove the water remaining in the brain tissue, the sample was incubated in sucrose [30% (wt/vol) in PBS] at 4 °C for 24–48 h until the specimen sinked to the bottom of tube. After that, 300-µm-thick brain slices were sectioned using a cryostat (CM3050S, Leica). Sections were immediately started for immunostaining or stored at −20 °C in antifreeze solution (mixture of same volume of glycerol and 0.01 M PBS) for a month for further experiment.
FOCM Reagents Preparing.
For whole organ or hemibrain optical clearing, FOCM reagent was prepared as 20% (wt/vol) urea (Vetec, V900119), 30% (wt/vol) d-sorbitol (Vetec, V900390), and 5% (wt/vol) glycerol (Vetec, V900122) dissolved in DMSO (Vetec, V900090). For brain sections optical clearing, FOCM reagent was prepared as 30% (wt/vol) urea, 20% (wt/vol) d-sorbitol, and 5% (wt/vol) glycerol dissolved in DMSO. When preparing the reagent, urea and d-sorbitol were dissolved in DMSO and stirred at room temperature (25 °C) overnight. After complete dissolution, glycerol was added and stirred further. The reagents can be stored at room temperature for several months and shaken gently before use.
Tissue Optical Clearing.
For tissue sections clearing, after washing and labeling samples, PBST (0.01 M PBS with 0.1% Triton X-100) should be sopped up by KimWipes. Incubated samples in FOCM for 1–5 min (depending on the thick of slices) with gently shaken at room temperature in dishes. After FOCM clearing, the sample should be mounted immediately to isolate air. For whole organ or hemibrain clearing, incubate samples in FOCM for 3 d at 25 °C and 65 rpm in 50-mL glass centrifuge tubes with 30 mL of reagent. However, we recommend 20- to 300-µm slices clearing rather than a block of tissues.
Mounting Processing.
To mount brain slices, stainless steel square holder (25 × 25 mm with a 10 × 8 mm hole) with appropriate thickness was glued to a glass coverslip (25 × 50 mm). The holder was filled with FOCM reagent and placed the clearing tissue into the holder. Another glass coverslip (23 × 23 mm) was covered on the holder to block the tissue from the air (SI Appendix, Fig. S5).
Tissue Optical Clearing with Other Clearing Methods.
The clearing methods including CLARITY, CUBIC, ScaleS, and SeeDB (Figs. 1–3) followed the protocol as below. Considering 300-μm-thick slices clearing, the incubation time of every method was reduced accordingly.
CLARITY.
Hydrogel monomers (HM) solution [4% (wt/vol) acrylamide, 0.05% (wt/vol) bisacrylamide, 4% (wt/vol) paraformaldehyde (PFA), and 0.25% (wt/vol) VA-004 in PBS] was prepared for tissue incubation. Brain slices were embedded at 37 °C for 2.5 h until the hydrogel was solid. Sodium dodecyl sulfate (SDS) buffer was prepared freshly by diluting 20% (wt/vol) SDS and 1 M boric acid buffer fivefold in distilled water. Through passive CLARITY clearing, the slices were washed with SDS buffer with gentle shaking at 7 °C for around 12 h until the samples were transparentized. The brain slice was kept in 85% (vol/vol) glycerol at room temperature (21).
CUBIC.
ScaleCUBIC Reagent-1A [10% (wt/wt) urea, 5% (wt/wt) N,N,N′,N′-Tetrakis (2-hydroxypropyl) ethylenediamine and 10% (wt/wt) Triton X-100 were mixed and added 1/200 volume of 5 M NaCl] and ScaleCUBIC Reagent-2 [50% (wt/wt) sucrose, 25% (wt/wt) urea, and 10% (wt/wt) triethanolamine in water] was prepared for tissue clearing. Brain slices were incubated in ScaleCUBIC Reagent-1A for 1 h at 37 °C with gentle shaking followed by PBS washing for 30 min at room temperature. After PBS clearing, the slices were incubated for 30 min at room temperature and stored in ScaleCUBIC Reagent-2 (30) (http://cubic.riken.jp).
ScaleS.
ScaleS0 [20% (wt/vol) sorbitol, 5% (wt/vol) glycerol, 1 mM methyl-β-cyclodextrin, 1 mM γ-cyclodextrin, 1% (wt/vol) N-acetyl-l-hydroxyproline, 3% (vol/vol) DMSO were mixed with PBS], ScaleS1 [20% (wt/vol) sorbitol, 5% (wt/vol) glycerol, 4 M urea, and 0.2% (wt/vol) Triton X-100 were mixed with water], ScaleS2 [27% (wt/vol) sorbitol, 2.7 M urea, 0.1% (wt/vol) Triton X-100, and 8.3% (vol/vol) DMSO were mixed with water], ScaleS3 [36.4% (wt/vol) sorbitol, 2.7 M urea, and 9.1% (vol/vol) DMSO were mixed with water], ScaleS4 [40% (wt/vol) sorbitol, 10% (wt/vol) glycerol, 4 M urea, 0.2% (wt/vol) Triton X-100, and 20% (vol/vol) DMSO were mixed with water] was prepared for tissue clearing. Brain slices were successively incubated in ScaleS0, ScaleS1, ScaleS2, and ScaleS3 at 37 °C for 30 min in every procedure. Then samples were washed with PBS at 4 °C for 30 min. After that, slices were treated for 30 min at 37 °C with ScaleS4 and stored in ScaleS4 at room temperature (29).
SeeDB.
Standard SeeDB [20%, 40%, 60%, 80%, 100% (wt/vol), and 80.2% (wt/wt) fructose solution] was prepared for tissue clearing. Brain slices were successively incubated in 20%, 40%, 60%, 80%, 100% (wt/vol) fructose solution at 25 °C for 30 min in every procedure. Afterward, clearing slices were kept in 80.2% (wt/wt) fructose solution at room temperature (18).
Antibodies Selection.
Primary antibodies: rabbit polyclonal antibody to CollagenIV (Abcam, ab6586) for labeling cerebrovascular at the concentration of 1:250; chicken polyclonal antibody to GFAP (Abcam, ab4674) for labeling astrocytes at the concentration of 1:250; rabbit polyclonal antibody to GFAP (Boster, PB0046) for labeling astrocytes at the concentration of 1:200; rabbit polyclonal antibody to Iba1 (Wako, 019–19741) for labeling microglia at the concentration of 1:500; and rabbit polyclonal antibody to c-fos (SYSY, 226003) for labeling c-fos protein at the concentration of 1:2,000.
Secondary antibodies: goat anti-rabbit IgG (H + L) highly cross-absorbed secondary antibody, Alexa Fluor 488 (Thermo Fisher Scientific, A11034); goat anti-rabbit IgG (H + L) highly cross-absorbed secondary antibody, Alexa Fluor Plus 555 (Thermo Fisher Scientific, A32732); and goat anti-chicken IgY (H + L) cross-absorbed secondary antibody, Alexa Fluor 633 (Thermo Fisher Scientific, A21103).
Immunostaining of Mouse Brain Slices.
Took brain sections out of the antifreeze solution and washed slices with PBST three times at 25 °C and 65 rpm in a shaker (each time lasted for 1 h). Incubated in primary antibody/PBST solution for 48 h at 25 °C and 65 rpm in a shaker. The primary antibody then was washed off with PBST three times in the same condition. Incubated in secondary antibody/PBST solution for 24 h at 25 °C and 65 rpm. The secondary antibody then was washed off with PBST three times in same condition.
Membrane Labeling of Mouse Brain Slices.
One milligram of DiO (Beyotime, C1038) powder was dissolved in 1 mL of anhydrous ethanol with heating and ultrasonic disruption. For brain sections, samples were washed with PBST three times at 25 °C and 65 rpm in a shaker (each time lasted for 1 h). Incubated sections in 500 µL of PBST with 2.5 µL of DiO solution at 25 °C and 65 rpm in a shaker for 24 h. Samples then were washed with PBST three times in the same condition.
CT-B Injection.
C57BL/6 adult mice were deeply anesthetized and fixed in the stereotaxic. An electrode containing 300 nL of cholera toxin subunit b, Alexa Fluor 488 conjugate (CT-B, 1 mg/mL, Thermo Fisher Scientific, C22841) was implanted into unilateral NAc (left hemisphere, 1.5 mm lateral to the sagittal sinus, 1.42 mm bregma, 4.4 mm depth) and injected all volume of CT-B. The mouse was killed for further experiment after recovering for 2 wk.
Drugs and Foot Shocks Treatments.
Morphine-HCl (15 mg/kg, i.p., Shenyang Pharmaceutical) was dissolved in 0.9% NaCl (wt/vol, saline). For foot shocks treatments, 15 randomly arranged foot shocks (1 mA, 2 s) were administrated on mice within 10 min in a fear conditioning chamber.
Laser Scanning Confocal Microscopy.
Confocal images were taken using an inverted confocal microscope FV1000 (Olympus) under the control of Olympus Fluoview FV1000 version 2.1b software. In FV1000, we used He-Ne (543.5 nm) and laser diode (473 and 635 nm) laser lines. A 10× air objective lens (Olympus, UPLSAPO 10×, N.A. 0.4, WD 3.1 mm), a 20× air objective lens (Olympus, UPLSAPO 20×, N.A. 0.75, WD 0.6 mm), a 40× air objective lens (Olympus, UPLSAPO 40×, N.A. 0.95, WD 0.18 mm), and a 60× oil objective lens (Olympus, UPLSAPO 60×, N.A. 1.35, WD 0.15 mm) were used to acquire all fluorescent images. For maximum intensity projection, we set the imaging interval in z axis as the half of z axis resolution of different objectives (4.22 µm per slice for 10× objective, 1.09 µm per slice for 20× objective, and 0.48 µm per slice for 60× objective).
Two-Photon Excitation Microscopy.
Two-photon images were taken using an upright two-photon excitation microscopy FV1200MPE (Olympus). In FV1000MPE, we used MaiTai at 920 nm for two-photon excitation. A 40× water objective (Olympus, LUMPLFLN, numerical aperture = 0.8, working distance = 3.3 mm) was used to acquire all fluorescent images.
Imaging Processing.
For image enhancement, the image (Fig. 6C) were imported into Matlab and transformed to gray images. To enhance the contrast between the signals and noise, the distribution of gray value was adjusted. We removed the noise by median filter and then images are transformed to binary. The objects, which occupy an area smaller than 30 pixels, were removed by erosion morphological operation and the binary image was multiplied by gray image and got the processed images. Finally, maximum intensity projection was applied to all sequenced processed images in ImageJ.
Three-dimensional reconstruction images (Figs. 4 A, B, G, and H, 5A, 6, and 7 E–G) were performed by using IMARIS (bitplane). For the cell segmentation and reconstruction in Fig. 6, the surfaces function was used at the region containing the cell with well-preserved morphology. For the cell location reconstruction in Fig. 7G, the spots function was applied at the region with targeted cells. We set soma diameter as 8 μm to estimate the location of each cell. For the c-fos signal calculation in Fig. 8, the spots function was also used at the region of PVH, PaLM, PaMM, and PaV. We set soma diameter as 10 μm to detect the amount of c-fos signals automatically.
Quantification of Fluorescence Intensities.
For normalized fluorescence quenching analysis (Fig. 3F), peak values of neuron bodies (n = 3–6) at the same position from day 0 to day 11 were recorded. After the subtraction of background values, all signal values were normalized and plotted on the line diagram.
For SBR calculation (Fig. 4), a certain area of the image was selected. Pixels belonging to specific signals were recorded while pixels belonging to specific background were also recorded. Then, we calculated the SBR as the average value of recorded signal pixels divided by the average value of background pixels. Raw images were processed by ImageJ, and the selected background areas were adjacent to signal areas. The signal intensity distribution analysis was executed by Matlab. In each image, we chose a line across the background to signal land and each value represented the fluorescent intensity of every pixel in the line.
Statistical Analysis.
Data were presented as mean ± SEM in all figures. For comparison of sample size changes (Fig. 2B), fluorescence quenching (Fig. 3F), and the statistical results of the number of active neurons in PVH (Fig. 8C), analysis of one-way ANOVA was used. After the ANOVA was significant, the Bonferroni’s multiple comparison test was used. For SBR analysis in different imaging depth, the multiple t test was used.
Supplementary Material
Acknowledgments
We thank Dan Zhu and Tingting Yu (Huazhong University of Science and Technology) for providing mice; Hanry Yu (Mechanobiology Institute, National University of Singapore) for the critical discussion; Hailan Hu and Jihua Wang (Zhejiang University) for providing morphine; Zhongya Wei (Zhejiang University) for providing antibodies information; Mengyang Gu for the useful discussion; Sanhua Fang and Qiaoling Ding (Core Facilities of Zhejiang University Institute of Neuroscience for technical assistance) for guidance to imaging systems; Shuangshuang Liu and Junli Xuan (Imaging Facility, Core Facilities, Zhejiang University School of Medicine) for imaging technical assistance. This work was supported by National Basic Research Program of China (973 Program) Grant 2015CB352005; National Natural Science Foundation of China Grants 61735016, 81771877, and 31571110; Natural Science Foundation of Zhejiang Province Grant LZ17F050001; and the Fundamental Research Funds for the Central Universities.
Footnotes
The authors declare no conflict of interest.
This article is a PNAS Direct Submission.
This article contains supporting information online at www.pnas.org/lookup/suppl/doi:10.1073/pnas.1819583116/-/DCSupplemental.
References
- 1.Ouzounov D. G., et al. , In vivo three-photon imaging of activity of GCaMP6-labeled neurons deep in intact mouse brain. Nat. Methods 14, 388–390 (2017). [DOI] [PMC free article] [PubMed] [Google Scholar]
- 2.Shemesh O. A., et al. , Temporally Precise Single-Cell-Resolution Optogenetics (Nature Publishing Group, 2017). [DOI] [PMC free article] [PubMed] [Google Scholar]
- 3.Yang W., Yuste R., In vivo imaging of neural activity. Nat. Methods 14, 349–359 (2017). [DOI] [PMC free article] [PubMed] [Google Scholar]
- 4.Booth M. J., Neil M. A., Juskaitis R., Wilson T., Adaptive aberration correction in a confocal microscope. Proc. Natl. Acad. Sci. U.S.A. 99, 5788–5792 (2002). [DOI] [PMC free article] [PubMed] [Google Scholar]
- 5.Popoff S., Lerosey G., Fink M., Boccara A. C., Gigan S., Image transmission through an opaque material. Nat. Commun. 1, 81 (2010). [DOI] [PubMed] [Google Scholar]
- 6.Vargas G., Chan K. F., Thomsen S. L., Welch A. J., Use of osmotically active agents to alter optical properties of tissue: Effects on the detected fluorescence signal measured through skin. Lasers Surg. Med. 29, 213–220 (2001). [DOI] [PubMed] [Google Scholar]
- 7.Li A., et al. , Micro-optical sectioning tomography to obtain a high-resolution atlas of the mouse brain. Science 330, 1404–1408 (2010). [DOI] [PubMed] [Google Scholar]
- 8.Gong H., et al. , High-throughput dual-colour precision imaging for brain-wide connectome with cytoarchitectonic landmarks at the cellular level. Nat. Commun. 7, 12142 (2016). [DOI] [PMC free article] [PubMed] [Google Scholar]
- 9.Liu Y., et al. , Optical focusing deep inside dynamic scattering media with near-infrared time-reversed ultrasonically encoded (TRUE) light. Nat. Commun. 6, 5904 (2015). [DOI] [PMC free article] [PubMed] [Google Scholar]
- 10.Si K., Fiolka R., Cui M., Fluorescence imaging beyond the ballistic regime by ultrasound pulse guided digital phase conjugation. Nat. Photonics 6, 657–661 (2012). [DOI] [PMC free article] [PubMed] [Google Scholar]
- 11.Si K., Fiolka R., Cui M., Breaking the spatial resolution barrier via iterative sound-light interaction in deep tissue microscopy. Sci. Rep. 2, 748 (2012). [DOI] [PMC free article] [PubMed] [Google Scholar]
- 12.Wang Y. M., Judkewitz B., Dimarzio C. A., Yang C., Deep-tissue focal fluorescence imaging with digitally time-reversed ultrasound-encoded light. Nat. Commun. 3, 928 (2012). [DOI] [PMC free article] [PubMed] [Google Scholar]
- 13.Wang J. T., et al. , Regulation of RNA granule dynamics by phosphorylation of serine-rich, intrinsically disordered proteins in C. elegans. eLife 3, e04591 (2014). [DOI] [PMC free article] [PubMed] [Google Scholar]
- 14.Wang K., et al. , Direct wavefront sensing for high-resolution in vivo imaging in scattering tissue. Nat. Commun. 6, 7276 (2015). [DOI] [PMC free article] [PubMed] [Google Scholar]
- 15.Park J. H., Kong L., Zhou Y., Cui M., Large-field-of-view imaging by multi-pupil adaptive optics. Nat. Methods 14, 581–583 (2017). [DOI] [PMC free article] [PubMed] [Google Scholar]
- 16.Ke M. T., Fujimoto S., Imai T., SeeDB: A simple and morphology-preserving optical clearing agent for neuronal circuit reconstruction. Nat. Neurosci. 16, 1154–1161 (2013). [DOI] [PubMed] [Google Scholar]
- 17.Ke M. T., et al. , Super-resolution mapping of neuronal circuitry with an index-optimized clearing agent. Cell Rep. 14, 2718–2732 (2016). [DOI] [PubMed] [Google Scholar]
- 18.Ke M. T., et al. , Optical clearing of fixed brain samples using SeeDB. Curr. Protoc. Neurosci. 66, 2.22.1–2.22.19 (2014). [DOI] [PubMed] [Google Scholar]
- 19.Kuwajima T., et al. , ClearT: A detergent- and solvent-free clearing method for neuronal and non-neuronal tissue. Development 140, 1364–1368 (2013). [DOI] [PMC free article] [PubMed] [Google Scholar]
- 20.Greenbaum A., et al. , Bone CLARITY: Clearing, imaging, and computational analysis of osteoprogenitors within intact bone marrow. Sci. Transl. Med. 9, eaah6518 (2017). [DOI] [PubMed] [Google Scholar]
- 21.Tomer R., Ye L., Hsueh B., Deisseroth K., Advanced CLARITY for rapid and high-resolution imaging of intact tissues. Nat. Protoc. 9, 1682–1697 (2014). [DOI] [PMC free article] [PubMed] [Google Scholar]
- 22.Chung K., et al. , Structural and molecular interrogation of intact biological systems. Nature 497, 332–337 (2013). [DOI] [PMC free article] [PubMed] [Google Scholar]
- 23.Yang B., et al. , Single-cell phenotyping within transparent intact tissue through whole-body clearing. Cell 158, 945–958 (2014). [DOI] [PMC free article] [PubMed] [Google Scholar]
- 24.Ertürk A., et al. , Three-dimensional imaging of solvent-cleared organs using 3DISCO. Nat. Protoc. 7, 1983–1995 (2012). [DOI] [PubMed] [Google Scholar]
- 25.Renier N., et al. , iDISCO: A simple, rapid method to immunolabel large tissue samples for volume imaging. Cell 159, 896–910 (2014). [DOI] [PubMed] [Google Scholar]
- 26.Pan C., et al. , Shrinkage-mediated imaging of entire organs and organisms using uDISCO. Nat. Methods 13, 859–867 (2016). [DOI] [PubMed] [Google Scholar]
- 27.Qi Y., et al. , FDISCO: Advanced solvent-based clearing method for imaging whole organs. Sci. Adv. 5, 1 (2019). [DOI] [PMC free article] [PubMed] [Google Scholar]
- 28.Hama H., et al. , Scale: A chemical approach for fluorescence imaging and reconstruction of transparent mouse brain. Nat. Neurosci. 14, 1481–1488 (2011). [DOI] [PubMed] [Google Scholar]
- 29.Hama H., et al. , ScaleS: An optical clearing palette for biological imaging. Nat. Neurosci. 18, 1518–1529 (2015). [DOI] [PubMed] [Google Scholar]
- 30.Susaki E. A., et al. , Advanced CUBIC protocols for whole-brain and whole-body clearing and imaging. Nat. Protoc. 10, 1709–1727 (2015). [DOI] [PubMed] [Google Scholar]
- 31.Susaki E. A., et al. , Whole-brain imaging with single-cell resolution using chemical cocktails and computational analysis. Cell 157, 726–739 (2014). [DOI] [PubMed] [Google Scholar]
- 32.Tainaka K., Kuno A., Kubota S. I., Murakami T., Ueda H. R., Chemical principles in tissue clearing and staining protocols for whole-body cell profiling. Annu. Rev. Cell Dev. Biol. 32, 713–741 (2016). [DOI] [PubMed] [Google Scholar]
- 33.Susaki E. A., Ueda H. R., Whole-body and whole-organ clearing and imaging techniques with single-cell resolution: Toward organism-level systems Biology in mammals. Cell Chem. Biol. 23, 137–157 (2016). [DOI] [PubMed] [Google Scholar]
- 34.Tuchin V. V., et al. , “Optics of living tissues with controlled scattering properties” in Proceedings of the 1999 International Conference on Biomedical Optics (Bmo’99), (Society of Photo-Optical Instrumentation Engineers, Wuhan, China, 1999), pp 10–21.
- 35.Lai H. M., Ng W. L., Gentleman S. M., Wu W., Chemical probes for visualizing intact animal and human brain tissue. Cell Chem. Biol. 24, 659–672 (2017). [DOI] [PubMed] [Google Scholar]
- 36.Contreras M., Ceric F., Torrealba F., Inactivation of the interoceptive insula disrupts drug craving and malaise induced by lithium. Science 318, 655–658 (2007). [DOI] [PubMed] [Google Scholar]
- 37.Craig A. D. How do you feel–Now? The anterior insula and human awareness. Nat. Rev. Neurosci. 10, 59–70 (2009). [DOI] [PubMed] [Google Scholar]
- 38.Gaznick N., Tranel D., McNutt A., Bechara A., Basal ganglia plus insula damage yields stronger disruption of smoking addiction than basal ganglia damage alone. Nicotine Tob. Res. 16, 445–453 (2014). [DOI] [PMC free article] [PubMed] [Google Scholar]
- 39.Naqvi N. H., Rudrauf D., Damasio H., Bechara A., Damage to the insula disrupts addiction to cigarette smoking. Science 315, 531–534 (2007). [DOI] [PMC free article] [PubMed] [Google Scholar]
- 40.Suñer-Soler R., et al. , Smoking cessation 1 year poststroke and damage to the insular cortex. Stroke 43, 131–136 (2012). [DOI] [PubMed] [Google Scholar]
- 41.Vorel S. R., Bisaga A., McKhann G., Kleber H. D., Insula damage and quitting smoking. Science 317, 318–319; author reply 318–319 (2007). [DOI] [PubMed] [Google Scholar]
- 42.Zubieta J. K., et al. , Placebo effects mediated by endogenous opioid activity on mu-opioid receptors. J. Neurosci. 25, 7754–7762 (2005). [DOI] [PMC free article] [PubMed] [Google Scholar]
- 43.Saddoris M. P., Cacciapaglia F., Wightman R. M., Carelli R. M., Differential dopamine release dynamics in the nucleus accumbens core and shell reveal complementary signals for error prediction and incentive motivation. J. Neurosci. 35, 11572–11582 (2015). [DOI] [PMC free article] [PubMed] [Google Scholar]
- 44.Berridge K. C., Kringelbach M. L., Pleasure systems in the brain. Neuron 86, 646–664 (2015). [DOI] [PMC free article] [PubMed] [Google Scholar]
- 45.Baliki M. N., et al. , Parceling human accumbens into putative core and shell dissociates encoding of values for reward and pain. J. Neurosci. 33, 16383–16393 (2013). [DOI] [PMC free article] [PubMed] [Google Scholar]
- 46.Costa V. D., Lang P. J., Sabatinelli D., Versace F., Bradley M. M., Emotional imagery: Assessing pleasure and arousal in the brain’s reward circuitry. Hum. Brain Mapp. 31, 1446–1457 (2010). [DOI] [PMC free article] [PubMed] [Google Scholar]
- 47.Sabatinelli D., Bradley M. M., Lang P. J., Costa V. D., Versace F., Pleasure rather than salience activates human nucleus accumbens and medial prefrontal cortex. J. Neurophysiol. 98, 1374–1379 (2007). [DOI] [PubMed] [Google Scholar]
- 48.Aharon I., et al. , Beautiful faces have variable reward value: fMRI and behavioral evidence. Neuron 32, 537–551 (2001). [DOI] [PubMed] [Google Scholar]
- 49.Sawchenko P. E., Li H. Y., Ericsson A., Circuits and mechanisms governing hypothalamic responses to stress: A tale of two paradigms. Prog. Brain Res. 122, 61–78 (2000). [DOI] [PubMed] [Google Scholar]
- 50.Li H. Y., Sawchenko P. E., Hypothalamic effector neurons and extended circuitries activated in “neurogenic” stress: A comparison of footshock effects exerted acutely, chronically, and in animals with controlled glucocorticoid levels. J. Comp. Neurol. 393, 244–266 (1998). [PubMed] [Google Scholar]
- 51.Xiu J., et al. , Visualizing an emotional valence map in the limbic forebrain by TAI-FISH. Nat. Neurosci. 17, 1552–1559 (2014). [DOI] [PubMed] [Google Scholar]
Associated Data
This section collects any data citations, data availability statements, or supplementary materials included in this article.


