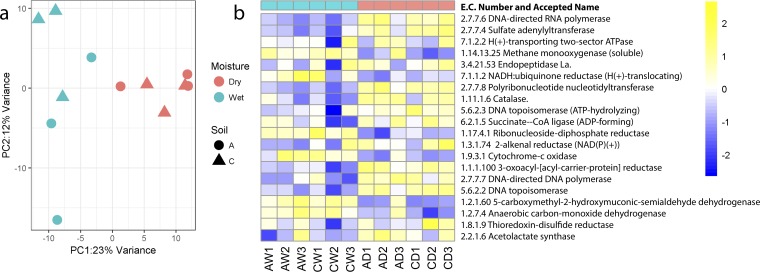
FIG 2.
Response of soil metatranscriptome to moisture perturbations. (a) Metatranscriptome data shown as a PCoA ordination of Bray-Curtis dissimilarities of sequence data categorized by function, i.e., Enzyme Commission (EC) number. Site (A, circles; C, triangles) and treatment (blue, wet; red, dry). All sequence count data were normalized to the upper 75th quantile. (b) Heat map showing the top 20 most abundant transcripts (ECs) observed under dry relative to wet conditions. The x axis indicates soil sample (A or C), treatment (W, wet; D, dry), and replicate (1, 2, or 3). Moisture conditions are indicated by the header row in blue (wet) or red (dry). The color gradient for each cell is scaled to a log2 fold change of −2 to 2.

