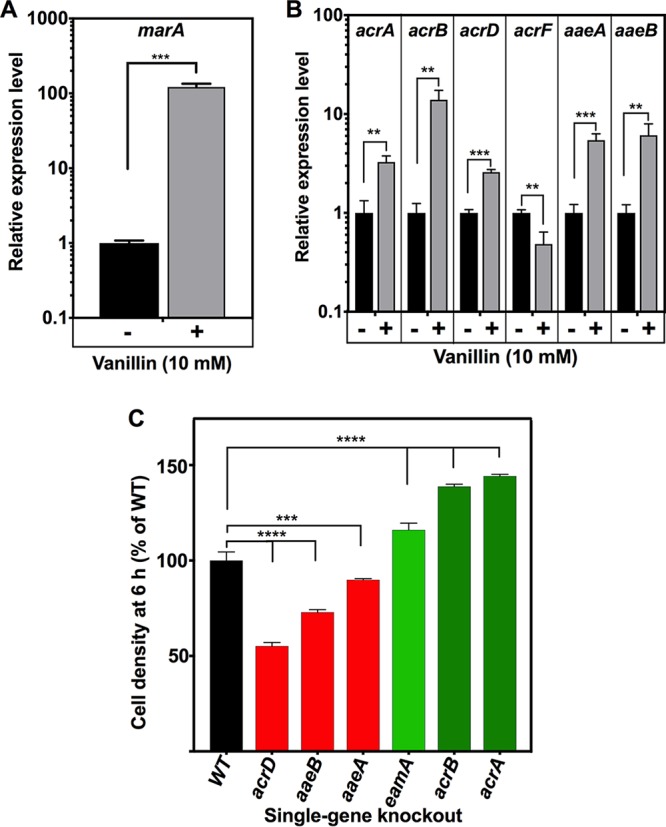
FIG 8.

Gene expression and mutant phenotypes for genes encoding potential vanillin efflux systems. In (A and B) RT-PCR shows expression ratios for the genes shown in E. coli BW25113 cells treated with 10 mM vanillin relative to untreated cells, normalized to expression of rrsA. (C) Comparison of levels of growth in LB plus 10 mM vanillin at 6 h after inoculation (OD600) of BW25113 wild-type parent and single-gene-deletion strains from the Keio collection. A value of 100% corresponds to an OD600 of 0.49 ± 0.04. In each panel, the data represent means of results from three independent cultures with standard deviations shown as error bars. **, P = 0.001 to 0.01; ***, P < 0.001; ****, P < 0.0001 (Student's t test [A and B] or one-way ANOVA [C]).
