

Abstract
This work demonstrates for the first time the creation of microchip electrophoresis devices with ~50 µm cross sectional dimensions by stereolithographic 3D printing and their application in the analysis of medically significant biomarkers related to risk for preterm birth (PTB). We determined that device current was linear with applied potential up to 800 V (620 V/cm). We optimized device and separation conditions using fluorescently labeled amino acids as a model system and compared the performance in our 3D printed microfluidic devices to that in other device materials commonly used for microchip electrophoresis analysis. We demonstrated for the first time microchip electrophoresis in a 3D printed device of three PTB biomarkers, including peptides and a protein, with suitable separation characteristics. Limits of detection for microchip electrophoresis in 3D printed microfluidic devices were also determined for PTB biomarkers to be in the high picomolar to low nanomolar range.
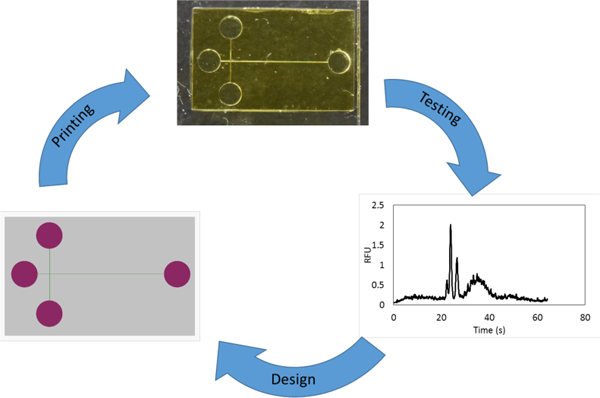
Graphical Abstract
INTRODUCTION
Pre-term birth (PTB) is defined as birth before the 37th week of pregnancy and is the leading complication of pregnancy worldwide, affecting about 1 in 10 pregnancies.1 Sadly, about 1 million infants worldwide die each year from complications from PTB.2 Additionally, many of the survivors suffer complications from incomplete development including vision, hearing, neurological, respiratory, and cardiac challenges.3,4 A key strategy in decreasing PTBs and their associated complications would be to develop a widely available diagnostic tool for PTB risk, which could also facilitate studies of the underlying causes of and treatment options for patients at high risk for a PTB. Esplin et al.5 identified three peptides, which when combined with six previously identified PTB biomarkers,6–10 predict preterm birth risk from maternal serum at 28 weeks of gestational age with 87% selectivity and 81% specificity. Identifying these biomarkers required a variety of sample preparation techniques prior to LC-MS analysis for small peptides vs. proteins,5 which complicates large scale screening.11 Other types of analysis such as sandwich or competitive immunoassays like ELISA are well developed but suffer from difficulties with sensitivity and multiplexing due to the interference of multiple analytes being detected simultaneously.12 An ideal PTB risk diagnosis platform would be inexpensive, robust, and capable of both point of care diagnosis and multiplex detection.
Microfluidic devices are well suited to address this need due to their small size, low reagent consumption and waste generation, integration of many processes, and ability to be automated.13–16 To this end, our group has been working toward the development of microfluidic systems to determine PTB risk.17–19 We have focused on microchip electrophoresis (µCE) for separation of these PTB biomarkers because of its ability to readily handle both proteins and peptides in a single analysis. Indeed, we recently demonstrated separation of several fluorescently labeled PTB biomarkers in a conventionally constructed planar microfluidic device.19
A limitation of planar 2D microfluidic device fabrication is the slow turnaround times for development and optimization of device layouts. For simple, single layer planar designs like cross T channels, conventional techniques such as embossing, machining, or injection molding work well for device production. However, complex layouts that contain multiple channels in different levels, and valves or pumps, are far more difficult to reliably produce using planar 2D micromachining due to the alignment and bonding processes required for each individual planar layer.20 Moreover, there exists a substantial cost and time barrier to creating new designs for optimizing a device layout. Finally, the production of such complex, multilayer microfluidic devices by conventional means requires combinations of a cleanroom environment and caustic chemicals, or highly trained personnel.
As a result, alternative and simpler microfabrication techniques such as 3D printing are especially appealing. Several researchers have made 3D printed devices for analytical applications, such as nitrite21 or anemia22 detection, endocrine secretion analysis,23 saponin analysis,24 catechol detection,25 and bacterial sorting.26 Though these works show the possibility of using 3D printed devices to analyze various chemical and biological samples, fabrication was limited in the minimum size of channels that could be created. Indeed, commercial 3D printing systems are typically capable of printing interior fluidic features of ~250 µm, but for routine use the features are more often >500 µm.27,28 Such millifluidic structures are poorly suited for important biological and analytical processes such as single-cell studies, high-performance separations, or creating models of the circulatory system. Alternatively, two photon polymerization techniques can create micro- and nano-scale features, with excellent resolution (~150 nm), but they suffer from long print times (>20 hr) to make devices of suitable size for microfluidics.29
Two recent publications show both promise and pitfalls of using 3D printing to make fluidic devices for electrically driven separations. Breadmore et al.30 created large microfluidic (~500 × 800 μm cross section) devices with multiple embedded materials for filtration and isotachophoresis of ampicillin. While these devices show promise in working with multiple materials and integrating steps in one chip, the detection limit (2 ppm) is too high for many bioanalyses, and ability to multiplex medically relevant analytes has yet to be demonstrated. Walczak et al.31 3D printed ~400 µm diameter microchannels which they filled with gel to electrophoretically analyze a fluorescently labeled DNA ladder. However, the channel fabrication suffered from multi-hour clearing of support materials. Additionally, due to the large channel diameters, even the application of moderate electric fields (200 V/cm) required active cooling of the entire device, and performance was considerably inferior to previously reported microchip DNA separations.
We recently demonstrated 3D printing of truly microfluidic features using a custom resin formulation and stereolithographic (SLA) 3D printer32,33 that made channels as small as 18 × 20 µm.32 We have demonstrated the use of these 3D printed devices for the creation of microfluidic valves, pumps, chip- to-chip interconnects and PTB biomarker immunoaffinity capture devices.34,35 We here present the first demonstration of 3D printed devices with ~50 µm channels that are suitable for microchip electrophoresis separation of several fluorescently labeled PTB biomarkers. Device layout, running buffer, and applied voltages were optimized and figures of merit were determined for separations. Additionally, limits of detection for the PTB biomarkers were evaluated. This work demonstrates for the first time the ability to create SLA 3D printed microfluidic devices for high performance separation of medically relevant biomolecules.
MATERIALS AND METHODS
Material sources
Polyethylene glycol diacrylate (PEGDA, 258 Da MW), triethoxysilyl propylmethacrylate, hydroxypropyl cellulose (HPC) average MW 300 kDa, 4-(2-hydroxyethyl)-1-piperazineethanesulfonic acid (HEPES), 2- ethanesulfonic acid (MES), N-cyclohexyl-2-aminoethanesulfonic acid (CHES), Phenylbis (2,4,6- trimethylbenzoyl)phosphine oxide (Irgacure 819), and dimethyl sulfoxide (DMSO) were purchased from Sigma-Aldrich (Milwaukee, WI). AlexaFluor 532 NHS ester (AF), acetone and 2-propanol (IPA) were purchased from Fisher Scientific (Salt Lake City, UT). Glycine (G), ferritin (Fer), sodium phosphate monobasic, hydrochloric acid and Amicon ultra 0.5 mL centrifuge filters were purchased from Millipore Sigma (Billerica, MA). Boric acid and sodium hydroxide were purchased from Mallinckrodt Specialty Chemicals (St. Louis, MO). Citric acid and sodium bicarbonate monobasic were purchased from Merck (Burlington, MA). Toluene and glass microscope slides (3 × 1 in, 1 mm thick) were purchased from Avantor (Center Valley, PA). Rhodamine B and phenylalanine (F) were purchased from Spectrum Chemical (New Brunswick, NJ). Peptide 1 (P1) was purchased from Biomatik (Wilmington, DE). Corticotropin releasing factor (CRF) was purchased from GeneScript (Piscataway, NJ). 2- Nitrodiphenylsulfide (NPS) was purchased from TCI America (Portland, OR). Cyclic olefin copolymer (COC) was purchased from Zeon Chemicals (Louisville, KY). Polymethylmethacrylate (PMMA) was purchased from Evonik (Parsippany, NJ). Polydimethylsiloxane (PDMS) base and curing agent were purchased from Dow Chemical (Midland, MI). All solutions were prepared in deionized water (18.3 MΩ·cm) filtered by a Barnstead EASYpure UV/UF system (Dubuque, IA).
3D printing
Glass slides were scored into 1” squares on one face with a laser cutter (Universal Laser Systems, Scottsdale, AZ). The laser cutter settings were 50% power, 10% speed, and 165 pulses per inch. The scored slides were washed with acetone then IPA and dried in air. They were then submerged in a freshly prepared 10% (v/v) solution of triethoxysilyl propylmethacrylate in toluene for 2 hours. After treatment, the glass slides were washed again with IPA, dried and broken along the scored marks. They were stored under toluene until use. The 3D printing resin was made from a solution of 2% NPS and 1% Irgacure 819 (w/w) in PEGDA. The resin was sonicated until all components were dissolved and stored in an amber bottle wrapped in foil to protect it from light.
3D printing designs were created in open source CAD software called OpenSCAD (openscad.org). A schematic of the design used in this work can be seen in Fig. 1A showing the sample and buffer reservoirs in purple and channels in green. The overall device dimensions are 12 × 20 × 1.8 mm3 (L x W x H); 12 mm x 20 mm is the approximate X-Y build area of the printer. The reservoir radius is 1.4 mm and channels are designed to be 38 μm wide and 50 μm tall.
Figure 1.

T-shaped separation device. (A) OpenSCAD design with channels shown in green and reservoirs in purple. The sample, ground, sample waste, and high voltage are abbreviated Sam, Gnd, SW, and HV respectively. (B) Device photograph.
The SLA 3D printer used in this work is described in reference 32. This 3D printer has a polymerization source that operates at 385 nm, a 7.6 μm pixel size in the image plane and an irradiance of 21 mW·cm-2. The layer thickness for devices is 10 μm, and the normal exposure time for each layer is 600 ms. To ensure attachment of a print to the glass slide, the first four layers are overexposed for 20, 10, 5, and 1 seconds. After the printing process is complete, the unpolymerized material is flushed out of the print in 30 s using IPA and vacuum. Post-print the device is cured with a 430 nm LED (ThorLabs, Newton NJ) at 11 mW/cm2 for at least 20 minutes after liquid resin removal.
An edge underexposure technique is used obtain channels with a more square-like geometry, similar to the technique previously used in our group.32,36 Edge underexposure uses our ability to project multiple images per layer to over- or underexpose pixels at channel edges to optimize feature sizes. Channels are designed to be 5 pixels wide, and the printer underexposes the two pixels adjacent to each side of the channel. Using this technique, the bulk of the print receives a 600 ms projector exposure in a layer, while the two pixels at the channel edge only receive a 400 ms exposure. This reduced exposure helps to limit light scattering into the channels and to optimize the channel shape.
For device transmittance properties a 2 mm thick piece of resin with 2% NPS was polymerized using our standard device fabrication conditions. The absorption spectrum was measured using an Ocean Optics QE65000 spectrometer (Largo, FL) collected by a 100 μm core optical fiber illuminated by a broadband XCITE-120Q source (Lumen dynamics, Ontario) between 200 and 1000 nm. The percent transmittance was calculated from three replicate measurements.
To prepare devices for SEM imaging, they were removed from the glass slide and cut using a razor blade. The pieces were fixed to conductive tape and sputter coated with 80:20 Au:Pd. SEM images of channels were taken using an ESEM XL30 FEI (Thermo Fisher, Fairlawn, NJ) using high vacuum mode with a beam voltage of 10 kV. Channel sizes were measured with ImageJ (NIH, Bethesda, MD) for 5 different devices. Further characterization of the resolution of the printer and repeatability can be found in reference 36.
Separations
All samples were dissolved in 10 mM sodium bicarbonate (pH 9.5) and labeling was performed overnight at 37 °C. AF was dissolved in DMSO, with the total DMSO content for labeling kept at or below 10%. The molar labeling ratio for G, F, P1 and CRF was 10:1 sample:dye to minimize the amount of extraneous dye peaks; samples were not filtered due to relatively low analyte molecular weights. Fer was labeled in a 30:1 dye:sample molar ratio. Excess dye from Fer labeling was removed using a 50 kDa centrifuge filter (4 times, 14,000 rpm, 15 min). The rinsing buffer for Fer filtering was the labeling buffer, 10 mM sodium bicarbonate pH 9.5. Working solutions of all samples were prepared in 5 mM HEPES (pH 8). We note that much faster on-chip labeling of proteins and peptides can be accomplished in ~30 min in an integrated microfluidic device.17 A list of PTB biomarkers analyzed is given in Table 1.
Table 1:
| Biomarker | Abbreviation | Molecular Weight (kDa) | PTB Risk Concentration (nM) |
|---|---|---|---|
| Peptide 1: QLGLPGPPDVPDHAAY HPF | PI | 2.0 | * |
| Corticotropin releasing factor | CRF | 2.7 | 0.075 |
| Ferritin | Fer | 470 | 0.040 |
PTB risk concentration not known.
For Ohm’s law experiments a device was filled with running buffer (50 mM HEPES pH 8 with 1.0% HPC). The Sam, SW, and Gnd reservoirs were kept at 0 V and voltage was applied at the HV reservoir. The current and voltage were measured using a high voltage power supply (Stanford Research Systems, Sunnyvale, CA). The experiment was conducted on three different devices, with three replicates per device.
For µCE the device was filled with 50 mM HEPES pH 8 with 1.0% HPC (running buffer). All buffers were prepared with the stated concentration of buffering compound and titrated to the listed pH using 0.1 M NaOH or HCl. Pinched injection19,37 at +200 V was used; plug shape was confirmed by fluorescence imaging of the channel intersection. During separation the pullback voltage was +200 V and the separation voltage was +400 V.
The LIF detection system had a 532 nm laser (Laserglow Technologies, Toronto, ON) that passed through a dichroic mirror (Semrock, Rochester, NY) and entered an Axio Observer.A1 inverted microscope (Zeiss, Jena, Germany) fitted with a Chroma ET-532 nm laser band and long pass filter set (Rockingham, VT). A 20X objective was used to focus the excitation source within the channel and collect fluorescent photons. Voltages were controlled using two high voltage power supplies and a custom voltage switching box which was connected to the separation device using platinum electrodes. Power exiting the laser was 4.0 mW. The fluorescence emission was collected with a Hamamatsu PMT (Bridgewater, NJ) with a Stanford Research Systems SR-560 preamplifier (Sunnyvale, CA). The analog PMT voltage signal was digitized using a NI USB-6212 analog-to-digital converter (National Instruments; Austin, TX) and recorded at 20 Hz using LabVIEW software (National Instruments). The signal was measured 0.5 mm from the end of the separation channel, giving an effective separation distance (injection channel to detection point) of 11.6 mm.
PDMS was prepared by mixing base and curing agent in a 10:1 ratio and degassing for 30 min. The mixture was placed on a glass slide and cured at 110 °C for 45 min. To measure the auto-fluorescence of various device materials (PMMA, COC, PDMS, and our 3D prints) a small block of material was placed within the focused laser and the resulting fluorescent signal at the PMT was measured for 1 min at 5 different points.
For electroosmotic flow (EOF) measurements (each conducted in duplicate), 20 nM rhodamine was injected in the same manner as the samples. The time to saturate the signal detected at the channel intersection (within 5% of its maximum) was measured. EOF was calculated from the injection time, applied voltage (+200 V), distance to the detection spot and total length of the injection channel. Finally, EOF was corrected for diffusion by allowing rhodamine to diffuse without an applied voltage.
RESULTS AND DISCUSSION
A photograph of a finished 3D printed device can be seen in Fig. 1B. The print has a slight yellow color due to the presence of both the UV absorber (NPS) and photoinitiator (Irgacure 819). Channels can be seen running between the Sam and SW reservoirs and Gnd and HV reservoirs which intersect in a T-shaped design.
A comparison between a channel without edge underexposure and one with channel edge underexposure as used in this work can be seen in Figure 2. The channel with standard exposure (Fig. 2A) measures 27.1 ± 1.1 μm wide and 50.6 ± 1.4 μm tall (n = 5). The channel has nearly the same height as designed but is 12 μm narrower. Figure 2B shows an SEM image of a device with a reduced edge exposure as used in this work. The channels of this device measure 37.2 ± 0.5 μm wide and 49.3 ± 0.8 μm tall (n = 5). This channel size was selected because these devices had high yields with routine processing. The channel height and width are almost exactly as designed in the CAD file. Importantly, understanding the effects of exposure parameters on channel shape and size, plus the ability to control all aspects of printing, including layer thickness (down to 1 µm) enable successful device fabrication.
Figure 2.

SEM images of channel cross sections. (A) Channels with standard (600 ms) exposure measure 26 µm wide by 49 µm tall. (B) Reduced edge exposure (400 ms at channel edge, 600 ms in bulk) channels measure 37 µm wide by 50 µm tall.
Initial experiments focused on determining optimal separation conditions and device layout for peak resolution and efficiency. Several device layout parameters such as reservoir size, relative lengths of separation and injection channels, and reservoir spacing were tested to determine their effects on separation results. From this analysis we determined that the device configuration that yielded the most reproducible results (Fig. 1) had reservoirs 2.7 mm in diameter, a separation channel length of 13 mm, and the channel connecting the sample and sample waste reservoirs intersecting the separation channel 2 mm from the ground reservoir. We believe this design worked well for two main reasons. First, the larger reservoirs minimize the effects of gravity-induced flow due to height differences of liquid in the reservoirs. Rapid capillary flow is observed in these devices even with minor liquid height differences, and larger reservoirs limit gravity induced flow, such that fluid motion is only dictated by the voltage configuration. Secondly, the device layout in Fig. 1 makes the separation channel length near the maximum length feasible for a straight channel with our 3D print size, allowing the best peak resolution possible. A serpentine geometry could be used to increase channel length, but the tapered turns needed to limit band broadening38 create complications. The minimum channel width we can print is ~20 μm wide, which would require un-tapered sections of channel to be ~100 μm wide, likely degrading separation performance.
We previously characterized the absorption of this resin;32 the transmittance for a 500 μm thick piece of material can be seen in the Supporting Information (Figure S1). This matches the 500 µm thickness of material between the channel and the bottom of a device. At the maximum excitation and emission wavelengths of AF532 (532 and 554 nm) the transmittances are 99.84% and 99.87%, respectively, indicating very little absorbance of the excitation and emission in our devices.
We also characterized the auto-fluorescence of our 3D printed material, as well as three other common microfluidic materials: PDMS, PMMA, and COC. The fluorescence from the focused laser in the bulk material collected at the PMT is given in Figure S2. Our 3D printed devices have slightly higher fluorescence than either COC or PDMS (0.3 vs. 0.1–0.2) but lower fluorescence than PMMA (0.3 vs. 0.6). Hence, our 3D prints have acceptable background for use in LIF detection compared to other commonly used polymer device materials.
With the device design optimized, we next sought to determine the best separation conditions regarding buffer identity and concentration, and the voltages applied. Several different buffer compositions were examined, including sodium citrate (pH 5), MES (pH 6), sodium phosphate (pH 7), HEPES (pH 8), sodium borate (pH 8), CHES (pH 9), and sodium bicarbonate (pH 9.5). We found that ~10 mM concentrations of polyprotic buffers (citrate, phosphate, and bicarbonate) produced erratic currents in devices and bubbles from electrolysis of the running buffer in reservoirs and channels even at fields <100 V/cm. We do not believe this is an ionic strength issue, because the ionic strength in the polyprotic buffers was similar to that in buffers that did not show bubble problems (e.g., 0.011 for citric acid pH 5, 0.013 for HEPES pH 8). For all concentrations of MES buffer (10, 25, 50, and 100 mM), samples had issues with consistent injection times and amounts, likely due to how close the buffer pH (6) was to the pIs of the amino acids (6.1 for G and 5.5 for F). To determine the optimal buffer between the remaining candidates (HEPES, borate, and CHES), the resolution between AF-labeled G and F was measured at a variety of buffer concentrations between 10 and 100 mM. From this analysis, the optimal buffer concentration was 50 mM; however, we occasionally had issues performing a reproducible injection with all buffers. We found that adding 1.0% HPC to the running buffer helped stabilize EOF, resulting in a 100% success rate for injections and better resolved peaks. In Fig. 3A, the electropherogram for µCE of amino acids with HPC in the buffer shows better resolution (2.3 vs 1.3) between the G and F peaks than the separation without HPC (SI, Fig. S3). HPC may play multiple roles in increasing resolution between G and F by improving the peak efficiency as a dynamic coating that prevents analyte adsorption, and by stabilizing/suppressing EOF. Additionally, Table S1 reports EOF for these buffers with and without HPC. The buffers without HPC all had less reproducible migration times and EOF than those with HPC, HEPES was selected as the running buffer because it had the lowest EOF. This buffer is similar to that used in our previous work (100 mM CHES pH 9 with 0.05% HPC),19 but in that study higher molecular weight (~1000 kDa) HPC was used, which was less soluble than the (~100 kDa) used in this work. Also in our prior work,19 buffer pHs between 7–10 were found to be acceptable, including pH 8 HEPES. Thus, the running buffer used for analysis was 50 mM HEPES pH 8 with 1.0% HPC.
Figure 3.

Microchip electropherograms in 3D printed microfluidic devices. (A) Amino acids: 50 nM G and F in 50 mM HEPES pH 8. (B) PTB biomarkers: P1, CRF, and Fer; analyte concentrations are 20 nM, 5 nM, and 5 nM, respectively.
We carried out an Ohm’s Law analysis of our 3D printed devices. The current vs. voltage results from these experiments can be seen in Figure 4. Devices maintained a linear I-V relationship up to ~800 V. The average applied potential where a 5% deviation from linearity occurred (n=9) was 800 ± 100 V (620 ± 80 V/cm). This voltage is almost double what we applied during µCE, indicating that Joule heating was not an issue in our runs. Indeed, operational voltages below this limit allowed good resolution and ensured consistency in separation performance. We also did not observe any problems with arcing between the three closest reservoirs under these conditions.
Figure 4.
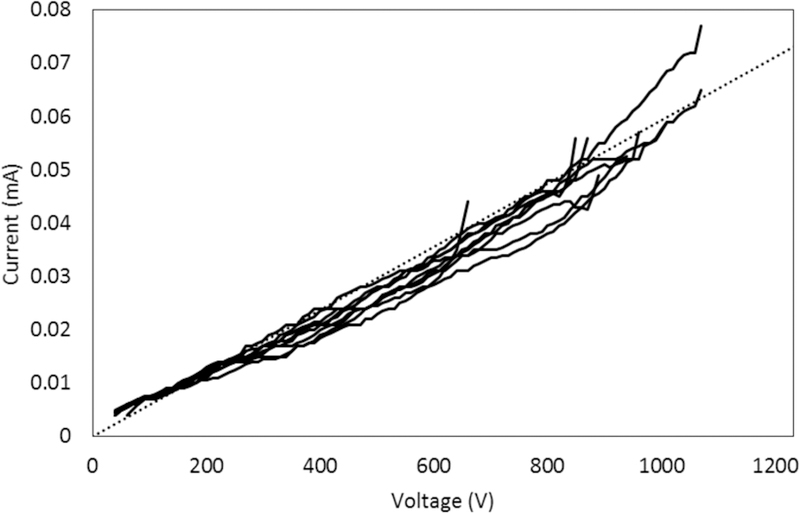
Measurement of current vs. voltage in 37 μm x 50 μm channels in 3D printed microfluidic devices. Data are shown for 9 trials, up to the voltage where current deviates from linearity. A dotted reference line is included to make the deviations from linearity more readily visible.
With the Ohm’s Law setting an upper limit, we optimized the applied voltages for PTB biomarker separations. This involved balancing of a strong, consistent electric field in the channel, without causing too much electrolysis of the running buffer through the course of the run. For injection, up to +225 V (450 V/cm) was applied across the channel connecting Sam and SW, while the remaining reservoirs were grounded. For separation, the Gnd reservoir was grounded, up to +225 V was applied to the Sam and SW reservoirs, and up to +500 V (380 V/cm) was applied to the HV reservoir. Applying these voltages did not cause buffer electrolysis during the ~3 min analysis time. This electric field is comparable the 500 V/cm we used previously with COC microdevices.19 During each separation experiment, every injection was confirmed by fluorescence imaging in the microscope, ensuring high signal in the injection intersection before application of the separation voltage. A video of injection is in the electronic Supplementary Information Video S1, where sample is seen being injecting from the bottom to the top of the frame. When the voltage configuration is switched to the separation a plug is seen moving from left to right down the separation channel while the remaining material in the injection channel is drawn back away from the intersection. After injection confirmation, the microscope stage was translated so the detection spot was 0.5 mm from the reservoir at the end of the channel. We used an amino acid test mixture for initial characterization of our system. The results of the optimized separation of G and F are shown in Figure 3A. The two peaks are well separated, and a small amount of residual dye from labeling was detected before the G peak. Peak retention times were confirmed by spiking individual analytes into the mixture. The resolution between G and F is 2.3, and the number of theoretical plates is 1600 for G and 1700 for F. This separation clearly demonstrates the ability of our system to rapidly resolve fluorescently labeled biomolecules in <1 min with good separation performance. Additionally, this separation served as a test for all devices to verify functionality before use with other samples.
We further compared our µCE results in 3D printed microfluidic devices with the initially published µCE of amino acids with LIF detection in four widely used materials: glass,39 PDMS,40 PMMA41 and COC.42 Table 2 reports the amino acid concentrations analyzed, the separation distances, the electric fields and times for separation, and the number of theoretical plates achieved in the first demonstration of µCE of amino acids with LIF detection in each of these device materials. Notably, our 3D printed material had the lowest amino acid concentration separated (50 nM). Our 3D print material also worked with comparable electric fields to the other polymer materials, but lower than those applied in glass. These 3D printed devices had the shortest separation distance, and had among the fastest separation times (tied with PMMA, and twofold slower than glass, but nearly tenfold faster than in PDMS or COC). The 3D prints had lower theoretical plate counts than obtained in the other materials, although the plates per separation distance are higher in the 3D printed device than in the initial PDMS report. These results demonstrate that 3D printed microfluidic devices offer comparable to slightly lower separation performance than that in other polymer materials.
Table 2:
Comparison of performance in the first paper reporting µCE of amino acids with LIF detection in a given device material.
| glass | PDMS | PMMA | COC | 3D print | |
|---|---|---|---|---|---|
| conc (µM) | 10 | 10 | 3 | 0.1 | 0.05 |
| d (cm) | 11 | 21 | 2.0 | 2.5 | 1.2 |
| E (V/cm) | 1100 | 180 | 360 | 460 | 380 |
| time (s) | 15 | 280 | 30 | 300 | 30 |
| N | 40,000–75,000 | 23000* | 4700–6700 | 12000 | 1600–1700 |
| ref. | 39 | 40 | 41 | 42 | this work |
N not reported; estimated from data in a figure in ref. 40.
Encouraged by these small molecule separations, we further developed conditions for µCE of three PTB biomarkers, P1, CRF and Fer. These biomolecules were chosen as being representative of the larger panel of PTB biomarkers (smallest, intermediate and largest compounds). An electropherogram of these three compounds can be seen in Figure 3B showing good separation; peak identities were confirmed by spiking. The resolution between the critical pair of peaks of interest (P1 and CRF) is 2.1 and the efficiency for P1 is 3600 plates. We note that the peak for Fer is broader than the others due to its large size and number of amine groups, which allow for a larger distribution in the number of AF labels attached. In recent work19 we separated 6 PTB biomarkers with resolutions ranging from 0.5 to 1.9, indicating that these 3D printed devices offer comparable separations to conventionally fabricated devices. Importantly, this work represents the first successful demonstration of high performance µCE in a 3D printed microfluidic device.
We also characterized the detection limits for the three PTB biomarkers in our devices, as seen in Figure 5; all samples were analyzed in triplicate. Figure 5A shows the results for P1, which had a limit of detection of 7 nM and an R2 value of 0.994. Figure 5B shows the calibration curve for CRF which had a limit of detection of 200 pM and an R2 value of 0.999. Finally, Figure 5C contains the calibration curve for Fer, which has a limit of detection of 4 nM and an R2 value of 0.996. The Fer sample calibration curve has a nonzero intercept, most likely due to either the greater peak width or small amounts of nonspecific adsorption of this large protein to the channel walls, which is more pronounced at very dilute concentrations. The limits of detection for this analysis are excellent, in the high pM to low nM range, and consistent with our previous work involving conventional microfluidic devices, where detection limits for P1, CRF, and ferritin were 3 nM, 90 nM, and 1 nM, respectively.19 Although these detection limits are still higher than the PTB risk levels for these analytes, we have previously demonstrated that detection limits can be lowered through on-chip integration of immunoaffinity or solid-phase extraction with µCE.17,18
Figure 5.

Calibration curves for determining detection limits for µCE of PTB biomarkers in 3D printed microfluidic devices. (A) P1; the limit of detection is 7 nM. (B) CRF; the limit of detection is 200 pM. (C) Fer; the limit of detection is 4 nM.
We note that further optimization should be helpful in facilitating device fabrication and use. Initially, approximately 75% of devices have all features correctly formed after 3D printing, and improvements in printer calibration and print design with our more recent devices increased printing success to ~90%. The most common print failure mechanisms are device delamination from the glass slide caused by misalignment during printer calibration or bubbles trapped in the resin during the printing process. Of the correctly printed devices ~50% were successfully used for μCE experiments in the operation verification procedure separating amino acids. Recent experiments suggest that our device operation success rate could also be increased to ~80% through proper identification of defective devices and improved channel filling and cleaning. Common device operation failures entail poor sample injection, or delamination when voltage is applied. To improve device yield and operational success we are improving the 3D printer calibration technique to provide better projector focus and reduce blur at channel edges. We also have promising initial results for decreasing device defects such as bubbles and particles by filtration and resin tray film treatment.
CONCLUSION
In this work we have demonstrated SLA 3D printing of microfluidic devices with channels <50 µm for µCE analysis of amino acids and preterm birth risk biomarkers, the first such separation in a 3D printed device. Separation conditions including device layout, running buffer and applied voltages were optimized using Ohm’s Law and EOF analysis and validated using a test mixture. Comparison of separation performance in our 3D printed microfluidic devices to that in other device materials commonly used for microchip electrophoresis analysis revealed that the 3D printed systems had comparable or slightly decreased performance. We applied our devices in analyzing medically significant samples, with a resolution of 2.1 and 3600 plates. Limits of detection for the analytes were in the high pM to low nM range, comparable to our previous results in conventionally fabricated microfluidic devices. Device yields are good, with excellent prospects for improvement though better 3D printer calibration techniques, resin pretreatment, and printer preparation procedures.
This work demonstrates the use of SLA 3D printing to make microfluidic devices for analysis of medically relevant biomarkers. Ongoing studies to evaluate these devices with additional biomarkers, as well as improvements in device fabrication and use will further showcase the utility and benefits of our approach. For example, higher resolution printing should allow for serpentine channels with tapered turns to be made to increase channel length. In addition, a key advantage of 3D printing is the ability to readily combine multiple components and processes in a single device, which we expect to leverage in interfacing solid-phase extraction and on-chip sample preparation. The capabilities of our 3D printing system in creating complex 3D microfluidic structures in a scalable manner offers great opportunities for device optimization and fabrication. Finally, the ability to generate 3D printed microfluidic systems and use them to address important analytical problems holds great value for future developments in the field.
Supplementary Material
ACKNOWLEDGEMENTS
We acknowledge NIH for funding of this work (R01 EB006124, R01 EB027096, and R15 GM123405– 01A1).
Footnotes
CONFLICTS OF INTEREST
The authors declare no conflicts of interest.
SUPPORTING INFORMATION
Supporting figures, files, a table, and a video
REFERENCES
- (1).World Health Organization, Born too soon: the global action report on preterm birth, WHO, Geneva: 2012. [Google Scholar]
- (2).Centers for Disease Control and Prevention. Preterm birth. In: Maternal and Infant Health CDC; 2018. https://www.cdc.gov/reproductivehealth/maternalinfanthealth/pretermbirth.htm Accessed 3 Jul 2018. [Google Scholar]
- (3).Behrman RE, Butler AS. Preterm birth: causes, consequences, and prevention Washington DC: National Academies Press; 2007. [PubMed] [Google Scholar]
- (4).Blencowe H, Cousens S, Oestergaard MZ, Chou D, Moller AB, Narwal R, Adler A, Garcia CV, Rohde S, Say L, Lawn JE National, regional, and worldwide estimates of preterm birth rates in the year 2010 with time trends since 1990 for selected countries: a systematic analysis and implications. Lancet 2012, 379, 2162–2172. [DOI] [PubMed] [Google Scholar]
- (5).Esplin MS, Merrell K, Goldenberg R, Lai Y, Iams JD, Mercer B, Spong CY, Miodovnik M, Simhan HN, van Dorsten R, Dombrowski M, Proteomic identification of serum peptides predicting subsequent spontaneous preterm birth. Am. J. Obstet. Gynecol 2011, 204, 391.e1–8. [DOI] [PMC free article] [PubMed] [Google Scholar]
- (6).Al-Gubory KH, Fowler PA, Garrel C, The roles of cellular reactive oxygen species, oxidative stress and antioxidants in pregnancy outcomes. Int. J. Biochem. Cell Biol 2010, 42, 1634–1650. [DOI] [PubMed] [Google Scholar]
- (7).Buhimschi IA, Christner R, Buhimschi CS, Proteomic biomarker analysis of amniotic fluid for identification of intra-amniotic inflammation. BJOG 2005, 112, 173–181. [DOI] [PubMed] [Google Scholar]
- (8).Fortunato SJ, Menon R Distinct molecular events suggest different pathways for preterm labor and premature rupture of membranes. Am. J. Obstet. Gynecol 2001, 184, 1399–1406. [DOI] [PubMed] [Google Scholar]
- (9).Petraglia F, Imperatore A, Challis JRG, Neuroendocrine mechanisms in pregnancy and parturition. Endocrine Rev 2010, 31, 783–816. [DOI] [PubMed] [Google Scholar]
- (10).Kramer MS, Lydon J, Séguin L, Goulet L, Kahn DR, McNamara H, Genest J, Dassa C, Chen MF, Sharma S, Meaney MJ, Thomson S, Uum SV, Koren G, Dahhou M, Lamoureux J, Platt RW Stress pathways to spontaneous preterm birth: the role of stressors, psychological distress, and stress hormones. Am. J. Epidemiol 2009, 169, 1319–1326. [DOI] [PubMed] [Google Scholar]
- (11).Grebe SKG, Singh RJ, LC-MS/MS in the clinical laboratory–where to from here?. Clin. Biochem. Rev 2011, 32, 5–31. [PMC free article] [PubMed] [Google Scholar]
- (12).Cross TG, Hornshaw MP, Can LC and LC-MS ever replace immunoassays?. J. Appl. Bioanal 2016, 2, 108–116. [Google Scholar]
- (13).Nge PN, Rogers CI, Woolley AT Advances in microfluidic materials, functions, integration, and applications. Chem Rev 2013, 113, 2550–2583. [DOI] [PMC free article] [PubMed] [Google Scholar]
- (14).Pandey C, Augustine S, Kumar S, Nara S, Srivastave S, Malhotra B Microfluidics Based Point- of-Care Diagnostics. Biotechnol J 2018, 13, 1700047. [DOI] [PubMed] [Google Scholar]
- (15).de Campos RPS, Siegel JM, Fresta CG, Caruso G, da Silva JAF, Lunte SM Indirect detection of superoxide in RAW 264.7 macrophage cells using microchip electrophoresis coupled to laser-induced fluorescence. Anal. Bioanal. Chem 2015, 407, 7003–7012. [DOI] [PMC free article] [PubMed] [Google Scholar]
- (16).Hu J, Cui X, Gong Y, Xu X, Gao B, Wen T, Lu TJ, Xu F Portable microfluidic and smartphone-based devices for monitoring of cardiovascular diseases at the point of care. Biotechnol Adv 2016, 34, 305–320. [DOI] [PubMed] [Google Scholar]
- (17).Sahore V, Sonker M, Nielsen AV, Knob R, Kumar S, Woolley AT Automated microfluidic devices integrating solid-phase extraction, fluorescent labeling, and microchip electrophoresis for preterm birth biomarker analysis. Anal Bioanal Chem 2018, 410, 933–941. [DOI] [PMC free article] [PubMed] [Google Scholar]
- (18).Sonker M, Parker EK, Nielsen AV, Sahore V, Woolley AT Electrokinetically operated microfluidic devices for integrated immunoaffinity monolith extraction and electrophoretic separation of preterm birth biomarkers. Analyst 2018, 143, 224–231. [DOI] [PMC free article] [PubMed] [Google Scholar]
- (19).Nielsen AV, Nielsen JB, Sonker M, Knob R, Sahore V, Woolley AT Microchip electrophoresis separation of a panel of preterm birth biomarkers. Electrophoresis, 2018, 39, 2300–2307. [DOI] [PMC free article] [PubMed] [Google Scholar]
- (20).Dziomba S, Araya-Farias M, Smadja C, Taverna M, Carbonnier B, Tran NT Solid supports for extraction and preconcentration of proteins and peptides in microfluidic devices: A review. Anal Chim Acta 2017, 955, 1–26. [DOI] [PubMed] [Google Scholar]
- (21).Shallan AI, Smejkal P, Corban M, Guijt RM, Breadmore MC Cost-effective three-dimensional printing of visibly transparent microchips within minutes. Anal. Chem 2014, 86, 3124–3130. [DOI] [PubMed] [Google Scholar]
- (22).Plevniak K, Campbell M, Myers T, Hodges A, He M 3D printed auto-mixing chip enables rapid smartphone diagnosis of anemia. Biomicrofluidics, 2016, 10, 054113–1-11. [DOI] [PMC free article] [PubMed] [Google Scholar]
- (23).Brooks JC, Fort KI, Holder DH, Holtan MD, Easley CJ Macro-to-micro interfacing to microfluidic channels using 3D-printed templates: application to time-resolved secretion sampling of endocrine tissue. Analyst 2016, 141, 5714–5721. [DOI] [PMC free article] [PubMed] [Google Scholar]
- (24).Anderson KB, Lockwood SY, Martin RS, Spence DMA 3D printed fluidic device that enables integrated features. Anal. Chem 2013. 85 5622–5626. [DOI] [PubMed] [Google Scholar]
- (25).Munshi AS, Martin RS Microchip-based electrochemical detection using a 3-D printed wall-jet electrode device. Analyst, 2016, 141, 862–869. [DOI] [PMC free article] [PubMed] [Google Scholar]
- (26).Lee W, Kwon D, Choi W, Jung GY, Au AK, Folch A, Jeon S 3D-printed microfluidic device for the detection of pathogenic bacteria using size-based separation in helical channel with trapezoid cross-section. Scientific Reports, 2015, 5, 7717–1-6. [DOI] [PMC free article] [PubMed] [Google Scholar]
- (27).Beauchamp MJ, Nordin GP, Woolley AT Moving from millifluidic to truly microfluidic sub- 100-μm cross-section 3D printed devices. Anal. Bioanal. Chem, 2017, 409, 4311–4318. [DOI] [PMC free article] [PubMed] [Google Scholar]
- (28).Waheed S, Cabot JM, Macdonald NP, Lewis T, Guijt RM, Paull B, Breadmore MC 3D printed microfluidic devices: enablers and barriers. Lab Chip, 2016, 16, 1993–2013. [DOI] [PubMed] [Google Scholar]
- (29).Nanoscribe, Photonic Professional datasheet, http://www.nanoscribe.de/files/4414/7393/1095/DataSheet_PP_V05_2016_Web.pdf, accessed 12 Dec 2018.
- (30).Li F, Macdonald NP, Guijt RM, Breadmore MCA 3D printed fluidic device for measuring pharmaceuticals in biological fluids. Anal. Chem 2018. DOI: 10.1021/acs.analchem.8b03772. [DOI] [PubMed] [Google Scholar]
- (31).Walczak R, Adamski K, Kubicki W, Inkjet 3D printed chip for capillary gel electrophoresis. Sens. Actuators, B, 2018, 261, 474–480. [Google Scholar]
- (32).Gong H, Bickham BP, Woolley AT, Nordin GP Custom 3D printer and resin for 18 μm× 20 μm microfluidic flow channels. Lab Chip, 2017, 17, 2899–2909. [DOI] [PMC free article] [PubMed] [Google Scholar]
- (33).Gong H, Beauchamp MJ, Perry S, Woolley AT, Nordin GP Optical Approach to Resin Formulation for 3D Printed Microfluidics. RSC Adv 2015, 5, 106621–106632. [DOI] [PMC free article] [PubMed] [Google Scholar]
- (34).Gong H, Woolley AT, Nordin GP 3D printed high density, reversible, chip-to-chip microfluidic interconnects. Lab Chip 2018, 18, 639–647. [DOI] [PMC free article] [PubMed] [Google Scholar]
- (35).Parker EK, Nielsen AV, Beauchamp MJ, Almughamsi HM, Nielsen JB, Sonker M, Gong H, Nordin GP, Woolley AT 3D printed microfluidic devices with immunoaffinity monoliths for extraction of preterm birth biomarkers. Anal. and Bioanal. Chem 2018. DOI: 10.1007/s00216-018-1440-9. [DOI] [PMC free article] [PubMed] [Google Scholar]
- (36).Beauchamp MJ, Gong H, Woolley AT, Nordin GP 3D Printed Microfluidic Features Using Dose Control in X, Y, and Z Dimensions. Micromachines 2018, 9, 326–1-12. [DOI] [PMC free article] [PubMed] [Google Scholar]
- (37).Jacobson SC, Hergenröder R, Koutny LB, Warmack RJ, Ramsey JM, Effects of Injection Schemes and Column Geometry on the Performance of Microchip Electrophoresis Devices. Anal. Chem 1994, 66, 1107–1113. [Google Scholar]
- (38).Paegel BM, Hutt LD, Simpson PC, Mathies RA, Turn geometry for minimizing band broadening in microfabricated capillary electrophoresis channels. Anal. Chem, 2000, 72, 3030–3037. [DOI] [PubMed] [Google Scholar]
- (39).Harrison DJ, Fluri K, Seiler K, Fan Z, Effenhauser CS, Manz A Micromachining a Miniaturized Capillary Electrophoresis-Based Chemical Analysis System on a Chip. Science, 1993, 261, 895–7. [DOI] [PubMed] [Google Scholar]
- (40).Duffy DC, McDonald JC; Schueller OJA; Whitesides GM Rapid Prototyping of Microfluidic Systems in Poly(dimethylsiloxane) Anal. Chem, 1998, 70, 4974–84. [DOI] [PubMed] [Google Scholar]
- (41).Kelly RT, Woolley AT Thermal Bonding of Polymeric Capillary Electrophoresis Microdevices in Water. Anal. Chem, 2003, 75, 1941–5. [DOI] [PubMed] [Google Scholar]
- (42).Wang Q, Zhang Y, Ding H, Wu J, Wang L, Zhou L, Pu Q The use of ethylene glycol solution as the running buffer for highly efficient microchip-based electrophoresis in unmodified cyclic olefin copolymer microchips. J. Chromatogr. A, 2011, 52, 9422–7. [DOI] [PubMed] [Google Scholar]
Associated Data
This section collects any data citations, data availability statements, or supplementary materials included in this article.