Abstract
Ionocytes are specialized cells in the epidermis of embryonic zebrafish (Danio rerio) that play important roles in ion homeostasis and have functional similarities to mammalian renal cells. Here, we examined whether these cells might also share another functional similarity with renal cells, which is the presence of efflux transporter activities useful for elimination of toxic small molecules. Xenobiotic transporters (XTs), including the ATP-Binding Cassette (ABC) family, are a major defense mechanism against diffusible toxic molecules in aquatic embryos, including zebrafish, but their activity in the ionocytes has not previously been studied. Using fluorescent small molecule substrates of XT, we observed that specific populations of ionocytes uptake and efflux fluorescent small molecules in a manner consistent with active transport. We specifically identified a P-gp/ABCB1 inhibitor-sensitive efflux activity in the H+-ATPase-rich (HR) ionocytes, and show that these cells exhibit enriched expression of the ABCB gene, abcb5. The results extend our understanding of the functional significance of zebrafish ionocytes and indicate that these cells could play an important role in protection of the fish embryo from harmful small molecules.
Keywords: ionocytes, zebrafish, embryo, xenobiotic transporter (XT), ATP-binding cassette (ABC) transporter, P-glycoprotein (P-gp), multidrug resistance protein (MRP), calcein
Introduction
Aquatic embryos, such as those of zebrafish (Danio rerio), rely upon cellular defenses to survive in challenging environments. In adult vertebrates, protective proteins are often expressed at environmental barrier tissues such as the gut, kidney, liver, and blood-brain barrier. In contrast, in the embryo, the internal detoxification organs are not yet mature, and the barrier function of detoxification organs is often carried out by cells at the embryo-environment interface (Epel et al., 2008).
Zebrafish embryos have a specialized epidermis composed of five cell types: club cells, mucous cells, keratinocytes, ionocytes, and undifferentiated cells (Chang and Hwang, 2011). Upon completion of gastrulation, the zebrafish embryonic epidermis acts as the major barrier to accumulation of harmful small molecules into the embryo. Of the five epidermal cell types in the zebrafish embryo, only keratinocytes, mucous cells and ionocytes are directly exposed to the external environment. Ionocytes play an active role in the interaction of the embryo with its environment by maintaining osmotic homeostasis through active trans-epithelial ion transport (Hwang and Chou, 2013). These mitochondrion-rich cells become differentiated by 24 hours post-fertilization (hpf) and are scattered throughout the embryonic epidermis (Hwang and Chou, 2013; Jänicke et al., 2007; Kim et al., 2017, Dymowska et al., 2012; Hsiao et al., 2007). Ionocytes will become restricted to the gills upon development of functional gills postembryonic development, but during embryonic stages, ionoregulation of the fish is achieved through epidermal ionocytes (Hwang and Chou, 2013).
Zebrafish ionocytes have been demonstrated to share functional similarities with mammalian kidney cells (Chang and Hwang, 2011). The four types of ionocytes include K+-secreting (KS) cells, Na+/Cl− cotransporter-expressing (NCC) cells, Na+/K+-ATPase-rich (NaR) cells, and H+-ATPase-rich (HR) cells (Hwang and Chou, 2013). Although ionocyte subtypes do not directly correspond to renal cell subtypes, ion transport functions can be divided between ionocytes similarly to those between renal cells. For example, HR cells secrete H+ like intercalated cells (ICs) and absorb Na+ like proximal tubular (PT) cells (Lin et al., 2006; Purkerson and Schwartz, 2007; Horng et al., 2009; Wagner et al., 2009; Lee et al., 2011).
In this study, we examined whether zebrafish ionocytes might also share other types of similarity in transport function with kidney cells. In addition to ion transport, mammalian kidney cells also play key roles in xenobiotic elimination, through the action of ATP-Binding Cassette (ABC) transporters (Giacomini et al., 2010). ABC transporters with xenobiotic transport (XT) activity typically are associated with one of three subfamilies: ABCB (P-glycoprotein [P-gp]), ABCC (multidrug resistance protein [MRP]), and ABCG (breast cancer resistance protein [BCRP]) (Dean et al., 2001). These efflux transporters are highly enriched not only in the kidney but also at other major barrier epithelia including the liver, intestine, and blood-brain barrier (Giacomini et al., 2010; Leslie et al., 2005). They have also been demonstrated to be important for xenobiotic defense in aquatic organisms (Smital and Sauerborn, 2002; Hamdoun et al., 2004; Epel et al., 2008) including zebrafish. Functional assays of MRP-like and P-gp-like activities have previously been employed in zebrafish embryos as well as an embryonic cell line (Long et al., 2011; Fischer et al., 2013; Tian et al., 2017).
The specific goal of this study was to determine whether embryonic zebrafish ionocytes have ABC transporter-mediated xenobiotic efflux activity, similar to that observed in mammalian renal cells. Applying a well-characterized method for examining ABC transporter efflux activity (Epel et al. 2008), we used fluorescent small molecule substrates of the xenobiotic transporters (reviewed in Gokirmak et al., 2014) and confocal microscopy to characterize cell type specific patterns of efflux and uptake. The results were supported by analysis of an existing single-cell RNA sequencing dataset, indicating that an ABCB/P-gp-like gene, is enriched in the ionocytes. Collectively, the results demonstrate the presence of xenobiotic transporter activity in zebrafish ionocytes and lay the groundwork for future investigation of the role of these cells in protection of the embryo.
Materials and Methods
Zebrafish.
Adult wild-type Danio rerio were maintained and bred according to standard protocols (Westerfield, 1995). Eggs were collected and cultured in 1x E3 embryo medium (5 mM NaCl, 0.17 mM KCl, 0.33 mM CaCl, 0.33 mM MgSO4). 60 μL of 1% MS-222 diluted in 1.5 mL E3 was used as an anesthetic for imaging. All zebrafish work was carried out according to protocols approved by the UCSD IACUC.
Chemicals.
All ABC transporter substrates and inhibitors used for this study are specific for mammalian ABC transporters but have been examined and reviewed in fish and sea urchins (Luckenbach et al., 2014; Gokirmak et al., 2014). A summary of substrate and inhibitr-transporter specificities can be found in Table S1 and Table S2. Cyclosporine A (CsA), dimethyl sulfoxide (DMSO), fluorescein diacetate (FDA), ethyl 3-aminobenzoate methanesulfonate (MS-222), mitoxantrone (MTX), MK571, PSC833, Rhodamine B (RhB), verapamil, and vinblastine were purchased from Sigma-Aldrich (St. Louis, MO, USA). Calcein-AM (CAM) was purchased from Biotium (Fremont, CA, USA). 2’,7’-bis(2-carboxyethyl)-5(and 6)-carboxyfluorescein-AM (BCECF-AM), chloromethylfluorescein-diacetate (CMFDA), concanavalin A (conA), 3,3’-dihexyloxacarbocyanine iodide [DiOC6(3), subsequently denoted as DiOC6 in this paper], and mitoTracker red CMXRos (mitoT) were purchased from Thermo Fisher Scientific (Waltham, MA, USA). Calcein was purchased from MP Biomedicals (Burlingame, CA, USA). All stock solutions were prepared in DMSO such that final DMSO concentrations in exposure media did not exceed 0.1%.
Assays to screen ABC transporter substrates in embryos and measure substrate accumulation in epidermal cells.
Embryos were dechorionated at approximately 24 hpf and placed in 24-well plates. Solutions for exposures were prepared in E3 medium. Six embryos per 1.5 mL of test solution (100 nM CAM, 100 nM DiOC6, 100 nM BCECF-AM, 100 nM RhB, 500 nM MTX, 100 nM CMFDA, 10 nM FDA) were incubated at 28°C for between 45–90 minutes depending on the substrate. Low exposure concentrations and timings of exposures were examined for each substrate to determine optimal substrate exposures for analyzing initial substrate accumulation patterns. Following incubation, embryos were rinsed five times with clean E3 to remove extracellular substrates, with exception of CAM, BCECF-AM, CMFDA and FDA which are only fluorescent upon intracellular modification and thus do not need to be removed prior to imaging. For whole-embryo time-lapses (Fig. 5), one embryo per 1.5 mL of test solution was placed on a Delta T dish and imaged every 10 minutes for 90 minutes. Dishes were kept at 28°C using a temperature-controlled microscope insert. Embryos were maintained after exposure and no developmental abnormalities were observed for 24 hours after exposure.
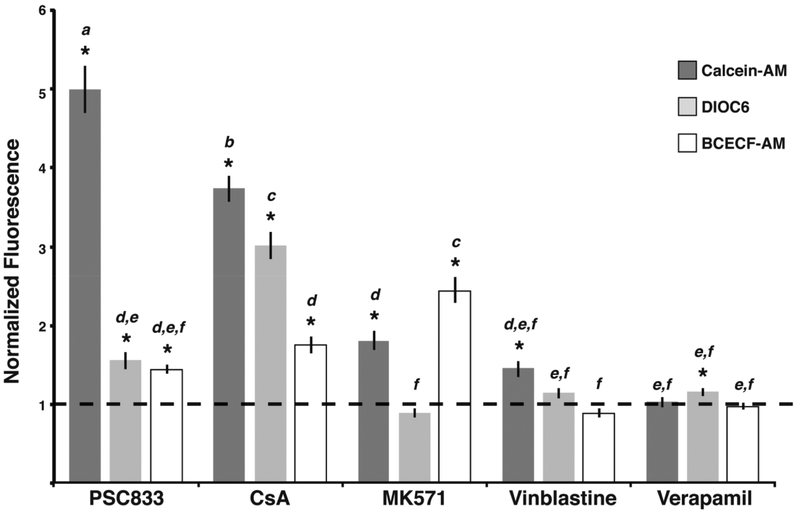
Figure 5. Effects of transporter inhibitors on accumulation of fluorescent substrates in ionocytes.
Substrate accumulation comparisons in epidermal cells following treatments with ABC transporter inhibitors calculated relative to controls. CAM efflux was significantly reduced by P-gp and MRP inhibitors (6 μM PSC833, 8 μM CsA, 7.5 μM MK571, 7.5 μM vinblastine, 5 μM verapamil). CAM efflux was most sensitive to PSC833 and CsA and secondarily sensitive to MK571. DiOC6 efflux was significantly affected by P-gp inhibitors (5 μM PSC833, 5 μM CsA, 5 μM MK571, 5 μM vinblastine, 5 μM verapamil) and was most sensitive to CsA and PSC833. Normalized fluorescence values reveal that BCECF-AM efflux was significantly affected by P- gp and MRP inhibitors (6 μM PSC833, 6 μM CsA, 7.5 μM MK571, 7.5 μM vinblastine, 5 μM verapamil). The data indicates that BCECF-AM efflux is most sensitive to MK571 and secondarily sensitive to CsA and PSC833. Values represent mean ± SEM (n = 60 cells). Significant increases in substrate relative to control are denoted with an * (p<0.05).
Assays to determine ionocyte subtypes with ABC transporter activity.
MitoTracker red (mitoT) was used to label ionocytes, and concanavalin A (conA) was used to label HR cells. Embryos were incubated with 500 nM mitoT and 0.005 mg/mL conA for 30 min. To ensure that ionocyte markers did not interfere with efflux assays, they were washed out of solution prior to addition of transporter substrates or inhibitors. Though MitoTracker Red has also been used as a substrate for ABC transporters, every embryo was treated with the same procedure and accumulation differences between substrates is still be observed. Embryos were then exposed to 100 nM of substrate for one hour (CAM), 15 min (DiOC6) or 45 min (BCECF-AM), with or without inhibitor.
Imaging.
Confocal imaging was performed with a Zeiss LSM 700 (Jena, Germany). Images were tile- and z-scanned to cover the entire embryo. Assays to screen ABC transporter substrates in embryos (Figs. 1–2, 7) and time-lapses (Fig. 4) were imaged with an EC Plan-Neofluar 10× 0.3NA objective. Images captured 6–9 sections at a thickness of 19 μm. Epidermal cell substrate accumulation assays (Figs. 3, 5, 8) and ionocyte colocalization assays (Fig. 6) were imaged with a Plan-Apochromat 20× 0.8 NA objective. Images captured 3–6 sections at a thickness of 19 μm for epidermal cell substrate accumulation assays (Figs. 3, 5) and 20–25 sections at a thickness of 4 μm for ionocyte colocalization assays (Figs. 6). Fluorescence illumination was kept to a minimum to avoid photobleaching.
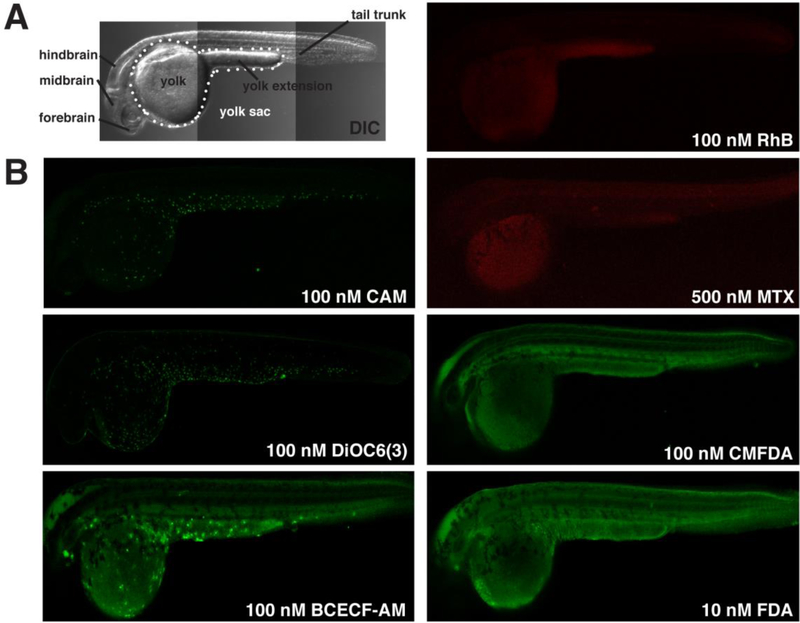
Figure 1. CAM, DiOC6, and BCECF-AM accumulate in epidermal cells.
Lateral views of zebrafish embryos at approximately 24 hpf. (A) Transmitted light (DIC) image summarizes anatomical regions we studied. (B) Micrographs show representative patterns of accumulation of ABC transporter substrates and substrate derivatives. Calcein, DiOC6, and BCECF accumulate in epidermal cells on the yolk sac and tail. RhB and MTX accumulate primarily in the yolk sac. CMFDA and FDA are broadly distributed throughout the embryo.
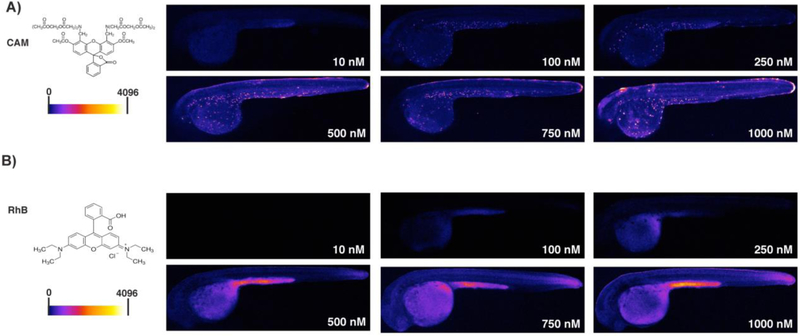
Figure 2. Localization patterns of calcein and RhB are not concentration-dependent.
Lateral views, as in Figure 1, of embryos exposed to 10 – 1000 nM CAM. (A) Chemical structure of CAM and heat map fluorescence intensity range (left). Heat map images (right) reveal a consistent pattern of calcein accumulation in epidermal cells over a wide range of exposure concentrations. (B) Structure of RhB and heat map fluorescence intensity range (left). Heat map images (right) reveal a consistent RhB accumulation pattern in the yolk sac over the range of exposure concentrations. Yolk sac accumulation was apparent beginning at 100 nM, and the accumulation pattern of RhB was not dependent on the concentration of RhB exposure from 100 – 1000 nM.
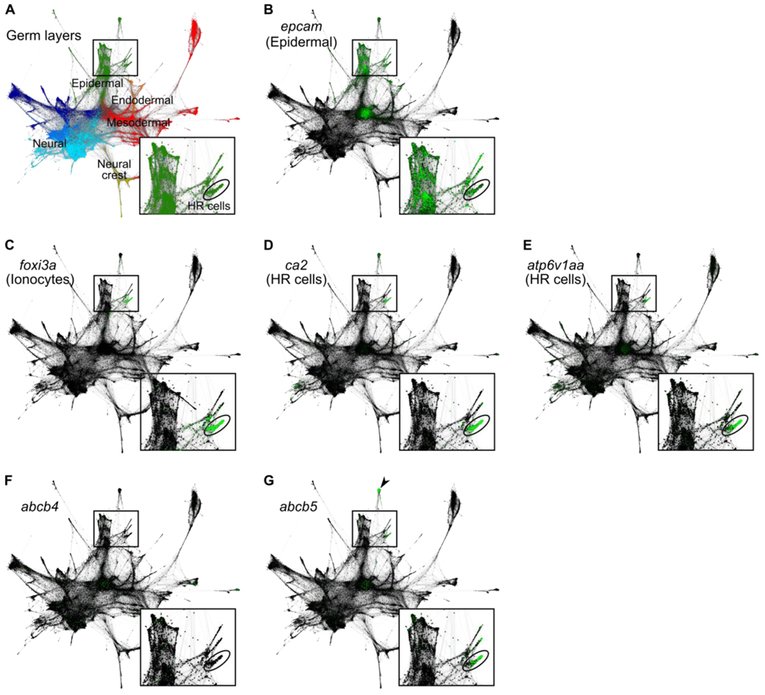
Figure 7. abcb5 is enriched in HR cells of 24 hpf embryos.
SPRING-derived graphs (adapted from Wagner et al., 2018) depict single-cell RNA sequencing data from several timepoints during the first day of zebrafish development (4, 6, 8, 10, 14, 18, and 24 hpf). Each node represents a cell, each connecting line represents a nearest neighbor connection. Least differentiated cells (i.e. cells from 4 hpf embryos) cluster in the center, whereas most differentiated cells (i.e. cells from 24 hpf embryos) cluster in the periphery. Low magnification images encompass the entire dataset; boxed insets show magnified views of certain epidermal populations, including 24 hpf HR cells (circled). (A) Differences in gene expression among single cells allow for inference of germ layer subpopulations, including the epiderm (green). (B-E) Single-cell graphs depicting enrichment of marker genes in green: the epidermal marker, epcam (B), the ionocyte marker, foxi3a (C), the HR cell markers, ca2 (D) and atp6v1aa (E). (F) Single-cell graph depicting the lack of enriched expression of abcb4 in ionocytes. (G) Single-cell graph depicting the enrichment of abcb5 expression in presumptive HR cells. abcb5 expression is also enriched in cells of the enveloping layer (arrowhead). Expression data from Wagner et al., 2018; graphs generated using SPRING software (Weinreb et al., 2017).
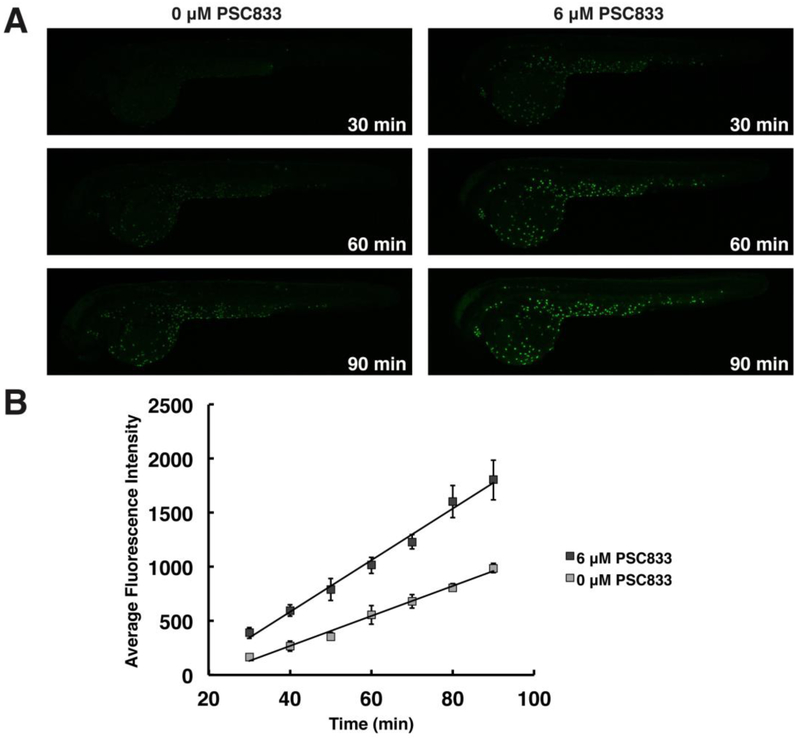
Figure 4. PSC833 increases the rate of calcein accumulation in epidermal cells.
Lateral views, as in Figure 1, of embryos exposed to 100 nM CAM alone or with PSC833, over time. (A) Fluorescent micrographs compare calcein accumulation in control embryos (left) and PSC833-treated embryos (right) from 30 – 90 min of exposure. (B) Average fluorescence intensities of epidermal cells indicate the rate of accumulation of calcein in PSC833-treated embryos (dark gray; y = 23.894x - 372.63, R2 = .99079) compared to the rate in controls (light gray; y = 13.874x - 286.51, R2 = .99089). Values represent mean ± SEM (n = 3 embryos/treatment, 5 cells/embryo).
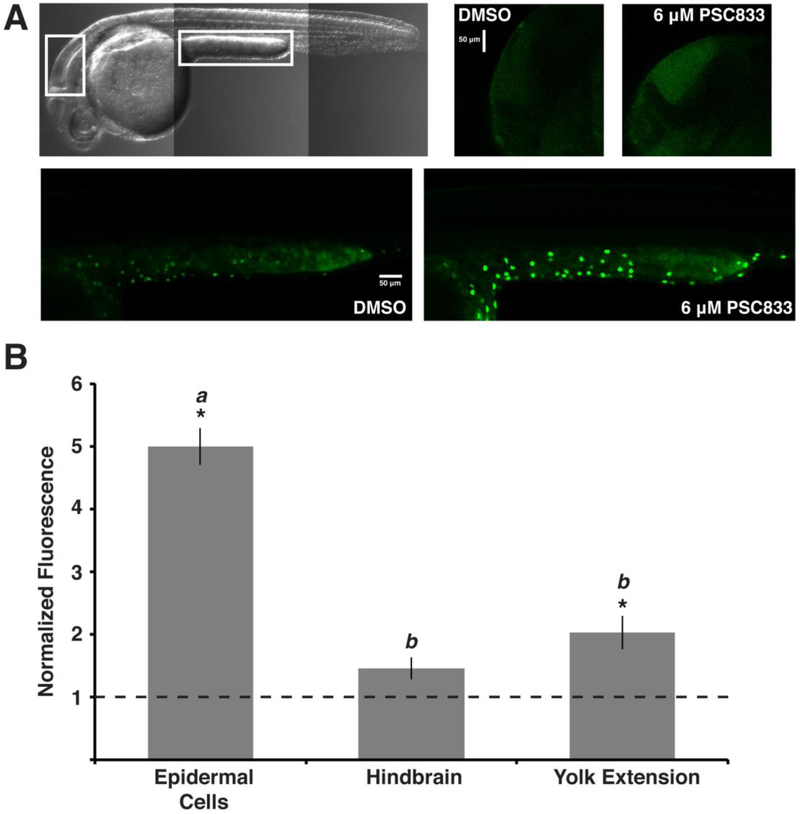
Figure 3. Epidermal cell calcein accumulation increases in the presence of the ABCB transporter inhibitor, PSC833.
Lateral views, as in Figure 1, of embryos exposed to 100 nM CAM with either DMSO or PSC833. (A) Transmitted light image highlights regions analyzed. Images of hindbrains (right) and yolk extensions (bottom) compare fluorescence intensity of calcein in embryos treated with DMSO or PSC833. (B) Inhibitor treatment significantly increased calcein fluorescence in epidermal cells and the yolk extension. Values represent mean ± SEM (n = 60 cells, n = 12 regions). Letters denote significance groups based on Tukey-Kramer method. Student’s t-test, *p < 0.01.
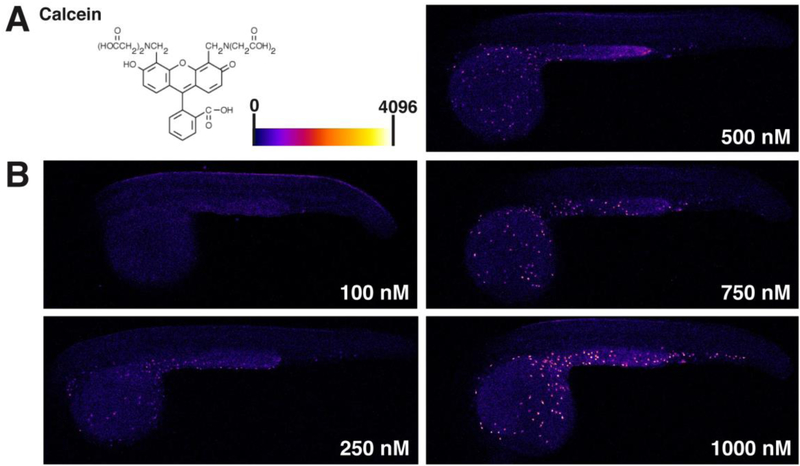
Figure 8. Free calcein accumulates in HR cells.
Lateral views, as in Figure 1, of embryos exposed to 100 – 1000 nM calcein. (A) Structure of calcein (left) and heat map fluorescence intensity range (right). (B) Heat map images reveal a consistent calcein accumulation pattern in epidermal cells over the range of exposure concentrations. Epidermal cell accumulation was apparent beginning at 250 nM. Accumulation of calcein was not dependent on concentration of calcein exposure from 250 – 1000 nM.
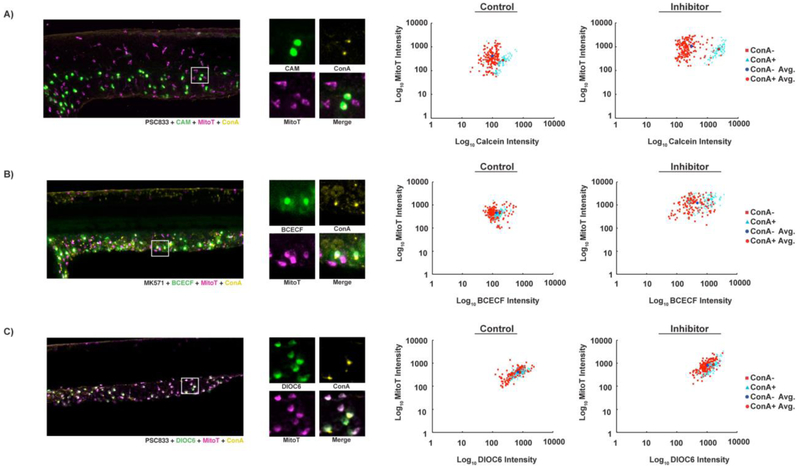
Figure 6. Calcein and BCECF accumulate in HR cells, and DiOC6 accumulates in MR cells.
Confocal projections of embryos exposed to ABC transporter substrate (green), general ionocyte marker mitoT (magenta), and HR cell marker conA (yellow). Graphs indicate fluorescence intensity of epidermal cells in arbitrary fluorescence units. (A) Calcein accumulates to higher levels in mitoT+/conA+ than mitoT+/conA- cells in both absence (p < 0.0001, n = 251 cells from 3 embryos) and presence of PSC833 (p < 0.0001, n = 264 cells from 3 embryos). (B) BCECF accumulates in mitoT+/conA+ cells and some but not all mitoT+/conA- cells. BCECF intensity is significantly different in conA- and conA+ cells in the absence (p = 0.0025, n = 238 cells from 3 embryos) and presence of MK571 (p < 0.0001; n = 214 cells from 3 embryos). (C) DiOC6 accumulates in all mitoT+ cells and is significantly different in conA- and conA+ cells in the absence (p = 0.0076, n = 246 cells from 3 embryos) and presence of PSC833 (p < 0.0001; n = 258 cells from 3 embryos).
Image Analysis.
All images shown are maximum intensity z projections. Quantitative analysis was performed with ImageJ on the FIJI platform (Schindelin et al., 2012). Heat map images (Figs. 2, 7) were generated with a 12-bit “Fire” Lookup Table (LUT) on ImageJ in which average fluorescence intensity corresponds to a heat map range of black (0) to white (4096).
To examine substrate accumulation in embryonic regions (Fig. 3), we measured the average fluorescence of the hindbrain and the yolk extension from maximum intensity z projections for each embryo. To examine substrate accumulation in epidermal cells, we measured the average fluorescence of five epidermal cells from maximum intensity z projections (Figs. 4, S1) or from slices of a captured stack (Figs. 3, 5, 8) that appeared to be completely flat within the plane of view for each embryo. To control for background fluorescence, we measured the average fluorescence of a region external to each embryo and subtracted this value from the fluorescence measurements taken in individual cells or embryonic regions. Manual cell circling methods were used to identify cell boundaries using the background of fluorescence.
To analyze the effect of inhibitors on substrate accumulation in epidermal cells and embryonic regions (Figs. 3, 5), inhibitor-treated cells were normalized to the average of the corresponding control cells. Figures present the normalized fluorescence of each inhibitor treatment. The total number of inhibitor-treated epidermal cells analyzed relative to their corresponding control groups can be found in figure legends. To analyze substrate accumulation in epidermal cells over time (Fig. 4), fluorescence values were averaged for each embryo at each time point examined to create accumulation rates for each embryo. The average accumulation rates for three embryos are shown.
To analyze accumulation differences in ionocyte populations (Fig. 6), every mitoT+ cell from maximum intensity z projections was measured for its substrate average fluorescence and mitoT average fluorescence. To control for background fluorescence, we measured regions external to each embryo and subtracted these values from a cell’s substrate and mitoT fluorescence intensities. Each mitoT+ cell was marked as conA+ or conA-, and average fluorescence values were plotted on a logarithmic scale.
Generation of single-cell graphs.
To assess whether abcb5 is expressed in HR cells of 24 hpf zebrafish embryos, we utilized a previously published single-cell RNA sequencing dataset (Wagner et al., 2018) and corresponding software, SPRING (Weinreb et al., 2017; https://kleintools.hms.harvard.edu/paper_websites/wagner_zebrafish_timecourse2018/mainpage. html). Within SPRING, the enrichment of a gene in a specific cell population is given as a z-score, i.e. the number of standard deviations from the mean expression of that gene. Epidermal cells were identified by the enrichment of epcam (z-score = 1.415). Ionocytes were identified by the enrichment of foxi3a (z-score = 9.145). HR cells, identified by the enrichment of ca2 and atp6v1aa (z-scores = 12.097 and 13.389, respectively), were enriched with abcb5 (z-score = 5.461).
Statistics.
Statistics were performed with JMP®, Version 14.0.1. SAS Institute Inc., Cary, NC, 1989–2007. Data are presented as the mean ± SEM and were compared by Student’s t-test (Fig. 3, 5, 6, 8) or by one-way ANOVA and post hoc Tukey-Kramer Method (Fig. 3, 5). Assays to screen ABC transporter substrates in embryos were conducted with four embryos per experiment and from two independent clutches of embryos (Fig. 2, 7, S1). Assays to measure substrate accumulation in epidermal cells (Figs. 3, 5, 8) were conducted with four embryos per clutch and repeated with three clutches. Time-lapse experiments (Fig. 4) and ionocyte colocalization assays (Fig. 6) were conducted with three embryos per treatment.
Results
Calcein, DiOC6, and BCECF accumulate in epidermal cells.
ABC transporter activity can be monitored using fluorescent small molecule substrates of ABC transporters (Epel et al., 2008; Strouse et al., 2013; Luckenbach et al., 2014; Gokirmak et al., 2014). Here, we used six fluorescent small molecules to determine transporter activity in 24 hpf zebrafish embryos, the stage at which epidermal ionocytes become functional (Hwang and Chou 2013). These included 3,3’-Dihexyloxacarbocyanine iodide (DiOC6) and rhodamine B (RhB), which are P-gp/ABCB substrates, 2’,7’-bis(2-carboxyethyl)-5(6)-carboxyfluorescein-AM (BCECF-AM), calcein-AM (CAM), chloromethylfluorescein diacetate (CMFDA) and fluorescein diacetate (FDA), which are both P-gp/ ABCB and MRP/ABCC substrates, and mitoxantrone (MTX) which is a BCRP/ABCG2 substrate (Table S1). BCECF-AM, CAM, CMFDA, and FDA are nonfluorescent ABC transporter substrates but become fluorescent upon intracellular modification. For BCECF-AM and CAM in particular, general cytosolic esterases will cleave acetyloxymethyl ester (AM) groups from BCECF-AM and CAM, leaving behind fluorescent membraneimpermeable derivatives BCECF and calcein inside a cell (Homolya et al., 1993).
The results revealed three distinct accumulation patterns. RhB and MTX accumulated primarily in the yolk sac as opposed to other regions of the embryo (Fig. 1B). With CMFDA and FDA, the whole embryo labeled with fluorophore, and no region of the embryo appeared to preferentially accumulate fluorescent derivatives (Fig. 1B). CAM, DiOC6, and BCECF-AM, however, resulted in epidermal cell-specific accumulation patterns (Fig. 1B). Calcein and BCECF accumulation were more restricted to a subset of these cells, compared to the accumulation of DiOC6.
Previous studies also used CAM and RhB to explore XT activity in the zebrafish embryo, with similar observations to those in Figure 1. Specifically, RhB primarily collected within the yolk sac, and some epidermal cell-specific accumulation of calcein along the yolk sac was apparent (Fischer et al., 2013). Given that CAM and RhB have different passive permeation and transport rates (Cole et al., 2013), we wanted to test whether these differences in the CAM and RhB accumulation patterns (Fig. 1) might simply be a consequence of the concentration of substrate used. To determine whether alternative accumulation patterns would be observed from low to high concentrations of substrate, we exposed embryos to CAM or RhB at concentrations between 10 nM and 1000 nM and analyzed accumulation patterns in the embryo.
The results indicated that the epidermal cell-specific pattern of calcein accumulation is seen beginning at external concentrations of 100 nM (Fig. 2A). We also observed low levels of calcein in other areas of the embryo, such as the hindbrain and yolk extension at high concentrations (1000 nM). In contrast, at no concentration examined did RhB exhibit the CAM-like, cell-specific accumulation pattern (Fig. 2B). RhB accumulation in the embryo became apparent starting at 100 nM but was distributed throughout the yolk sac before expanding throughout the rest of the embryo. Collectively, the results indicated that the different accumulation pattern of CAM and RhB were not consequences of differences in exposure concentration used for the two molecules.
Inhibitors of P-gp and MRP proteins increase CAM, DiOC6, and BCECF-AM accumulation in epidermal cells.
Since CAM has been shown to be a zebrafish P-gp/abcb4 substrate (Fischer et al., 2013), we decided to test whether its level or rate of accumulation in the epidermal cells was affected by presence of XT inhibitors. We initially focused on PSC833, a cyclosporine derivative and highly specific inhibitor of P-gp (Atadja et al, 1998). PSC833 inhibits efflux of ABCB transporter substrates such as CAM, and thus cells expressing these transporters are expected to have higher intracellular accumulation of calcein in the presence of the inhibitor.
Consistent with the hypothesis that the bright epidermal cells might have an ABCB transporter, we found PSC833 to increase calcein accumulation significantly (Fig. S1). To further examine differences in accumulation, we exposed embryos to CAM with 6 μM PSC833 or DMSO control and measured the relative change in substrate accumulation in the epidermal cells, the hindbrain, and the yolk extension (Fig. 3). The largest increase from DMSO controls to PSC833-treated embryos was seen in the epidermal cells (5.0-fold), and this was significantly higher than the increase in the hindbrain (1.5-fold) and the yolk extension (2-fold).
To determine the efflux rates in substrate-accumulating epidermal cells, we conducted 90-minute time-lapses of embryos exposed to CAM with and without PSC833. Differences in epidermal cell accumulation were already more evident in PSC833-treated embryos as early as 30 minutes following exposure (Fig. 4A). Embryos exposed to CAM alone accumulated calcein in the epidermal cells at a rate of 13.87 arbitrary fluorescence units (AFU)/cell/min. Embryos treated with PSC833 accumulated calcein in the epidermal cells at a rate of 23.89 AFU/cell/min, almost double the rate of embryos without inhibitor (Fig. 4B). These results indicated that epidermal cells have a PSC833-sensitive (i.e. P-gp-like) ABC transporter activity that plays a significant role in reducing their CAM accumulation.
Next, we expanded our screen of inhibitors and substrates to DiOC6 and BCECF-AM and the P-gp inhibitors (PSC833, CsA, vinblastine and verapamil) or the MRP inhibitor MK571 (Table S2). Inhibitor concentrations were determined through analysis of average fluorescence intensities of substrates as in Fig. S1. The results revealed three unique inhibitor interaction profiles between CAM, DiOC6, and BCECF-AM. CAM efflux in epidermal cells was significantly inhibited by both P-gp and MRP inhibitors (Fig. 5). The largest increases in calcein accumulation from DMSO controls were observed with PSC833 (5.0-fold) and CsA (3.7-fold), followed by MK571 (1.8-fold). DiOC6 accumulation was also significantly increased in the presence of PSC833 and CsA, but unlike CAM was insensitive to MK571 (Fig. 5). Finally, BCECF-AM efflux was significantly inhibited by PSC833, CsA, and MK571 (Fig. 5). MK571 resulted in the largest increase in BCECF accumulation (2.4-fold), followed by CsA (1.7-fold) and PSC833 (1.4-fold). Epidermal cell efflux of all three substrates was largely unaffected by presence of vinblastine or verapamil. The most significantly different groups from this screen, CAM-PSC833, CAM-CsA, DiOC6-CsA, and BCECF-AM-MK571, indicate the presence of P-gp-type (ABCB-) and MRP-type (ABCC-) transport mechanisms.
Calcein and BCECF preferentially accumulate in the HR cell type of zebrafish ionocytes while DiOC6 accumulates in all mitochondria-rich (MR) cells.
Next, we sought to precisely determine the specific type of epidermal cell that accumulated and effluxed the XT substrates. Because DiOC6 is both a XT substrate and mitochondrial probe, we hypothesized that the epidermal cells loading with this substrate could be the ionocytes as they are enriched in mitochondria. To test this hypothesis, we colocalized ionocyte markers with CAM, DiOC6, and BCECF-AM and tested the impact of inhibitors on these accumulation patterns. It has been previously shown that mitochondria-rich (MR) cells will accumulate the fluorescent marker MitoTracker (mitoT) (Esaki et al., 2006), while the HR cell type will specifically label with the fluorescent marker concanavalin A (conA) (Lin et al., 2006; Van Der Heijden et al., 1997).
Calcein and BCECF colocalized most strongly with conA+ cells (Figs. 6A, B), indicating that calcein and BCECF are primarily taken up by the HR ionocyte. BCECF also appeared to colocalize with another epidermal cell type, for which we do not yet have a definitive marker. After exposure to ABC transporter inhibitors, differences between HR cells (conA+) and other ionocyte subtypes (conA-) became more apparent, with calcein accumulating 7.6 times more (Fig. 6A) and BCECF accumulating 2.3 times more in HR cells than in other ionocyte subtypes (Fig. 6B). Though some conA- cells also accumulated more calcein and BCECF in the presence of inhibitor, the magnitude of increase smaller than that observed in the conA+ population, indicating presence of different efflux or uptake mechanisms in these cells. In contrast to calcein and BCECF, DiOC6 colocalization was not restricted to conA+ cells (Fig. 6C). We observed DiOC6 to colocalize with every ionocyte (mitoT+). In addition, PSC833 treatment did not reveal the stark differences between DiOC6 accumulation in conA+ and conA- cells (Fig. 6C) that was observed in embryos exposed to CAM or BCECF-AM (Figs. 6A, B). In the presence of PSC833, the increase in DiOC6 accumulation from DMSO controls in conA+ cells (2.0-fold) was only slightly greater than the accumulation increase in conA- cells (1.5-fold).
Expression of transporters in the HR ionocytes.
Given that the HR subtypes appeared to efflux lipophilic small molecules substrates of XTs and were sensitive to the the P-gp inhibitor PSC833, we next asked whether either of the known zebrafish P-gp-like genes, abcb4 and abcb5 (Fischer et al. 2013), are expressed in these cells. For this analysis, we utilized a recently published single-cell RNA sequencing dataset that analyzed single-cell transcriptomes from zebrafish embryos at several stages of development (Wagner et al., 2018). We used previously established marker genes to identify ionocytes (foxi3a; Jänicke et al., 2007, 20; Fig. 7C) and, more specifically, HR cells (ca2 and atp6v1aa; Lin et al., 2008; Ito et al., 2013; Jänicke et al., 2007; Fig. 7D, E). In agreement with previous in situ hybridization data that demonstrated broad expression throughout the embryo (Fischer et al., 2013), we found that abcb4 is not particularly enriched in epidermal cell types (Fig. 7F). In contrast, abcb5 is highly enriched in HR cells (Fig. 7), positioning it as a candidate efflux transporter in HR cells.
Free calcein anion is taken up by HR cells and its accumulation is unaffected by PSC833.
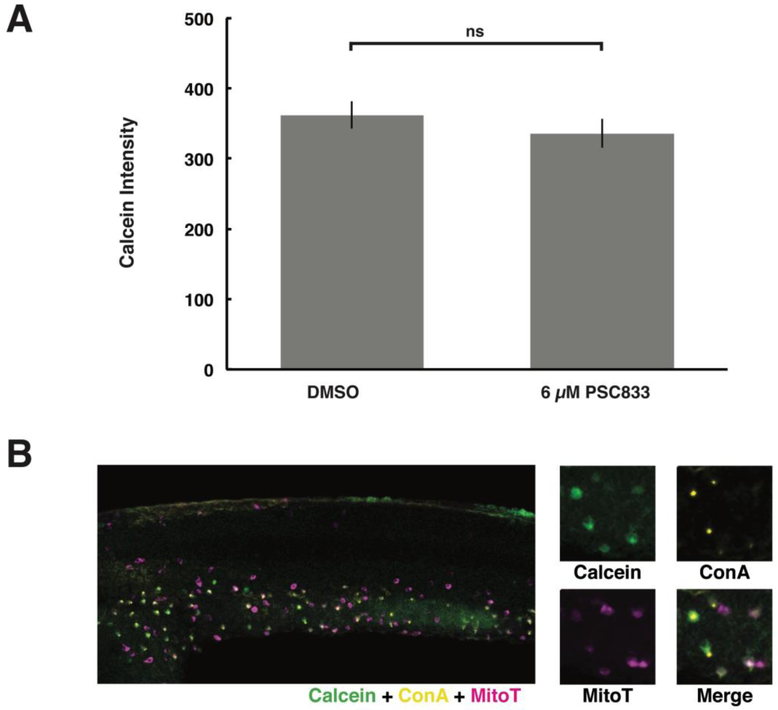
Finally, given that our results indicated that HR cells have a XT efflux activity yet also appear to have a higher basal accumulation of calcein, we sought to further explore why this molecule selectively concentrates in HR ionocytes (Fig. 6A). It has been recently shown that zebrafish possess organic anion transporters (OATs) that can actively take up anions from the surrounding medium (Dragojević et al., 2018). To determine if HR cells might have similar mechanisms to take up calcein in its cell-impermeant, organic anion form, we examined embryos following exposure to free calcein. Indeed, free calcein accumulated in HR cells (Fig. 8) within the same range of exposure concentrations as tested for CAM (Fig. 2A). In addition, upon treatment with PSC833, no significant difference was observed in HR cell-accumulation of calcein (Fig. 9) – consistent with the notion that P-gp like transporters efflux the more lipophilic CAM and not the calcein anion. Collectively, these results indicated that HR cells might take up calcein through an uptake pathway independent of the XT-mediated efflux pathway.
Figure 9. Inhibition of ABCB4/5 does not affect free calcein accumulation in HR cells.
Free calcein accumulation comparison in ionocytes following treatment with PSC833 and lateral views, as in Figure 1, of embryos exposed to free calcein (green), general ionocyte marker mitoT (magenta), and HR cell marker conA (yellow). (A) Average fluorescence intensities indicate that HR cell accumulation of free calcein was not affected by treatment with PSC833. Values represent mean ± SEM (n = 60 cells/treatment). Student’s t-test, ns denotes nonsignificant. (B) Fluorescent micrographs reveal that free calcein accumulates in mitoT+/conA+ cells. Embryos were labeled as in Fig. 6.
Discussion
In this study, we examined accumulation and efflux patterns of ABC transporter substrates in the zebrafish embryonic epidermis using confocal microscopy. The power of this approach is the ability to examine transporter activity in specific subtypes of cells within the embryo. Consistent with what has been previously reported for CAM and RhB (Fischer et al., 2013), one of the most striking patterns observed with these molecules is the selective retention of some small fluorescent molecules (such as calcein) in ionocytes with the contrasting absence of others (RhB).
Importantly, we showed here that this selective retention is not simply an artifact of how the substrates are used, such as differences in concentration (Fig. 2). We then further considered whether distribution differences between dye were due to the molecular characteristic of the substrates or due to unique features of the ionocyte itself. One of these alternatives we considered is that RhB could end up in the yolk simply because it is more lipophilic than calcein. However, we did not observe DiOC6 in yolk even though it is also lipophilic. In addition both FDA and CMFDA were detected in the yolk region, both of which are more hydrophilic than RhB (Fig. 1). Another alternative explanation for these observations could be that higher accumulation of AM dyes is the result of a higher level of esterase activity in HR cells, but esterase activity is typically not rate-limiting (Cole et al., 2013) and DiOC6, which is not cleaved by esterases, also accumulated in the ionocytes in a transporter-inhibitor sensitive manner. Thus, active uptake and efflux mechanisms in the ionocyte are the most plausible explanation of these observations.
This study sheds some preliminary light on the potential nature of the efflux mechanism in ionocytes. Zebrafish have at least 11 ABC transporter homologs that could participate in drug efflux (Annilo et al., 2006; Luckenbach et al., 2014). Homologs of P-gp (ABCB1) and MRP (ABCC1/C2) account for the major transport activities in most embryos studied (Toomey and Epel, 1993; Hamdoun and Epel, 2007; Epel et al., 2008). Consistent with this expectation, inhibitors of P-gp caused significant increases in accumulation of CAM and DiOC6, which are P-gp transporter substrates, in the ionocytes (Fig. 5A, B). Similarly, the accumulation of BCECF-AM, typically considered an MRP substrate, was increased by addition of MK571 (Fig. 5C).
Our results indicate that abcb5 is likely to be a XT in zebrafish ionocytes, although, like renal cells, the phenotypes observed likely arise from the action of multiple transporters. Zebrafish lack an abcb1 ortholog, and abcb4 and abcb5 have been identified as the P-glycoproteins in zebrafish (Fischer et al., 2013). Efflux of RhB has been shown to be mediated by abcb4 which is ubiquitously expressed throughout the embryo (Fischer et al., 2013). Our results and those of the previous study suggest that the accumulation of ABC transporter substrates in ionocytes is not mediated by the same mechanism that handles RhB. Indeed, neither inhibitors nor gene knockdown shifted the accumulation of RhB from the yolk sac to the ionocytes (Fischer et al., 2013), indicating that the efflux mechanism for CAM, DiOC6, and BCECF-AM is distinct from that of RhB. abcb5 is an attractive candidate transporter in the efflux of ionocyte-accumulating ABC transporter substrates. In addition to its expression in the epidermal superficial stratum (Thisse et al., 2004), our analysis of a recent single-cell RNA sequencing dataset shows that abcb5 is enriched in ionocytes of the 24 hpf embryo (Wagner et al., 2018; Fig. 7). Further studies will need to investigate the functional role for abcb5 in this process, as well as other P-gp and MRP proteins present in ionocytes. Additionally, a recent study has demonstrated that zebrafish have OATs that can take up fluorescent small molecules (Dragojević et al., 2018), but the specific location and function of these transporters in the embryo remains to be determined. It is conceivable that one or more of these transporters, along with abcb5, is responsible for the uptake and efflux pattern observed in HR cells.
Ionocytes have been previously compared to mammalian renal cells with regard to their role in ion homeostasis. The uptake and efflux activities we have observed in ionocytes suggest that ionocytes share additional functions and similarities with mammalian renal cells. Specifically, these additional functions could relate to detoxification, as mammalian renal cells are enriched with XTs, including P-gp and MRPs, as well as uptake transporters such as OATs (Giacomini, 2010). The differences among ionocyte subtypes are also reminiscent of the mammalian kidney, which exhibits XT, and ion transport, expression differences between renal cell types (Peng et al., 1999; Kojima et al., 2002; Huls et al., 2008).
The overarching implication of this study is that zebrafish ionocytes may play an important role in toxicant defense for the zebrafish embryo. Though the data presented in this study suggest a plausible role for ionocytes in toxicant defense, the exact physiological implication of xenobiotic transporter function in zebrafish ionocytes remains unclear. A role for ionocytes in protection from xenobiotics aligns well with the conclusion of previous studies that have also suggested a role for these cells in embryo protection. For instance, when exposed to silver nanoparticles, enhanced gstp expression was observed to colocalize with ionocytes (Osborne et al., 2016), and glutathione conjugates are major substrates for ABCC transporters (Deeley et al., 2006; Slot et al., 2011; Luckenbach et al., 2014). Being one of the few cell types directly exposed to the external environment during embryonic development, ionocytes could represent a direct pathway for small, hydrophobic molecules to be removed from the embryo and effluxed into the environment. When internal barrier tissues are not yet fully functional, ionocytes may behave like renal cells to protect zebrafish embryonic development. However, ionocyte XTs could also be used to efflux an endogenous metabolite(s), protect ionocytes themselves, or act to reduce overall xenobiotic concentrations. Further studies will be needed to characterize the “transportome” of the ionocytes and distinguish among their functional roles.
Supplementary Material
Highlights.
Zebrafish embryo ionocytes are specialized epidermal cells involved in ion transport/homeostasis.
Ionocytes actively transport fluorescent small molecules known to be substrates of xenobiotic transporters.
An ABC transporter, ABCB5, is expressed in the HR ionocyte subtype, consistent with the observed efflux activity.
Transporter activity in the ionocytes could help eliminate toxic small molecules from the zebrafish embryo.
Acknowledgements
We are grateful to Drs. Laszlo Homolya, Victor D. Vacquier, Sascha Nicklisch, and Catherine Schrankel, as well as Katherine Nesbit and Hannah Rosenblatt (Scripps Institution of Oceanography, UCSD) for constructive discussions and assistance throughout this work. We thank Dr. Martin Tresguerres (Scripps Institution of Oceanography, UCSD) for providing MitoTracker and Tami Sanchez (Division of Biological Sciences, UCSD) for zebrafish care. Thank you to the David Marc Belkin Memorial Research Scholarship for Environment and Ecology of UC San Diego’s Undergraduate Research Scholarship (URS) program for support of WG.
Funding
This work was supported by NIH ES021985 and NSF OCE13144080 to AH and NIH R01 HL133166 to DY.
Footnotes
Publisher's Disclaimer: This is a PDF file of an unedited manuscript that has been accepted for publication. As a service to our customers we are providing this early version of the manuscript. The manuscript will undergo copyediting, typesetting, and review of the resulting proof before it is published in its final citable form. Please note that during the production process errors may be discovered which could affect the content, and all legal disclaimers that apply to the journal pertain.
Conflict of Interest
No conflicts of interest, financial or otherwise, are declared by the author(s).
References
- Annilo T, Chen Z-Q, Shulenin S, Costantino J, Thomas L, Lou H, Stefanov S and Dean M (2006). Evolution of the vertebrate ABC gene family: analysis of gene birth and death. Genomics. 88, 1–11. [DOI] [PubMed] [Google Scholar]
- Atadja P, Watanabe T, Xu H and Cohen D (1998). PSC-833, a frontier in modulation of P-glycoprotein mediated multidrug resistance. Cancer and Metasasis Reviews. 17, 163–168. [DOI] [PubMed] [Google Scholar]
- Chang WJ and Hwang PP (2011). Development of Zebrafish Epidermis. Birth Defects Research. 93, 205–214. [DOI] [PubMed] [Google Scholar]
- Cole BJ, Hamdoun A and Epel D (2013). Cost, effectiveness and environmental relevance of multidrug transporters in sea urchin embryos. J Exp Biol. 216, 3896–3905. [DOI] [PMC free article] [PubMed] [Google Scholar]
- Dean M, Rzhetsky A and Allikmets R (2001). The human ATP-Binding cassette (ABC) transporter superfamily. Genome Res. 11, 1156–1166. [DOI] [PubMed] [Google Scholar]
- Deeley RG, Westlake C and Cole SPC (2006). Transmembrane transport of endo-and xenobiotics by mammalian ATP-binding cassette multidrug resistance proteins. Physiol. Rev 86, 849–899. [DOI] [PubMed] [Google Scholar]
- Dragojević J, Mihaljević I, Popović M, Zaja R and Smital T (2018). In vitro characterization of zebrafish (Danio rerio) organic anion transporters Oat2a-e. Toxicology in Vitro. 46, 246–256. [DOI] [PubMed] [Google Scholar]
- Dymowska AK, Hwang PP and Goss GG (2012). Structure and function of ionocytes in the freshwater fish gill. Respiratory Physiology & Neurobiology. 3, 282–292. [DOI] [PubMed] [Google Scholar]
- Epel D, Luckenbach T, Stevenson CN, Macmanus-Spencer LA, Hamdoun A and Smital T (2008). Efflux transporters: newly appreciated roles in protection against pollutants. Environ Sci Technol. 42, 3914–3920. [DOI] [PMC free article] [PubMed] [Google Scholar]
- Esaki M, Hoshijima K, Kobayashi S, Fukuda H, Kawakami K and Hirose S (2007). Visualization in zebrafish larvae of Na+ uptake in mitochondria-rich cells whose differentiation is dependent on foxi3a. Am J Physiol Regul Integr Comp Physiol. 292, R470–480. [DOI] [PubMed] [Google Scholar]
- Fardel O, Le Vee M, Jouan E, Denizot C and Parmentier Y (2015). Nature and uses of fluorescent dyes for drug transporter studies. Expert Opin Drug Metab Toxicol. 11, 1233–1251. [DOI] [PubMed] [Google Scholar]
- Fischer S, Klüver N, Burkhardt-Medicke K, Pietsch M, Schmidt AM, Wellner P, Schirmer K and Luckenbach T (2013). Abcb4 acts as multixenobiotic transporter and active barrier against chemical uptake in zebrafish (Danio rerio) embryos. BMC Biology. 11:69. [DOI] [PMC free article] [PubMed] [Google Scholar]
- Giacomini KM, Huang SM, Tweedie DJ, Benet LZ, Brouwer KLR, Chu X, Dahlin A, Evers R, Fischer V, Hillgren KM, et al. (2010). Membrane transporters in drug development. Nat Rev Drug Discov. 9, 215–236. [DOI] [PMC free article] [PubMed] [Google Scholar]
- Gökirmak T, Shipp LE, Campanale JP, Nicklisch SCT and Hamdoun A (2014). Transport in technicolor: mapping ATP-binding cassette transporters in sea urchin embryos. Mol. Reprod. Dev 81, 778–793. [DOI] [PMC free article] [PubMed] [Google Scholar]
- Gottesman MM, Fojo T and Bates SE (2002). Multidrug resistance in cancer: Role of ATP-dependent transporters. Nat Rev Cancer. 2, 48–58. [DOI] [PubMed] [Google Scholar]
- Hamdoun AM, Cherr GN, Roepke TA and Epel D (2004). Activation of multidrug efflux transporter activity at fertilization in sea urchin embryos (Stronglyocentrotus purpuratus). Dev Biol. 276, 452–462. [DOI] [PubMed] [Google Scholar]
- Hamdoun A and Epel D (2007). Embryo stability and vulnerability in an always changing world. Proc Natl Acad Sci USA. 104, 1745–1750. [DOI] [PMC free article] [PubMed] [Google Scholar]
- Hollenstein K, Dawson RJ and Locher KP (2007). Structure and mechanism of ABC transporter proteins. Curr Opin Struct Biol. 4, 412–418. [DOI] [PubMed] [Google Scholar]
- Homolya L, Holló Z, Germann UA, Pastan I, Gottesman MM and Sarkadi B (1993). Fluorescent cellular indicators are extruded by the multidrug resistance protein. J Biol Chem. 268, 21493–21496. [PubMed] [Google Scholar]
- Horng JL, Lin LY and Hwang PP (2009). Functional regulation of H+-ATPaserich cells in zebrafish embryos acclimated to an acidic environment. Am J Physiol Cell Physiol. 296, C682–C692. [DOI] [PubMed] [Google Scholar]
- Hsiao CD, You MS, Guh YJ, Ma M, Jiang YJ and Hwang PP (2007). A positive regulatory loop between foxi3a and foxi3b is essential for specification and differentiation of zebrafish epidermal ionocytes. PLoS One. 2, e302. [DOI] [PMC free article] [PubMed] [Google Scholar]
- Huls M, Brown CDA, Windass AS, Slayer R, van den Heuvel JJMW and Heemskerk S (2008). The breast cancer resistance protein transporter ABCG2 is expressed in the human kidney proximal tubule apical membrane. Kidney International. 73, 220–225. [DOI] [PubMed] [Google Scholar]
- Hwang PP and Chou MY (2013). Zebrafish as an animal model to study ion homeostasis. Eur J Physiol. 465, 1233–1247. [DOI] [PMC free article] [PubMed] [Google Scholar]
- Ito Y, Kobayashi S, Nakamura N, Miyagi H, Esaki M, Hoshijima K, and Hirose S (2013). Close Association of Carbonic Anhydrase (CA2a and CA15a), Na+/H+ Exchanger (Nhe3b), and Ammonia Transporter Rhcg1 in Zebrafish Ionocytes Responsible for Na+ Uptake. Front. Physiol 2013(4), 59. [DOI] [PMC free article] [PubMed] [Google Scholar]
- Jänicke M, Carney TJ and Hammerschmidt M (2007). Foxi3 transcription factors and Notch signaling control the formation of skin ionocytes from epidermal precursors of the zebrafish embryo. Dev Biol. 307, 258–271. [DOI] [PubMed] [Google Scholar]
- Kim SS, Im SH, Yang JY, Lee YR, Kim GR and Chae JS (2017). Zebrafish as a screening model for testing the permeability of blood-brain barrier to small molecules. Zebrafish. 14, 322–330. [DOI] [PubMed] [Google Scholar]
- Kobayashi I, Saito K, Moritomo T, Araki K, Takizawa F and Nakanishi T (2008). Characterization and localization of side population (SP) cells in zebrafish kidney hematopoietic tissue. Blood. 111, 1131–1137. [DOI] [PubMed] [Google Scholar]
- Kojima R, Sekine T, Kwachi M, Cha SH, Suzuki Y and Endou H (2002). Immunolocalization of multispecific organic anion transporters, OAT1, OAT2, and OAT3, in rat kidney. JASN. 13, 848–857. [DOI] [PubMed] [Google Scholar]
- Kropf C, Segner H and Fent K (2016). ABC transporters and xenobiotic defense systems in early life stages of rainbow trout (Oncorhynchus mykiss). Comparative Biochemistry and Physiology, Part C: Toxicology & Pharmacology. 185–186, 45–46. [DOI] [PubMed] [Google Scholar]
- Kunz-Ramsay Y (2013). Developmental Biology of Teleost Fishes. Springer Science & Business Media. [Google Scholar]
- Lebedeva IV, Pande P and Patton WF (2011). Sensitive and specific fluorescent probes for functional analysis of the three major types of mammalian ABC transporters. PLoS ONE. 6, e22429. [DOI] [PMC free article] [PubMed] [Google Scholar]
- Lee YC, Yan JJ, Cruz SA, Horng JL and Hwang PP (2011). Anion exchanger 1b, but not sodium-bicarbonate cotransporter 1b, plays a role in transport functions of zebrafish H+-ATPase-rich cells. Am J Physiol Cell Physiol. 300, C295–C307. [DOI] [PubMed] [Google Scholar]
- Leslie EM, Deeley RG and Cole SPC (2005). Multidrug resistance proteins: role of P-glycoprotein, MRP1, MRP2, and BCRP (ABCG2) in tissue defense. Toxicol Appl Pharmacol. 204: 216–237. [DOI] [PubMed] [Google Scholar]
- Lin LY, Horng JL, Kunkel JG and Hwang PP (2006). Proton pump-rich cell secretes acid in skin of zebrafish larvae. Am J Physiol Cell Physiol. 290, C371–C378. [DOI] [PubMed] [Google Scholar]
- Lin TY, Liao BK, Horng JL, Yan JJ, Hsiao CD, and Hwang PP (2008). Carbonic anhydrase 2-like a and 15a are involved in acid-base regulation and Na+ uptake in zebrafish H+-ATPase-rich cells. Am J Physiol Cell Physiol. 294, C1250–1260. [DOI] [PubMed] [Google Scholar]
- Long Y, Li Q, Wang Y and Cui Z (2011). MRP proteins as potential mediators of heavy metal resistance in zebrafish cells. Comparative Biochem and Phys Part C: Toxicology & Pharmacology. 153, 310–317. [DOI] [PubMed] [Google Scholar]
- Luckenbach T, Fischer S and Sturm A (2014). Current advances on ABC drug transporters in fish. Comparative Biochemistry and Physiology Part C: Toxicology & Pharmacology. 165, 28–52. [DOI] [PubMed] [Google Scholar]
- McAleer MA, Breen MA, White NL and Matthews N (1999). pABC11 (also known as MOAT-C and MRP5), a member of the ABC family of proteins, has anion transporter activity but does not confer multidrug resistance when overexpressed in human embryonic kidney 293 cells. J Biol Chem. 274, 23541–23548. [DOI] [PubMed] [Google Scholar]
- Osborne OJ, Mukaigasa K, Nakajima H, Stolpe B, Romer I, Philips U, Lynch I, Mourabit S, Lead JR, Kobayashi M, et al. (2016). Sensory systems and ionocytes are targets for silver nanoparticle effects in fish. Nanotoxicology. 10, 1276–1286. [DOI] [PubMed] [Google Scholar]
- Peng K-C, Cluzeaud F, Bens M, Duong Van Huyen J-P, Wioland MA, Lacave R and Vandewalle A (1999). Tissue and cell distribution of the multidrug resistanceassociated protein (MRP) in mouse intestine and kidney. Journal of Histochemistry & Cytochemistry. 47, 757–767. [DOI] [PubMed] [Google Scholar]
- Pola A, Mosiadz D, Saczko J, Modrzucka T and Michalak K (2013). The influence of phenothiazine derivatives on intracellular accumulation of cationic cyanine dye DiOC6(3) in LoVo-DX cells. Anticancer Research. 33, 857–864. [PubMed] [Google Scholar]
- Purkerson JM and Schwartz GJ (2007). The role of carbonic anhydrases in renal physiology. Kidney Int. 71, 103–115. [DOI] [PubMed] [Google Scholar]
- Rychlik B, Balcerczyk A, Klimczak A and Bartosz G (2013). The role of multidrug resistance protein (MRP1) in transport of fluorescent anions across the human erythrocyte membrane. J Membr Biol. 193, 79–90. [DOI] [PubMed] [Google Scholar]
- Schindelin J, Arganda-Carreras I, Frise E, Kaynig V, Longair M, Pietzsch T, Preibisch S, Rueden C, Saalfeld S, Schmid B, et al. (2012). Fiji: an open-source platform for biological-image analysis. Nature Methods. 9, 676–682. [DOI] [PMC free article] [PubMed] [Google Scholar]
- Slot AJ, Molinski SV and Cole SPC (2011). Mammalian multidrug resistance proteins (MRPs). Essays Biochem. 50, 179–207. [DOI] [PubMed] [Google Scholar]
- Smital T and Sauerborn R (2002). Measurement of the activity of multixenobiotic resistance mechanism in the common carp Cyprinus carpio. Marine Enviro Research. 54, 449–453. [DOI] [PubMed] [Google Scholar]
- Strouse JJ, Ivnitski-Steele I, Waller A, Young SM, Perez D, Evangelisti AM, Ursu O, Bologa CG, Carter MB, Salas VM, et al. (2013). Fluorescent substrates for flow cytometric evaluation of efflux inhibition in ABCB1, ABCC1, and ABCG2 transporters. Anal Biochem. 437, 77–87. [DOI] [PMC free article] [PubMed] [Google Scholar]
- Thisse B and Thisse C (2004). Data from: Fast release clones: a high throughput expression analysis. ZFIN Direct Data Submission. (http://zfin.org).
- Tian J, Hu J, Chen M, Yin H, Miao P, Bai P and Yin J (2017). The use of mrp1-deficient (Danio rerio) zebrafish embryos to investigate the role of Mrp1 in the toxicity of cadmium chloride and benzo[a]pyrene. Aquatic Toxicology. 186, 123–133. [DOI] [PubMed] [Google Scholar]
- Toomey BH and Epel D (1993). Multixenobiotic resistance in Urechis caupo embryos – protection from environmental toxins. Biol Bull. 185, 355–34. [DOI] [PubMed] [Google Scholar]
- Van Der Heijden A, Verbost P, Eygensteyn J, Li J, Bonga S and Flik G (1997). Mitochondria-rich cells in gills of tilapia (Oreochromis mossambicus) adapted to fresh water or seawater: quantification by confocal laser scanning microscopy. J Exp Biol. 200, 55–64. [DOI] [PubMed] [Google Scholar]
- Westerfield M (2000). The zebrafish book. A guide for the laboratory use of zebrafish (Danio rerio). Eugene: University of Oregon Press. [Google Scholar]
- Wagner CA, Devuyst O, Bourgeois S and Mohebbi N (2009). Regulated acidbase transport in the collecting duct. Pflugers Arch. 458, 137–156. [DOI] [PubMed] [Google Scholar]
- Wagner DE, Weinreb C, Collins ZM, Briggs JA, Megason SG, and Klein AM (2018). Single-cell mapping of gene expression landscapes and lineage in the zebrafish embryo. Science 360, 981–987. [DOI] [PMC free article] [PubMed] [Google Scholar]
- Weinreb C, Wolock S, and Klein AM (2017). SPRING: a kinetic interface for visualizing high dimensional single-cell expression data. Bioinformatics 34, 1246–1248. [DOI] [PMC free article] [PubMed] [Google Scholar]
Associated Data
This section collects any data citations, data availability statements, or supplementary materials included in this article.


