Abstract
Adult zebrafish, in contrast to mammals, regenerate neurons in their brain, but the extent and variability of this capacity is unclear. Here we ask whether the loss of various dopaminergic neuron populations is sufficient to trigger their functional regeneration. Both sexes of zebrafish were analyzed. Genetic lineage tracing shows that specific diencephalic ependymo-radial glial (ERG) progenitor cells give rise to new dopaminergic [tyrosine hydroxylase-positive (TH+)] neurons. Ablation elicits an immune response, increased proliferation of ERG progenitor cells, and increased addition of new TH+ neurons in populations that constitutively add new neurons (e.g., diencephalic population 5/6). Inhibiting the immune response attenuates neurogenesis to control levels. Boosting the immune response enhances ERG proliferation, but not addition of TH+ neurons. In contrast, in populations in which constitutive neurogenesis is undetectable (e.g., the posterior tuberculum and locus ceruleus), cell replacement and tissue integration are incomplete and transient. This is associated with a loss of spinal TH+ axons, as well as permanent deficits in shoaling and reproductive behavior. Hence, dopaminergic neuron populations in the adult zebrafish brain show vast differences in regenerative capacity that correlate with constitutive addition of neurons and depend on immune system activation.
SIGNIFICANCE STATEMENT Despite the fact that zebrafish show a high propensity to regenerate neurons in the brain, this study reveals that not all types of dopaminergic neurons are functionally regenerated after specific ablation. Hence, in the same adult vertebrate brain, mechanisms of successful and incomplete regeneration can be studied. We identify progenitor cells for dopaminergic neurons and show that activating the immune system promotes the proliferation of these cells. However, in some areas of the brain this only leads to insufficient replacement of functionally important dopaminergic neurons that later disappear. Understanding the mechanisms of regeneration in zebrafish may inform interventions targeting the regeneration of functionally important neurons, such as dopaminergic neurons, from endogenous progenitor cells in nonregenerating mammals.
Keywords: anxiety, GFAP, mating, Olig2, shoaling, tyrosine hydroxylase
Introduction
The adult mammalian brain shows very limited neurogenesis after injury or neuronal loss, leading to permanent functional deficits (Péron and Berninger, 2015; Jessberger, 2016). By contrast, the regenerative capacity of the CNS in adult zebrafish after injury is remarkable (Becker and Becker, 2015; Alunni and Bally-Cuif, 2016; Ghosh and Hui, 2016). However, relatively little is known about the capacity for regeneration and functional integration after the loss of discrete cell populations in the fully differentiated adult CNS.
To study the regeneration of distinct populations of neurons without physical damage, we ablated dopaminergic and noradrenergic neurons using 6-hydroxydopamine (6-OHDA), which selectively ablates these neurons across vertebrates (Berg et al., 2011; Tieu, 2011; Matsui and Sugie, 2017; Vijayanathan et al., 2017). In adult zebrafish, the dopaminergic system is highly differentiated. There are 17 distinct dopaminergic and noradrenergic brain nuclei, identified by immunohistochemistry for cytoplasmic tyrosine hydroxylase (TH) and the related TH2, rate-limiting enzymes in dopamine and noradrenaline synthesis (Chen et al., 2009; Tay et al., 2011). Projections of TH+ brain nuclei are far reaching, including long dopaminergic projections to the spinal cord from population 12 in the diencephalon and noradrenergic projections from the locus ceruleus (LC) in the brainstem. These projections are the only TH+ input to the spinal cord (McLean and Fetcho, 2004a,b; Tay et al., 2011; Kuscha et al., 2012).
Functionally, dopamine, especially from the diencephalo-spinal projection from population 12, has roles in the maturation and initiation of motor patterns in developing zebrafish (Thirumalai and Cline, 2008; Lambert et al., 2012; Reimer et al., 2013; Jay et al., 2015). In addition, dopamine has been linked to anxiety-like behavior in zebrafish (Tran et al., 2016; Wang et al., 2016). Dopaminergic neurons are constantly generated in the adult diencephalon (Grandel et al., 2006), but it is unclear which populations receive new neurons and how this may change after ablation.
For the regeneration of neurons to occur, ependymo-radial glial (ERG) progenitor cells need to be activated. ERG progenitor cells have a soma that forms part of the ependyma and radial processes that span the entire thickness of the brain. After a CNS injury, these cells are either activated from quiescence or increase their activity in constitutively active adult proliferation zones to regenerate lost neurons (Grandel and Brand, 2013; Becker and Becker, 2015; Alunni and Bally-Cuif, 2016). Activation could occur via damage to the highly branched ERG processes or early injury signals. Remarkably, the microglial/macrophage reaction following a mechanical lesion has been shown to be both necessary and sufficient for regenerative proliferation of ERG progenitor cells and neurogenesis in the adult zebrafish telencephalon (Kyritsis et al., 2012). The immune response also promotes neuronal regeneration in the spinal cord of larval zebrafish after a lesion (Ohnmacht et al., 2016). Hence, it might also play a role in the regenerative response after discrete neuronal loss without injury.
We find that locally projecting dopaminergic neurons in the diencephalon are regenerated from specific ERGs, whereas large Th+ neurons with spinal projections are only transiently replaced. Their loss is associated with permanent and specific functional deficits in shoaling and mating behaviour. Inhibiting the immune response abolished ablation-induced regeneration. Hence, we demonstrate an unexpected heterogeneity in the regenerative capacity of functionally important dopaminergic neurons in the adult zebrafish and essential functions of the immune response.
Materials and Methods
Animals.
All fish were kept and bred in our laboratory fish facility according to standard methods (Westerfield, 2000), and all experiments had been approved by the British Home Office. We used wild-type (wik) and Tg(olig2:DsRed2) (Kucenas et al., 2008), abbreviated as olig2:DsRed; Tg(gfap:GFP) (Bernardos and Raymond, 2006), abbreviated as gfap:GFP; Tg(slc6a3:EGFP; Xi et al., 2011), abbreviated as dat:GFP, and Tg(her4.1:TETA-GBD-2A-mCherry; Knopf et al., 2010), abbreviated as her4.3:mCherry, transgenic reporter lines. Note that zebrafish nomenclature treats her4.1 and her4.3 as synonymous (https://zfin.org/ZDB-TGCONSTRCT-110825-6). For genetic lineage tracing, we used Tg(-3her4.3:Cre-ERT2) (Tübingen background; Boniface et al., 2009) crossed with Tg(actb2:LOXP-mCherry-LOXP-EGFP) (Ramachandran et al., 2010), as previously described (Skaggs et al., 2014). Adult (>4 months of age) male and female fish were used for the experiments.
Bath application of substances.
For dexamethasone treatment, fish were immersed in 15 mg/L dexamethasone (catalog #D1756, Sigma-Aldrich) or vehicle (0.06% DMSO) in system water (Kyritsis et al., 2012). Dexamethasone treatment did not cause any obvious changes in fish behavior. For lineage-tracing experiments, fish were immersed in 1 μm 4-hydroxytamoxifen (catalog #H6278, Sigma-Aldrich) in system water with tanks protected from light. Fish were transferred into fresh drug/vehicle every other day.
Intraventricular injections.
Fish were anesthetized in MS222 (1:5000% w/v in PBS; Sigma-Aldrich) and mounted in a wet sponge to inject the third ventricle from a dorsal approach using a glass capillary, mounted on a micromanipulator. Using sharp forceps, a hole was made into the skull covering the optic tectum, and the needle was advanced at a 45° angle from the caudal edge of the tectum into the third ventricle. The capillary was filled with a 10 mm solution of 6-OHDA (product #H116, Sigma-Aldrich) in H2O and 0.12% of a fluorescent dextran-conjugate (product #D34682, Thermo Fisher Scientific) to ablate TH+ cells, or with fluorescently labeled Zymosan A (from Saccharomyces cerevisiae) bioparticles at a concentration of 10 mg/ml (product #Z23373, Thermo Fisher Scientific) to stimulate the microglial response. Leukotriene C4 (LTC4; product #20210, Cayman Chemicals) was injected at a concentration of 500 ng/ml in 0.45% ethanol in H2O. Sham-injected controls were generated by injecting vehicle solutions.
A pressure injector (IM-300 microinjector, Narishige International) was used to inject 0.5–1.0 μl of the solution. The skull is sufficiently translucent to detect a fluorescent dye distributed through the ventricular system. Therefore, we were able to verify successful distribution of the solution throughout the ventricular system under a fluorescence-equipped stereo microscope. This injection technique only induced a localized microglial reaction surrounding the point where the capillary penetrated the optic tectum, but not close to any of the TH+ populations of interest.
Intraperitoneal injections.
Fish were anesthetized in MS222 and injected on a cooled surface on their left side with a 30.5 gauge needle. Per application, 25 μl of 16.3 mm 5-ethynyl-2′-deoxyuridine (EdU; Thermo Fisher Scientific) was injected intraperitoneally. EdU was dissolved in 15% DMSO and 30% Danieau's solution in distilled water.
Haloperidol (product #H1512, Sigma-Aldrich) was injected at a volume of 25 μl and a concentration of 80 μg/ml in PBS for each injection. This approximately equates to 4 mg/kg, twice the concentration shown to be effective in salamanders (Berg et al., 2011).
Quantitative real-time PCR.
Brains were dissected without any tissue fixation and sectioned on a vibrating-blade microtome. RNA was isolated from a 200-μm-thick horizontal section at the level used for the analysis of proliferating ERG progenitor cells around the ventricle (see Fig. 5A, section level) using the RNeasy Mini Kit (catalog #74106, Qiagen). cDNA synthesis was performed using the iScript cDNA Synthesis Kit (catalog #1708891, Bio-Rad). Standard quantitative real-time PCR (qRT-PCR) was performed using a Roche Light Cycler 96 (annealing temperature of 58°C) with SsoAdvancedTM Universal SYBR® Green Supermix (Bio-Rad, 172-5271). Relative mRNA levels were determined using the Roche Light Cycler 96 SW1 software. Samples were run in duplicate, and expression levels were normalized to the level of 18S ribosomal RNA. Primers were designed to span an exon–exon junction using Primer-BLAST. Primer sequences were as follows: tnf-α: forward, 5′-TCACGCTCCATAAGACCCAG-3′; reverse, 5′-GATGTGCAAAGACACCTGGC-3′; il-1β: forward, 5′-ATGGCGAACGTCATCCAAGA-3′; reverse, 5′-GAGACCCGCTGATCTCCTTG-3′; and 18S: forward, 5′- TCGCTAGTTGGCATCGTTTATG-3′; reverse, 5′- CGGAGGTTCGAAGACGATCA-3′.
Figure 5.
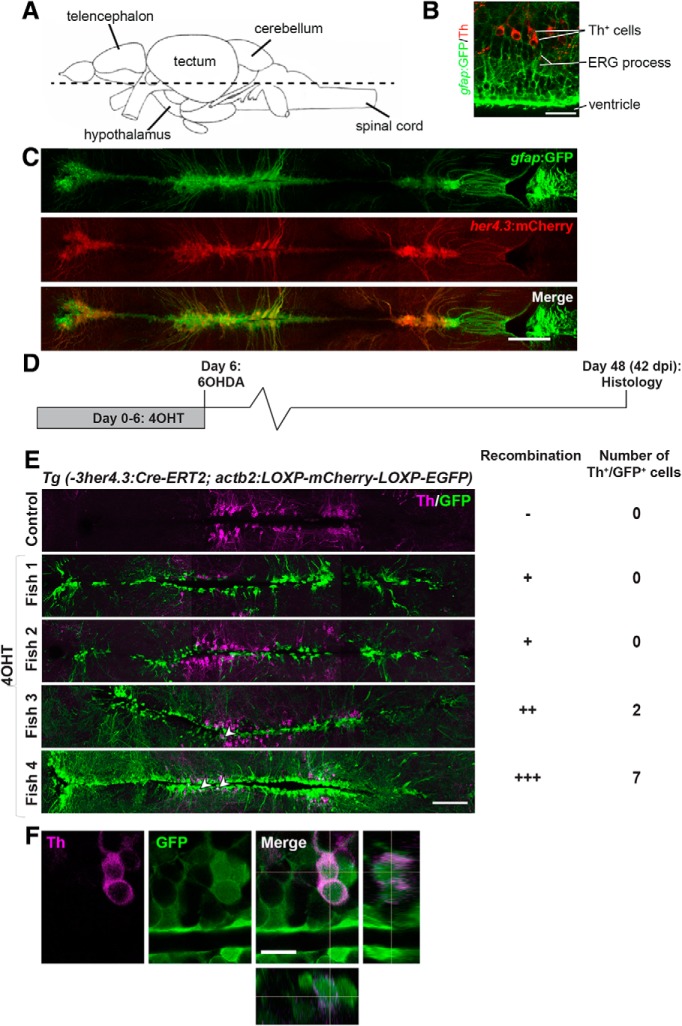
Genetic lineage tracing identifies ERG progenitor cells as the source for new TH+ cells. A, The horizontal section level of all photomicrographs is indicated (rostral is left). B, TH+ cells are in close vicinity to gfap:GFP+ processes near the brain ventricle. C, her4.3:mCherry+ cells largely overlap with gfap:GFP labeling in double-transgenic animals. D, E, Pulse-chase lineage tracing driven by her4.3 indicates variable recombination and labeling of mainly ERG progenitor cells and some TH+ neurons (arrowheads). F, High-magnification and orthogonal views indicate TH+/GFP+ cells. Scale bars: B, 25 μm; C, E, 100 μm; F, 10 μm.
HPLC.
Brains were dissected without any tissue fixation and frozen. HPLC analysis was performed as described previously (Sallinen et al., 2009).
Immunohistochemistry.
We used mouse monoclonal antibody 4C4 (1:50; catalog #92092321, HPC Cell Cultures) to label microglia. The antibody labels microglia in the brain, but not in peripheral macrophages (Ohnmacht et al., 2016). We used mouse monoclonal antibody 4C4 (1:50; catalog #92092321, Sigma-Aldrich) to label microglia; a mouse monoclonal antibody to the proliferating cell nuclear antigen (PCNA; 1:1000; designation #M0879; Dako/Sigma-Aldrich); and a mouse monoclonal antibody to TH (1:1000; designation #MAB318; Merck Millipore/Sigma-Aldrich). Suppliers for the appropriate fluorescence-labeled or biotin-labeled antibodies were Stratech and Vector Laboratories, respectively. Dilutions of secondary antibodies followed the manufacturer recommendations.
Immunofluorescent labeling of 50 μm sections was performed as previously described (Barreiro-Iglesias et al., 2015). Briefly, brains from perfusion-fixed (4% paraformaldehyde) animals were dissected, sectioned on a vibrating-blade microtome, incubated with primary antibody at 4°C overnight, washed, incubated in secondary antibody for 45 min at room temperature, washed, and mounted in glycerol. All washes were 3× 15 min in PBSTx (0.1% Triton X-100 in PBS).
For colorimetric detection of TH, a biotinylated secondary antibody was used, followed by the ABC reaction using the Vectastain ABC Kit (Vector Laboratories) according to the manufacturer recommendations. The color was developed using diaminobenzidine solution (1:120 diaminobenzidine; 2 μl/ml 1% stock NiCl2, and 2 μl/ml 1% stock CoSO4 in PBS) preincubation (30 min at 4°C), followed by the addition of 30% hydrogen peroxide. Sections were mounted, dried, and counterstained in neutral red staining solution (4% acetate buffer, pH 4.8, and 1% neutral red in distilled H2O) for 6 min, followed by differentiation in 70% and 95% ethanol.
EdU detection.
To detect EdU, we used Click-iT EdU Alexa Fluor 488 or 647 Imaging Kits (Thermo Fisher Scientific) according to the manufacturer recommendations. Briefly, 50 μm sections from perfusion-fixed brains were incubated in Click-iT reaction buffer for 3 h in the dark at room temperature, washed 3× 10 min in 0.3% PBSTx and once in PBS. After that, sections were mounted in 70% glycerol or underwent immunofluorescent labeling as described above.
TUNEL labeling.
TUNEL labeling was performed as described previously (Reimer et al., 2008) using the in situ TMR Cell Death Detection Kit (Roche) according to the manufacturer recommendations. In brief, sections were incubated with reaction mix in the dark at 37°C for 60 min. This was followed by immunolabeling as described above.
Quantification of cells and axons.
All counts were performed with the observer blinded to the experimental condition. For colorimetric immunohistochemistry of TH, cell profiles were counted for individual brain nuclei, which were identified by neutral red counterstain. The innervation density of labeled axons was semiquantitatively determined by determining the average pixel brightness for a region of interest using Image J.
In fluorescently labeled sections, cells were stereologically counted in confocal image stacks, as described previously (Barreiro-Iglesias et al., 2015). To quantify TH/EdU double-labeled cells, all sagittal serial vibrating blade microtome sections (50 μm in thickness) containing the populations in question were scanned on a confocal microscope, and the numbers of cells were determined by manually going through the image stacks for all sections.
To quantify PCNA- or EdU-labeled ERG progenitor cells, we used one horizontal section (50 μm in thickness) at the levels of the 5/6 population, identified by the characteristic shape of the ventricle.
Double labeling of cells was always assessed in single optical sections (<2 μm thickness). Fluorescently labeled axons in the spinal cord were quantified using automatic functions in ImageJ, as described previously (Kuscha et al., 2012).
Behavioral tests.
All behavior tests, comparing 6-OHDA-injected and sham-injected animals, were performed when at least 7 d had passed after injection. All recordings were made with a Sony Ex-waveHAD B&W video camera and videos were analyzed using Ethovision XT7 Tracking Software (Noldus), except for shoaling analysis (see below).
For the open field test, fish swimming was recorded in a round tank (16.3 cm diameter, 8 cm water depth) for 6 min after 2 min of acclimatization time. The software calculated the total distance moved and the average velocity of the fish.
For the light/dark test, a tank (10 × 20 cm, 8 cm water depth) was illuminated from below with half of the area blocked from the light. The time spent in the illuminated area was recorded in the 6 min immediately following placement of the fish.
For the novel tank, test fish were placed in a tank 23 × 6 cm, 12 cm water depth, divided into three 4 cm zones), and their time spent in the different depth zones was recorded for 6 min immediately after the fish were placed.
For the shoaling test, groups of four fish were placed into a large tank (45.5 × 25 cm, 8 cm water depth), and their swimming was recorded for 6 min after 2 min of acclimatization time. Fish were not selected for sex. Fish were simultaneously tracked, and the pairwise Euclidean distance between each pair of fish was determined and averaged per frame using commercially available Actual Track Software (Actual Analytics, Edinburgh, UK).
To test mating success, pairs of fish were placed into mating tanks (17.5 × 10 cm, 6 cm water depth) with a transparent divider in the evening. The next morning, the divider was pulled at lights-on, and the fish were allowed to breed for 1 h. Each pair was bred four times every other day. Numbers of fertilized eggs in the clutch and the percentage of successful matings were recorded. A mating attempt was scored as successful when fertilized eggs were produced.
Statistical analyses.
Quantitative data were tested for normality (Shapiro–Wilk test, *p < 0.05) and heteroscedasticity (Levene's test, *p < 0.05) to determine the types of statistical comparisons. The variability of values is always given as SEM. Statistical significance was determined using the Student's t test for parametric data (with Welch's correction for heteroscedastic data) or the Mann–Whitney U test for nonparametric data. For multiple comparisons, we used one-way ANOVA with Bonferroni's post hoc test for parametric homoscedastic data, one-way ANOVA with Welch's correction, Games–Howell post hoc test for heteroscedastic data, and Kruskal–Wallis test with Dunn's post-test for nonparametric data. The shape of distributions was assessed using a Kolmogorov–Smirnov test (see Fig. 13). Randomization was performed by alternating the allocation of fish between control and treatment groups. No experimental animals were excluded from analysis. All relevant data are available from the authors.
Figure 13.
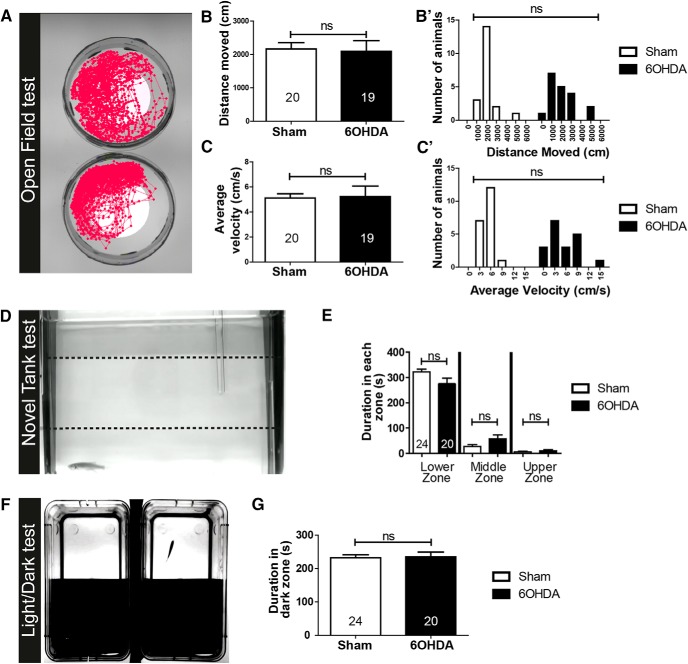
Basic swimming parameters and anxiety-like behaviors are unaltered by 6-OHDA treatment. A, Typical swim tracks are shown. B–C′, Quantifications of averages (B, C) and frequency distributions (B′, C′) of distance swum (B) and average velocity (C) show no differences between control and treated fish. B, C, Student's t test, p > 0.05. B′, C′, Kolmogorov–Smirnov test, p > 0.05. D, A side view of a fish preferring the lower third of a novel tank is shown. E, Quantifications of time spent in the different depth of the tank show the same preference for the lowest compartment in control and 6-OHDA-treated fish. Mann–Whitney U tests, p > 0.05. F, The setup for the light/dark preference test is shown from above. G, Quantifications indicate that control and treated fish do not differ in their preference for the dark compartment in a 300 s observation period. Student's t test, p > 0.05. Error bars represent S.E.M.
Results
Intraventricular injection of 6-OHDA ablates specific populations of dopaminergic neurons and locally activates microglia
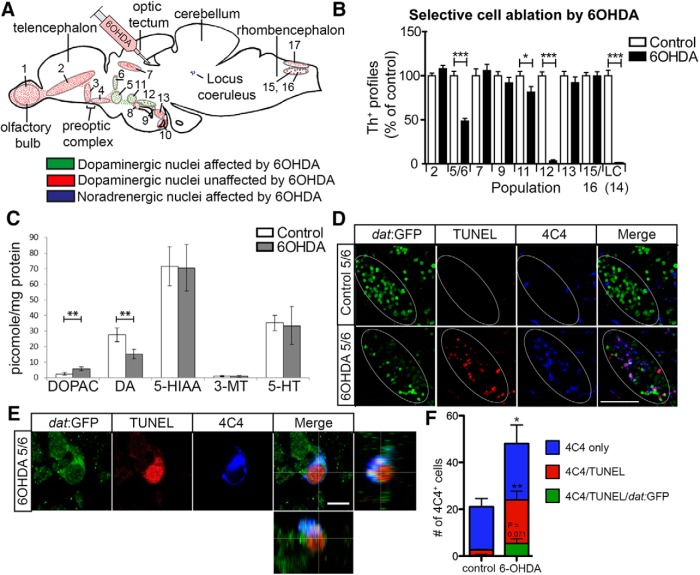
To ablate dopaminergic and noradrenergic (TH+) neurons in the absence of damage to tissue and ERG processes, we established an ablation paradigm that relies on intraventricular injections of 6-OHDA (Fig. 1A). Of the quantifiable TH+ cell populations in the brain (Sallinen et al., 2009), we found no effect of 6-OHDA injection on cell numbers in populations 2 (p = 0.104), 7 (p = 0.587), 9 (p = 0.302), 13 (p = 0.342), and 15/16 (p = 0.989) at 2 d postinjection (dpi; Fig. 1B). However, there was a 51% loss in population 5/6 (control, 484 ± 24 cell profiles; 6-OHDA, 235 ± 14 cell profiles), a 19% loss of TH+ cells in population 11 (288 ± 12 in controls vs 234 ± 16 in treated), 96% in population 12 (28 ± 1 in controls vs 1 ± 0 in treated), and complete loss of noradrenergic neurons in the LC (18 ± 1 in controls vs zero in treated; Fig. 1B). Higher doses of 6-OHDA did not increase the loss of TH+ cells (data not shown). Consistent with TH+ cell loss, we found a 45% reduction in dopamine levels, but no effect on serotonin (p = 0.899) or its metabolites 5-hydroxyindoleacetic acid (5-HIAA; p = 0.965) and 3-methoxytyramine (3-MT; p = 0.940) after 6-OHDA injection, measured in the whole brain by HPLC (Fig. 1C). There were no obvious correlations between the distance of neurons from the injection site or the morphology of the neurons and rates of ablation (Fig. 1A). The failure to ablate other populations is unlikely to be due to lack of diffusion, because the vulnerable LC population is the farthest away from the injection site and other much closer brain nuclei, such as population 7, did not show any cell loss. 6-OHDA loses activity within hours (Ding et al., 2004), and we did not observe overt progressive cell loss at later time points (42 dpi). However, limited delayed cell death cannot be excluded. Hence, we devised an ablation paradigm in which neurons in populations 5/6, 11, 12, and the LC were highly vulnerable to 6-OHDA.
Figure 1.
Specific populations of TH+ neurons are ablated by 6-OHDA. A, A schematic sagittal section of the adult brain is shown with the 6-OHDA-resistant dopaminergic cell populations (red) and the vulnerable dopaminergic (green) and noradrenergic populations (purple) in relation to the injection site in the third ventricle indicated. B, Quantification of cell loss after toxin injection at 2 dpi is shown. C, Injection of the toxin decreases levels of dopamine (DA), increases levels of the metabolite DOPAC, but leaves serotonin (5-HT) and metabolites (5-HIAA, 3-MT) unaffected, as shown by HPLC. D, Sagittal sections of population 5/6 are shown in a dat:GFP transgenic fish. This shows elevated TUNEL and microglia labeling in population 5/6 after ablation. Note that areas of elevated TUNEL and microglial labeling follow the outlines of the dat:GFP+ cell population (ellipse) in the 6-OHDA-treated animals, but not in controls, indicating localized labeling. E, A high-magnification image is shown of a TUNEL+/dat:GFP+ dopaminergic neuron that is engulfed by a 4C4+ microglial process (lateral and orthogonal views). F, Quantification of microglial cells inside the 5/6 population (one 50 μm section through the 5/6 population from three animals each) is shown, with subgroups as indicated. Student's t test (with Welch's correction for heteroscedastic data) and Mann–Whitney U tests were used for pairwise comparisons in B, C, and F: *p < 0.05; **p < 0.01; ***p < 0.001. Error bars represent standard error of the mean. Scale bars: D, 50 μm; E, 5 μm.
To determine whether 6-OHDA injections led to the specific death of TH+ neurons and the activation of an immune response, we combined TUNEL labeling and immunohistochemistry for microglia using the 4C4 antibody, which selectively labels microglial cells (Becker and Becker, 2001; Ohnmacht et al., 2016) in a reporter fish for dopaminergic neurons (dat:GFP; Xi et al., 2011) at 12 h postinjection. This indicated selective appearance of TUNEL+/dat:GFP+ profiles in the vulnerable populations, but not in the nonablated populations or in areas not labeled by the transgene (Fig. 1D; see also Fig. 8A, localized microglia reaction after 6-OHDA treatment). Some microglial cells engulfed TUNEL+/dat:GFP+ profiles, indicating the activation of microglia (Fig. 1E). Quantification shows that the density of microglial cells was doubled in these areas (Fig. 1F). Approximately half of the cells were associated with TUNEL signal, whereas in controls, only very few cells were associated with debris. Associations of all three labels (4C4/TUNEL/dat:GFP) were rare (Fig. 1F). We interpret this to be a consequence of dying TH+ cells losing GFP labeling very quickly. Hence, 6-OHDA only leads to the death of circumscribed dopaminergic cell populations and elicits a localized microglial response.
Figure 8.
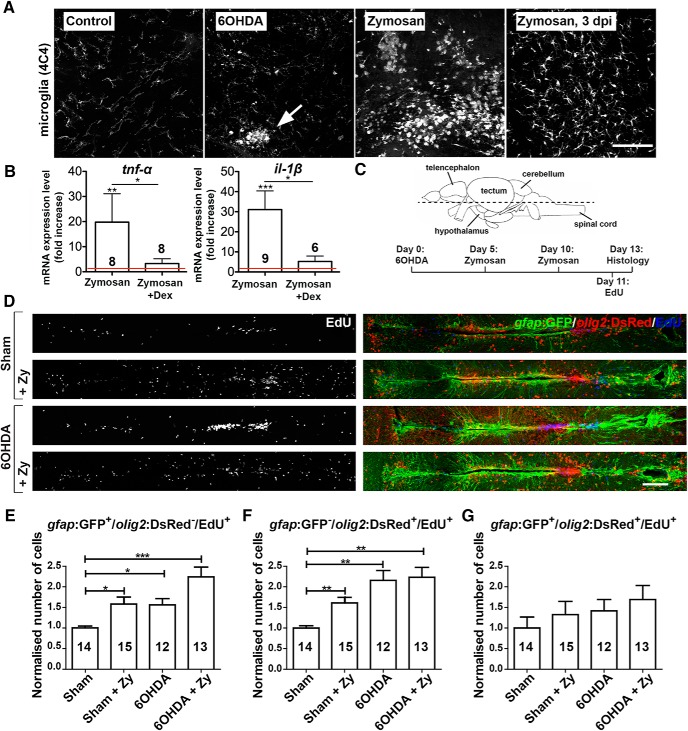
OHDA and Zymosan injections both increase ERG proliferation. A, Sagittal sections of population 5/6 restricted microglia activation at 24 h after 6-OHDA injection (arrow) compared with sham-injected control animals is observed. Zymosan injection leads to a much stronger, nonlocalized microglia response that lasts for at least 3 d. B, Zymosan injection massively increases mRNA levels for il-1β and tnf-α compared with vehicle-injected controls at 12 hpi. This is inhibited by coapplication of dexamethasone [one-way ANOVA with Dunn's multiple comparisons; *p = 0.035 (for tnf-α); *p = 0.0447 (for il-1β); **p = 0.0019; ***p = 0.0004]. C, The horizontal plane of sectioning (rostral is left for all panels in D), and the experimental timeline for D–G is shown. D–G, 6-OHDA injections and Zymosan injections, alone or in combination, increase the proliferation of ERG progenitor cells (D). E–G, This is true for only gfap:GFP+ (E) and only olig2:DsRed+ (F), but not for double-labeled ERG progenitor cells (G). To facilitate comparisons between the different populations of ERG progenitor cells, changes induced by the treatments are normalized to the sham-injected group for each population. E–G, One-way ANOVA with Welch's correction and Games–Howell post hoc test (E, F): *p < 0.05, **p < 0.01, ***p < 0.001; one-way ANOVA: p > 0.05 (G). Error bars represent S.E.M. Scale bars: A, 100 μm; D, 100 μm. dex, Dexamethasone; Zy, Zymosan.
Cell replacement patterns differ between dopaminergic cell populations
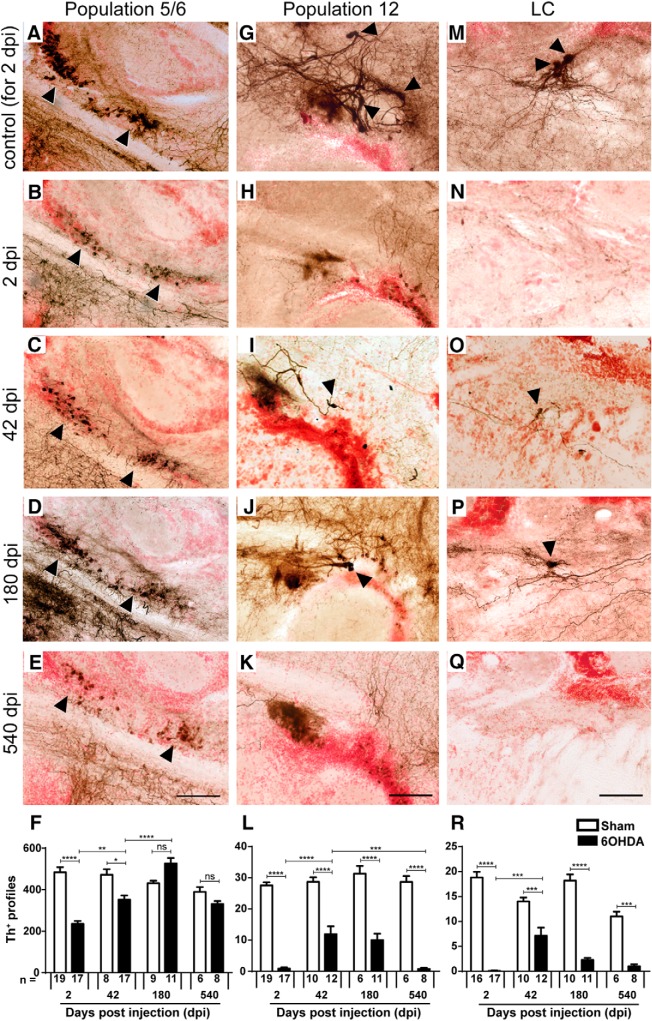
To analyze whether lost TH+ neurons were replaced, we assessed TH+ cell numbers relative to controls without ablation for up to 540 dpi (1.5 years postinjection) of the toxin. The relatively small loss of cells in population 11 was compensated for at 42 dpi (data not shown). In population 5/6, numbers were increased compared with 2 dpi, but were still lower than those in controls by 42 dpi. However, at 180 dpi, TH+ cell numbers were even slightly increased over those of controls. At 540 dpi, numbers were similar to age-matched controls (p > 0.999; Fig. 2A–F). In contrast, in population 12 and the LC, TH+ neuron numbers were never fully recovered. There was a small and transient recovery in cell numbers in these populations at 42 dpi, but by 540 dpi there were hardly any neurons present in population 12 and the LC (Fig. 2G–R). This indicates differential potential for cell replacement for different populations of dopaminergic neurons.
Figure 2.
Replacement of TH+ neurons differs between brain nuclei. Sagittal brain sections are shown; dorsal is up, rostral is left. Some TH+ cell bodies are indicated by arrowheads. The most representative images are shown, but quantifications are from one to three tissue sections (50 μm thickness), depending on the extent of the populations. A–F, In population 5/6, the number of TH+ cells is reduced after toxin-induced ablation and back to levels seen in controls without ablation by 180 dpi. G–L, In population 12, a partial and transient recovery in the number of TH+ cells was observed at 42 dpi. M–R, In the LC, there was also a partial and transient recovery of TH+ cell number. Note that example photomicrographs of controls are only shown for 2 dpi for clarity reasons, but all statistics were done with age-matched controls. F, L, R, Two-way ANOVA (p < 0.0001) with Bonferroni post hoc test: *p < 0.05, **p < 0.01, ***p < 0.001, ****p < 0.0001. Scale bars, 50 μm.
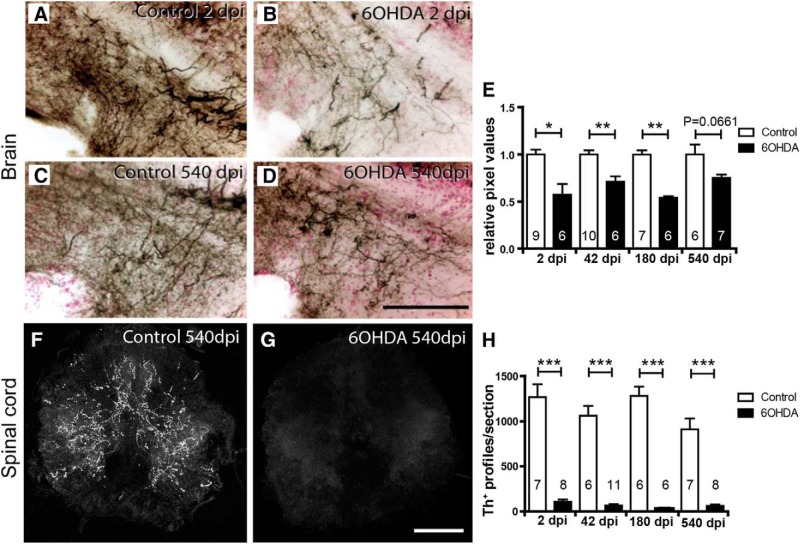
To determine whether restored dopaminergic neurons reinnervated their former target areas, we analyzed a terminal field ventral to the predominantly locally projecting population 5/6 (Tay et al., 2011), which showed the regeneration of cell bodies. After ablation, the density of TH+ innervation of this terminal field, measured semiquantitatively by relative labeling intensity, was significantly reduced, compared with controls. This was still the case at 180 dpi, although cell replacement had been almost completed by 42 dpi. At 540 dpi, the axon density in 6-OHDA-injected fish was comparable to other time points, though just not statistically different from age-matched controls (p = 0.0661). This is likely due to the higher variability observed in aged fish. This suggests slow, if any, restoration of local projections (Fig. 3A–E).
Figure 3.
TH+ axons are inefficiently regenerated. A–D, Immunohistochemical detection of TH+ axons (black on red counterstain) in sagittal sections through a terminal field of TH+ axons ventral to population 5/6 is shown. A–D, Compared with controls (A), density of these axons is reduced at 2 dpi (B), and is more similar to age-matched controls (C) at 540 dpi (D). E, Semiquantitative assessment of labeling intensity in the area depicted in A–E indicates significant loss of innervation at all time points except the latest, 540 dpi. F, G, Spinal cross sections are shown. Compared with age-matched controls (F), immunofluorescence for TH is very low at 540 dpi (G). H, Quantification of spinal TH+ axons indicates a lack of regeneration of the spinal projection. Student's t tests (with Welch's correction for heteroscedastic data) or Mann–Whitney U tests were used for pairwise comparisons as appropriate: *p < 0.05; **p < 0.01; ***p < 0.001. Error bars represent S.E.M. Scale bars: (in D) A–D, 100 μm; (in G) F, G, 100 μm.
Since population 12 and the LC, which show little cell replacement, provide all TH+ innervation to the spinal cord (McLean and Fetcho, 2004a,b; Kuscha et al., 2012), we assessed innervation of TH+ axons of the spinal cord. In animals without ablation, we always observed TH+ axons in the spinal cord at a midthoracic level (n = 26). Between 2 and 540 dpi, these axons were almost completely absent from the spinal cord in 6-OHDA-injected animals (Fig. 3F–H). Hence, the entire TH+ projection to the spinal cord was ablated by 6-OHDA treatment and never regenerated.
Capacity for enhanced addition of new dopaminergic neurons after ablation correlates with presence of constitutive neurogenesis for different populations
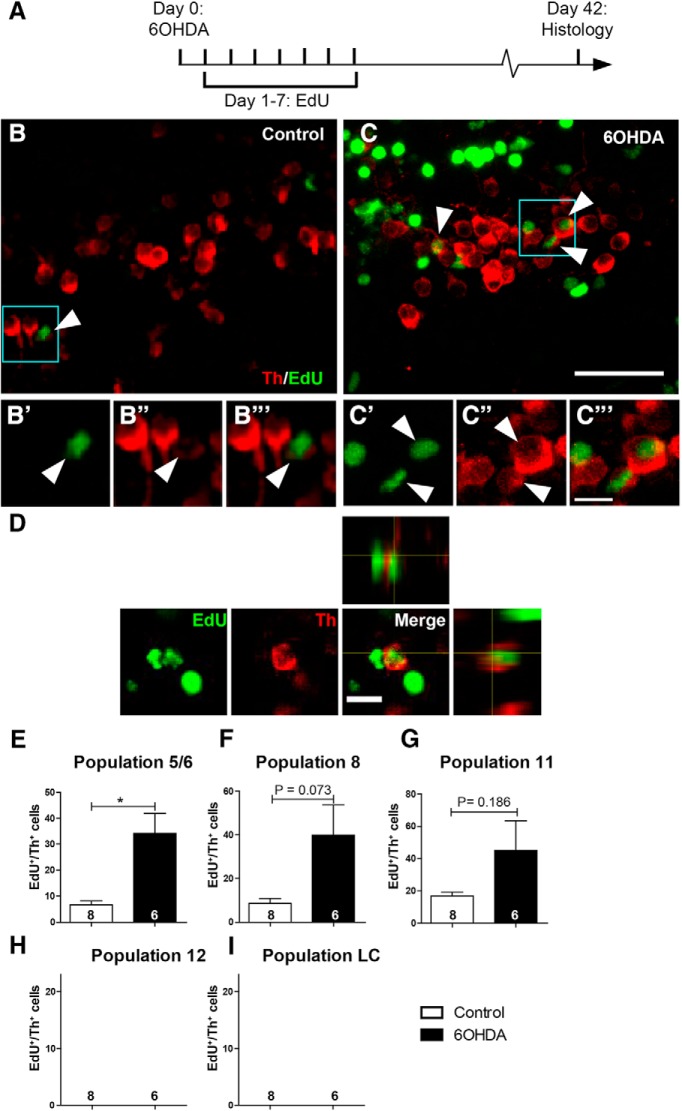
To determine how dopaminergic neurons were replaced after ablation, we assessed whether neurogenesis of dopaminergic neurons could be observed and whether ablation of dopaminergic neurons changed generation rates. To that aim, we injected EdU daily for 7 d after 6-OHDA injection to maximize progenitor labeling. We analyzed the number of TH+/EdU+ neurons at 6 weeks postinjection, allowing sufficient time for the differentiation of TH+ neurons (Fig. 4A). Even in the nonablated situation, a low number of double-labeled neurons was observed in populations that were capable of neuron replacement, that is, in populations 5/6, 8, and 11 (Fig. 4B,E–G). For the countable populations 5/6 and 11, double-labeled cells represented 1.4% and 5.7%, respectively, of the average number of TH+ cells in these populations. This indicates that dopaminergic neurons are constantly added to specific populations at a low rate.
Figure 4.
Generation of new TH+ cells is enhanced by prior ablation only in dopaminergic populations showing constitutive neurogenesis. A, The experimental timeline is given. B, C, In sagittal sections of population 5/6 (rostral left; dorsal up), EdU and TH double-labeled cells can be detected. Boxed areas are shown in higher magnifications in B′ to C‴, indicating cells with an EdU-labeled nucleus, which is surrounded by a TH+ cytoplasm (arrowheads). D, High-magnification and orthogonal views of an EdU+/TH+ cell after 6-OHDA treatment are shown. E–I, Quantifications indicate the presence of newly generated TH+ cells in specific dopaminergic brain nuclei (E–G). After 6-OHDA treatment, a statistically significant increase in the number of these cells was observed for population 5/6. Note that population 12 and LC showed no constitutive or ablation-induced EdU-labeled TH+ cells (H, I). Student's t tests with Welch's corrections, *p < 0.05. Error bars represent S.E.M. Scale bars: (in C) A, B, 20 μm; (in C‴) B′ to C‴, 5 μm; D, 10 μm.
After ablation, the number of double-labeled cells was increased fivefold in population 5/6 to 7.0% of all TH+ cells (Fig. 4C–E), compared with sham-injected animals. A similar nonsignificant trend was present in populations 8 (p = 0.073) and 11 (p = 0.186; Fig. 4F,G). In population 11, 15.2% TH+ cells were double labeled after 6-OHDA injection. Hence, ablation of TH+ cells increases the rate of addition of new neurons to regenerating populations.
In contrast, in population 12 and the LC, which did not show strong replacement of TH+ neurons after 6-OHDA injection in our histological analysis above, we also did not observe EdU+/TH+ neurons without or with ablation (Fig. 4H,I). Hence, differences in TH+ neuron replacement capacity correlate with differences in constitutive neurogenesis for distinct populations.
New dopaminergic neurons are derived from ERG progenitor cells
New TH+ cells are likely derived from local ERG progenitor cells. The ventricle close to the 5/6 population is lined by cells with radial processes spanning the entire thickness of the brain. Most of these cells are labeled by gfap:GFP, indicating their ERG identity (Kyritsis et al., 2012), and TH+ cells are located close to ERG processes (Fig. 5A,B). Using PCNA labeling, we find that some of the ERG progenitor cells proliferate in the untreated brain, consistent with a function in maintaining dopaminergic and other cell populations (see Fig. 11, compare E, F).
Figure 11.
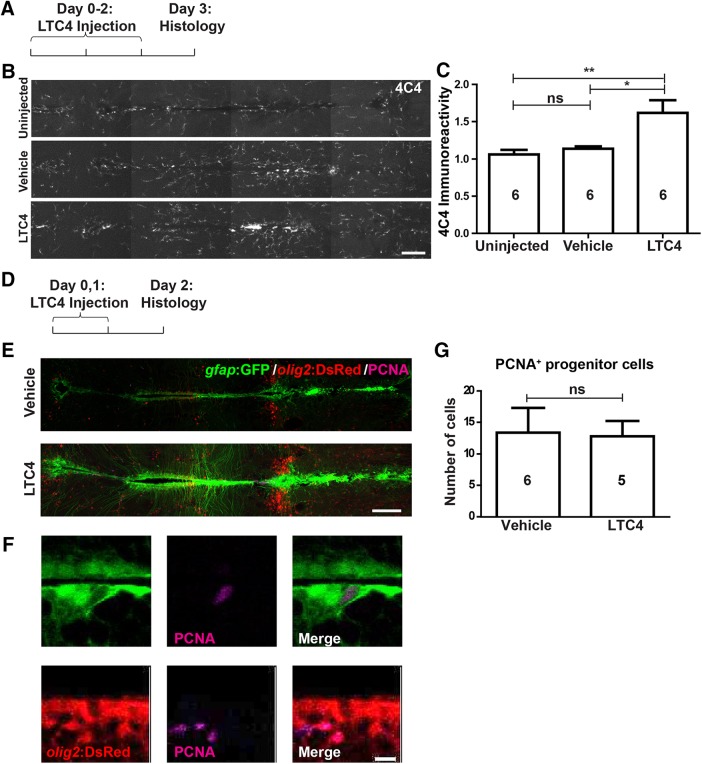
LTC4 moderately activates microglia but does not increase proliferation of ERG progenitor cells. Horizontal sections are shown, rostral is left. A–C, LTC4, but not vehicle injection, leads to an increase in microglia labeling in the brain. D–G, PCNA labeling in gfap:GFP+ and/or olig2:DsRed+ ERG progenitor cells is not increased by LTC4 treatment. C, G, One-way ANOVA with Bonferroni post hoc test (C) and Mann–Whitney U test were used (G): *p < 0.05, **p < 0.01. Error bars represent S.E.M. Scale bars: B, E, 100 μm; F, 10 μm.
To determine whether new TH+ cells are derived from ERG progenitor cells, we used genetic lineage tracing with a Tg(-3her4.3:Cre-ERT2) × Tg(actb2:LOXP-mCherry-LOXP-EGFP) double-transgenic fish (Boniface et al., 2009). In this fish, tamoxifen-inducible Cre is driven by the regulatory sequences of the her4.3 gene. her4.3 is specifically expressed in zebrafish ERG progenitor cells (Kroehne et al., 2011). The second transgene leads to the expression of GFP in ERG progenitor cells and their progeny after Cre recombination. We found a strong overlap between gfap:GFP and her4.3:mCherry labeling, indicating that the driver targets the appropriate cell population (Fig. 5C).
We incubated animals in tamoxifen for 6 d to induce recombination in ERG progenitor cells, injected 6-OHDA. and waited for another 42 d for histological analysis. In animals without previous tamoxifen application, we did not observe any GFP+ cells. In tamoxifen-incubated animals, mostly ERG progenitor cells were labeled at different densities, indicating variable recombination rates. Variable recombination rates could have resulted from the variability of transgene expression in individual fish. Although we used an extensive 4OHT (4-hydroxy-tamoxifen) incubation protocol (Ramachandran et al., 2010), we cannot exclude inefficient diffusion as another reason for variable recombination. In animals in which high recombination rates were achieved, we found GFP+/TH+ cells after the chase period, indicating that ERG progenitor cells gave rise to dopaminergic neurons (Fig. 5D–F). However, we cannot exclude additional sources for new TH+ neurons that might be active during physiological or ablation-induced addition of these neurons.
Generation of new TH+ cells depends on immune system activation
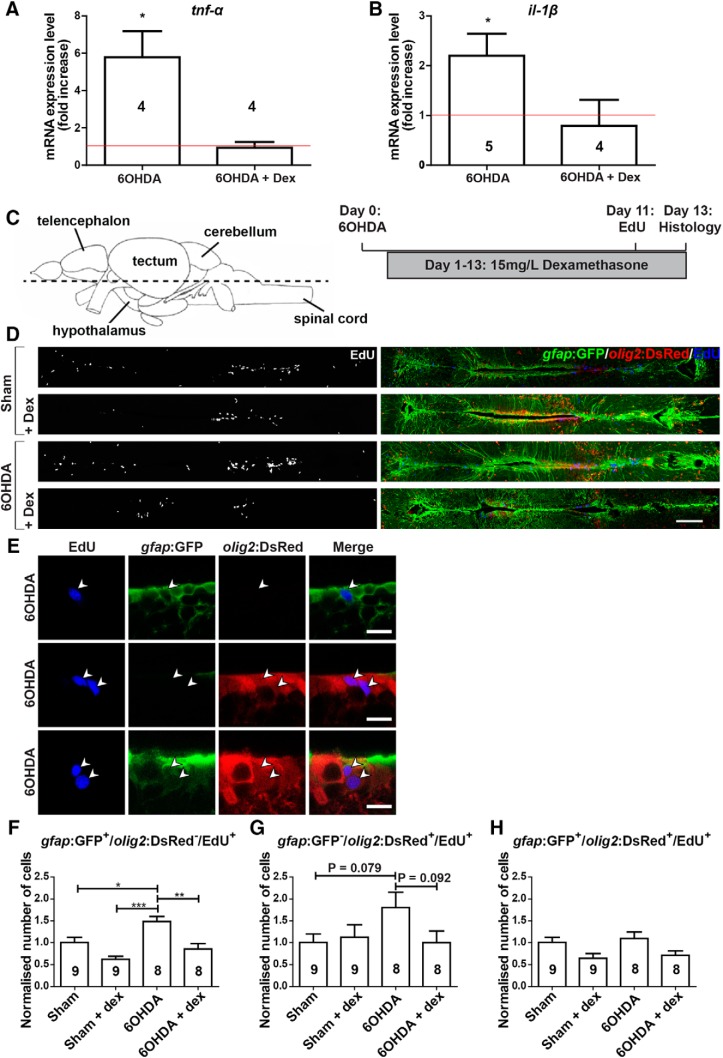
To test whether the observed activation of microglial cells (compare Fig. 1D) was necessary for TH+ cell regeneration, we inhibited the immune reaction using a dexamethasone bath application (Kyritsis et al., 2012) and analyzed the effects on ERG progenitor cell proliferation and TH+ cell generation. Dexamethasone is an artificial glucocorticoid with effective immunosuppressive features, but it also affects other cellular processes (Juszczak and Stankiewicz, 2018; Ronchetti et al., 2018). qRT-PCR for principal proinflammatory cytokines il-1β and tnf-α on horizontal brain sections, comprising population 5/6, showed an ablation-induced increase in the expression of these cytokines in control fish that was consistent with the morphological activation of microglia. This increase was completely inhibited in the presence of dexamethasone (p = 0.918 and 0.9982, respectively, compared with sham injected), indicating that treatment was efficient (Fig. 6A,B).
Figure 6.
6-OHDA injection increases ERG progenitor cell proliferation, which is abolished by dexamethasone treatment. A, B, Levels of il-1β (A) and tnf-α (B) are increased by 6-OHDA treatment at 3 dpi, but not in the presence of dexamethasone, as shown by qRT-PCR. Each condition is normalized to sham-injected fish (shown by the red line; one-tailed one-sample t tests, *p < 0.05). C, The section level of photomicrographs (left) and experimental timeline (right) are given for D–H. D, Overviews of the quantification areas are given. E, Higher magnifications of ventricular cells are given. EdU labels ERG progenitor cells that are only gfap:GFP+ (top row), only olig2:DsRed+ (middle row), or gfap:GFP+/olig2:DsRed+ (bottom row) are indicated by arrowheads. F–H, The proliferation rate in only gfap:GFP+ ERG progenitor cells is increased by 6-OHDA injection and brought back to control levels by dexamethasone treatment (F). A similar nonsignificant trend is observed for only olig2:GFP+ ERG progenitor cells (G), but not for double-labeled ERG progenitor cells (H). To facilitate comparisons between the different populations of ERG progenitor cells, changes induced by the treatments are normalized to the sham-injected group for each population. For F–H, One-way ANOVA with Bonferroni post hoc test: *p < 0.05, **p < 0.01, ***p < 0.001. Error bars represent S.E.M. Scale bars: D, 100 μm; E, 10 μm. Dex, Dexamethasone.
To quantify ERG proliferation, we incubated fish with dexamethasone from 1 to 13 dpi of 6-OHDA and injected EdU at 11 dpi, followed by analysis at 13 dpi (Fig. 6C). In the vicinity of the 5/6 population, most ERG progenitor cells express gfap. Some of these coexpress olig2 and some express only olig2, as indicated by reporter fish double-transgenic for gfap:GFP and olig2:DsRed (Fig. 6D,E). Without dexamethasone, ERG progenitor cells that were only gfap:GFP+ showed increased rates of EdU incorporation after 6-OHDA injection compared with sham-injected animals (Fig. 6F). Although ERG progenitor cells that were only olig2:DsRed+ showed a similar trend (p = 0.079; Fig. 6G), double-labeled ERG progenitor cells did not show any 6-OHDA-induced effect on proliferation (p = 1; Fig. 6H). This shows that specific ERG progenitor cells increase proliferation after the ablation of TH+ neurons.
Dexamethasone had no significant effect on the proliferation rates of any ERG subtype in sham-injected controls, indicating that it likely did not influence ERG proliferation directly (gfap:GFP, p = 0.087; olig2:DsRed, p = 1; gfap:GFP/olig2:DsRed, p = 0.211). In contrast, increased proliferation rates in only gfap:GFP+ ERG progenitor cells of animals injected with 6-OHDA were reduced to those seen in constitutive proliferation. This was statistically significant (Fig. 6F). ERG progenitor cells that were only olig2:DsRed+ showed a similar trend (p = 0.092; Fig. 6G). This showed that only ablation-induced proliferation of gfap:GFP+ ERG progenitor cells depended on immune system activation.
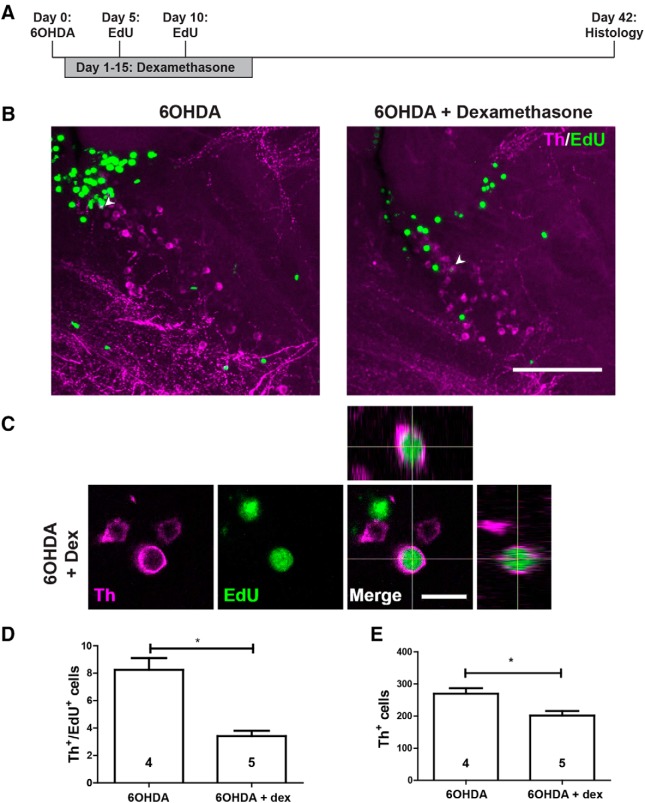
To determine whether this early suppression of the immune response and ERG progenitor cell proliferation had consequences for the addition of newly generated TH+ cells to population 5/6, we incubated animals for 14 d with dexamethasone after ablation and analyzed TH+ neuron addition at 42 d after ablation. This showed lower numbers of TH+/EdU+ neurons and lower overall numbers of TH+ neurons compared with 6-OHDA-treated animals without dexamethasone treatment (Fig. 7A–E). Hence, dexamethasone treatment early after ablation led to reduced rates of ERG progenitor cell proliferation and later TH+ neuron addition to population 5/6. This shows that regenerative neurogenesis depends on immune system activation.
Figure 7.
Dexamethasone inhibits the regeneration of TH+ neurons in the 5/6 population. A, The experimental timeline is given. B, In sagittal sections of population 5/6, EdU+/TH+ neurons are present (arrowheads) after 6-OHDA injection, with (left) or without (right) the addition of dexamethasone. C, High-magnification and orthogonal views of an EdU+/TH+ neuron are shown. D, E, The number of EdU+/TH+ neurons (D; Mann–Whitney U test, *p < 0.05) and the overall number of TH+ neurons (E; Student's t test, *p < 0.05) are reduced by treating 6-OHDA-injected animals with dexamethasone. Scale bars: B, 100 μm; C, 10 μm. dex, Dexamethasone.
Augmenting the immune response enhances ERG proliferation, but not dopaminergic neuron regeneration
To determine whether the immune response was sufficient to induce dopaminergic cell generation and could be augmented to boost regeneration, we used Zymosan A injections into the ventricle, compared with sham-injected controls and 6-OHDA injection (Kyritsis et al., 2012). Zymosan A are glycan complexes prepared from yeast cell walls that directly interact with macrophages/microglia and stimulates the inflammatory response (Novak and Vetvicka, 2008). However, other cells may also react to this stimulus.
6-OHDA, which selectively ablates dopaminergic cells due to its dependency on the presence of dopamine transporter (González-Hernández et al., 2004), only led to a local increase of 4C4 immunoreactivity, secondary to the specific cell death of dopaminergic neurons. Hence, microglia activation was clustered in specific brain nuclei (e.g., in the 5/6 population; Fig. 8A). In contrast, due to its direct action on immune cells, our ventricular injections of Zymosan led to a strong general increase in immunoreactivity for the microglia marker 4C4 that lasted for at least 3 d (Fig. 8A). qRT-PCR measurements indicated a massive 20-fold increase of tnf-α mRNA expression and a 31-fold increase of il-1β mRNA expression at 12 h postinjection (hpi; Fig. 8B). In the presence of dexamethasone, Zymosan-induced increases in tnf-α and il-1β mRNA expression were strongly inhibited. This supports action of both Zymosan and dexamethasone on the immune response. Hence, Zymosan injections can be used to boost the inflammatory reaction.
Without prior ablation of TH+ neurons, Zymosan injections led to increased proliferation of only gfap:GFP+ and only olig2:DsRed+ ERG progenitor cells, but not of double-labeled ERG progenitor cells (ANOVA: p = 0.45) compared with untreated controls (Zymosan A injections at 5 and 10 d after 6-OHDA injection, EdU application at 11 dpi, and analysis at 13 dpi; Fig. 8C–G). After 6-OHDA-mediated cell ablation, Zymosan treatment showed a trend to further enhance proliferation of only gfap:GFP+ ERG progenitor cells compared with fish treated only with 6-OHDA (Fig. 8E). However, this relatively weak additive effect was not statistically significant (p = 0.103). Hence, Zymosan increased the proliferation of mainly gfap:GFP+ ERG progenitor cells independent of an ablation, and potentially slightly increased proliferation beyond the levels induced by 6-OHDA treatment alone.
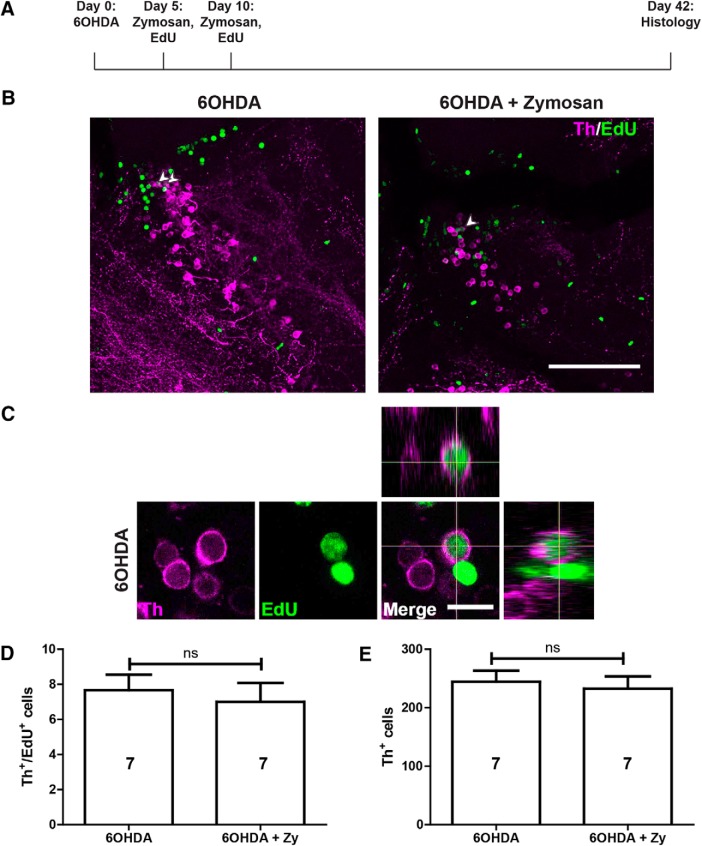
To investigate whether Zymosan treatment was able to improve the regeneration of TH+ neurons after ablation, we analyzed the number of EdU+/TH+ and the total number of TH+ neurons after 6-OHDA-induced ablation in the same experimental timeline as above. We did not observe any changes in EdU+/TH+ (p = 0.193) and the overall numbers of TH+ cells (p = 0.687) compared with animals that only received 6-OHDA injections (Fig. 9A–E). Hence, Zymosan treatment was sufficient to increase ERG proliferation but insufficient to boost the regeneration of TH+ neurons.
Figure 9.
Zymosan treatment does not augment TH+ neuron replacement in population 5/6. A, The experimental timeline is indicated. B, In sagittal sections of population 5/6, TH+/EdU+ neurons can be observed (arrowheads) after 6-OHDA injection with (right) or without the addition of Zymosan (left). C, High-magnification and orthogonal views of an EdU+/TH+ neuron are shown. D, E, The number of TH+/EdU+ neurons (D) and the overall number of TH+ neurons (E) are not increased by treating 6-OHDA-injected animals with Zymosan (Student's t test, p > 0.05). Error bars represent S.E.M. Scale bars: B, 100 μm; C, 10 μm. Zy, Zymosan.
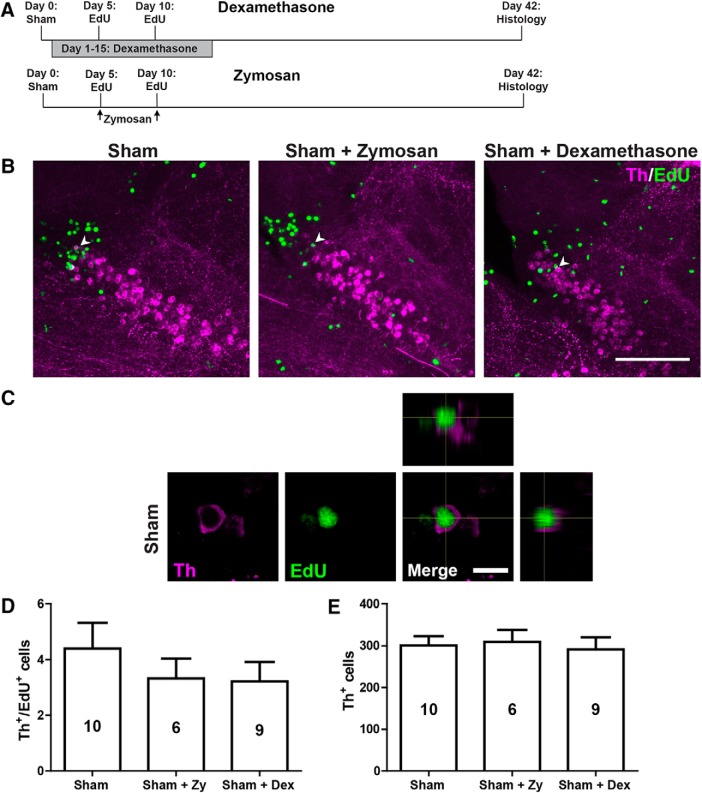
To determine whether manipulations of immune signaling would interfere with constitutive addition of new TH+ cells to the 5/6 population, we compared the numbers of EdU+/TH+ and the overall numbers of TH+ neurons at 42 d after Zymosan (a sham injection followed by two injections of Zymosan at 5 and 10 dpi) or the application of dexamethasone (sham injection followed by incubation from 1 to 15 dpi), as before, but without 6-OHDA injection (Fig. 10A–C). Neither treatment changed the numbers of newly generated (Fig. 10D) or the overall numbers of TH+ cells (Zymosan, p = 0.918; dexamethasone, p = 0.110; Fig. 10E). Hence, constitutive addition of TH+ cells is not affected by immune signals.
Figure 10.
Immune system manipulations in animals without ablation do not influence the addition of new TH+ cells. A, Timelines of experiments with either Zymosan or dexamethasone treatment. B, In sagittal sections of population 5/6, TH+/EdU+ neurons (arrowheads) can be observed in all experimental conditions. C, High-magnification and orthogonal views of a double-labeled neuron in a sham-injected animal are shown. D, E, In animals without TH+ cell ablation, no changes are observed in the number of newly generated TH+ neurons and the overall number of TH neurons after dexamethasone or Zymosan treatment. D, E, One-way ANOVA with Bonferroni post hoc test: p > 0.05. Error bars represent S.E.M. Scale bars: B, 100 μm; C, 10 μm. dex, Dexamethasone; Zy, Zymosan.
LTC4 injections or inhibition of dopamine signaling did not boost ERG proliferation
To dissect whether the effect of immune system stimulation on ERG proliferation may have been mediated by LTC4, as in the mechanically injured telencephalon (Kyritsis et al., 2012), we injected animals with the compound. This elicited a weak microglia response after three daily injections, as shown by 4C4 immunohistochemistry (Fig. 11A–C), but the proliferation of ERG progenitor cells, as measured by counting PCNA+ cells that were gfap:GFP+ and/or olig2:DsRed+ was not altered (p = 0.4286; Fig. 11D–G). This suggests possible brain region-specific mechanisms of ERG proliferation.
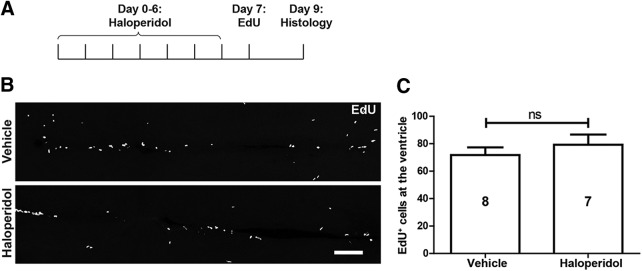
To test whether reduced levels of dopamine after cell ablation (compare Fig. 1D) might also trigger the increase in ERG proliferation, as in the salamander midbrain (Berg et al., 2011), we used extensive (see Materials and Methods) injections of the dopamine D2-like receptor antagonist haloperidol, which is effective in zebrafish (Reimer et al., 2013) to mimic reduced dopamine levels in animals without ablation. However, this did not increase ventricular proliferation compared with sham-injected control animals (p = 0.425; Fig. 12A–C), suggesting the possibility that reduced dopamine levels may not be sufficient to trigger progenitor cell proliferation.
Figure 12.
Inhibition of dopamine signaling does not affect ERG proliferation. A, The experimental timeline for B and C is shown. B, C, Horizontal sections (B) and quantification (C) show no effect of haloperidol on proliferation in the ERG layer. Student's t test, p > 0.05. Error bars represent S.E.M. Scale bar, B, 100 μm.
Ablation of dopaminergic neurons leads to specific functional deficits
To determine whether the loss of TH+ neurons had consequences for the behaviors of the fish, and whether these would be recovered after regeneration, we first recorded individual swimming activity in a round arena for 6 min at 7 d after ablation of fish that received 6-OHDA injections and sham injections. No differences were observed in the distance moved (p = 0.259) and velocity (p = 0.137) or the preference of fish for the periphery or inner zone of the arena (Fig. 13A–C; data not shown). This indicated that swimming capacity and patterns were not overtly affected by the ablation.
We used tests of anxiety-like behaviors, namely the novel tank test, in which fish initially prefer to stay at the bottom of the unfamiliar new tank, and the light/dark choice test (Blaser and Gerlai, 2006; Blaser and Rosemberg, 2012; Stewart et al., 2012), in which fish stay most of the time in the dark compartment. Indeed, fish in all groups showed strong preferences for the bottom of the tank or the dark compartment, respectively, indicating the expected behaviors. However, fish did not show any differences in behavior after 6-OHDA-induced ablation of TH+ neurons (p = 0.147; Fig. 13D–G). Hence, we could not detect the effects of TH+ cell ablation on anxiety-like behaviors.
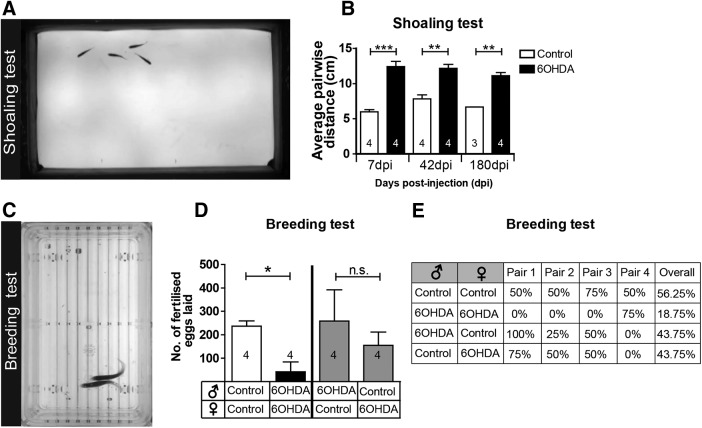
To test movement coordination, we analyzed the shoaling behavior of the fish. Putting four fish together into a tank lets them exhibit shoaling, a natural behavior to swim close to their conspecifics (Engeszer et al., 2004). This behavior requires complex sensory–motor integration to keep the same average distance from each other. We found that shoals made up of fish treated with 6-OHDA swam at an average interindividual distance that was twice as large as that in control shoals at 7, 42, and 180 dpi (Fig. 14A,B). Hence, the ablation of TH+ neurons impaired shoaling behavior, and this behavior was not recovered within 180 dpi.
Figure 14.
Injection of 6-OHDA permanently impairs shoaling behavior and decreases mating success. A, Shoaling behavior as viewed from above in shallow water is shown. B, The average pairwise distance of fish from each other is significantly increased at all time points tested. Student's t tests with Welch's correction for heteroscedastic data were used for pairwise comparisons: *p < 0,05, **p < 0.01, ***p < 0.001. Numbers indicate the number of shoals of four fish each. C, Fish showing mating behavior are shown from above. D, E, Clutch sizes (D) and mating success rates (E) are strongly reduced when animals are mated after 6-OHDA injection. Mating the same females or males with the same control fish showed that mating success does not depend on lack of 6-OHDA in either males or females alone. Numbers indicate different pairs of fish. D, Mann–Whitney U tests, p < 0.05. Error bars represent S.E.M.
We reasoned that if the maneuvering of fish was impaired by the ablation of specific TH+ cells, mating behavior, which requires coordinated swimming of a male and female fish, might also be affected. Alternatively, reproductive functions could be influenced directly by dopamine (Pappas et al., 2010). Indeed, the ablation of TH+ cells in both males and females led to a reduced rate of successful matings and 84% fewer fertilized eggs laid than in control pairs over four mating events. Combining the same control females with the 6-OHDA-treated males and vice versa allowed intermediate egg production and mating success in both groups, indicating that male or female reproductive functions were not selectively affected (Fig. 14C–E). Hence, mating success was strongly impaired only when both males and females lacked specific TH+ neurons. This supports the notion that swimming coordination was permanently affected by the lack of regeneration in population 12 and the LC.
Discussion
Our results show that after ablation, TH+ neurons in some populations are replaced by newly formed neurons. TH+ neurons are derived from specific ERG progenitor cells, which increase proliferation after ablation in the adult zebrafish brain. This regeneration depends on immune system activation. In contrast, TH+ neuron populations with long spinal projections only show sparse and transient replacement of neurons and never recover their spinal projections. Consequently, deficits in shoaling and mating behaviors associated with these anatomical defects never recover (Fig. 15, scheme).
Figure 15.
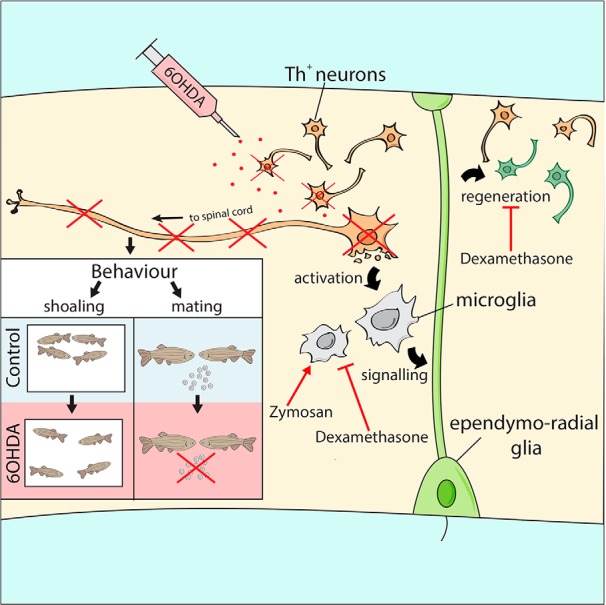
Schematic overview of results. 6-OHDA injection ablates specific TH+ cell populations, leading to a microglia response, which is necessary for the regeneration of new dopaminergic neurons from ERG progenitor cells. This is blocked by dexamethasone, whereas Zymosan stimulates ERG proliferation, but not the addition of TH+ neurons. Neurons projecting to the spinal cord are not replaced, associated with deficits in shoaling and mating behaviors.
TH+ neurons are regenerated from specific ERG progenitor cells after ablation
We observed a regenerative response after the ablation of a subset of TH+ neurons, defined by an increased number of TH+ cells and ERG progenitor cells labeled with a proliferation marker. Genetic lineage tracing showed that ERG progenitor cells gave rise to at least some new TH+ neurons. However, we cannot exclude contributions from unknown progenitors or transdifferentiation of other neurons as a source for new dopaminergic neurons. Hence, the ablation of TH+ neurons is sufficient to elicit a regenerative reaction in ERG progenitor cells and protracted replacement of TH+ neurons.
Not all diencephalic ERG progenitor cells may take part in regenerative neurogenesis of dopaminergic neurons. We find previously unreported heterogeneity in the gene expression and proliferative behavior of these cells. While gfap:GFP+ (overlapping with the ERG progenitor cells labeled by genetic lineage tracing) and olig2:DsRed+ ERG progenitor cells showed increases in proliferation in response to TH+ cell ablation or Zymosan injection, and those that expressed both transgenes did not. This indicates that only specific ERG progenitor cells may act as progenitor cells in a regeneration context. Interestingly, in salamanders, ERG progenitor cells that do not contribute to constitutive neurogenesis are recruited for neurogenesis after the ablation of TH+ cells (Berg et al., 2010). Gfap and olig2 coexpressing ERG progenitor cells in the zebrafish diencephalon may represent an example of an ERG population that cannot be recruited for neurogenesis. Specific repressors of proliferative activity, such as high notch pathway activity, could be a feature of these cells (Dias et al., 2012; Alunni et al., 2013; Than-Trong et al., 2018). Identifying the unique molecular properties of these cells will therefore be an important task for future studies.
In previous ablation experiments in larvae, different observations were made depending on the ablated cell populations. Either enhanced proliferation and replacement of neurons (McPherson et al., 2016) or no reaction and long-term reduction in neuron number (Godoy et al., 2015) have been reported. This underscores our findings that different populations of dopaminergic neurons are not regenerated to the same extent, even in larvae that show higher general proliferative activity than adults. Our observation supports that the loss of TH+ cells leads to increased proliferation of progenitor cells and the replacement of specific dopaminergic neuron populations.
The immune response is necessary for regeneration of TH+ cells
We find that inhibiting the immune response after ablation leads to reduced proliferation in the ventricular zone and fewer new TH+ neurons. Interestingly, only ablation-induced ERG proliferation was affected by this treatment, which is consistent with findings for the zebrafish telencephalon (Kyritsis et al., 2012). It has been proposed that different molecular mechanisms are involved in constitutive and regenerative neurogenesis (Kizil et al., 2012). However, the immune mediator LTC4, reported to promote the immune-dependent progenitor proliferation in the zebrafish telencephalon (Kyritsis et al., 2012), did not elicit the proliferation of ERG progenitor cells in our experiments in the diencephalon, suggesting regional differences of immune to ERG signaling.
Alternatively, ERG progenitor cells could be derepressed in their activity by the observed reduction of dopamine levels in the brain. This has been demonstrated to be the case in the midbrain of salamanders (Berg et al., 2011). However, injecting haloperidol into untreated fish to mimic reduced levels of dopamine after ablation did not lead to increased ERG proliferation in the brains of zebrafish. This points to potential species-specific differences in the control of progenitor cell proliferation between zebrafish and salamanders.
Remarkably, boosting the immune reaction with Zymosan was sufficient to enhance ERG progenitor cell proliferation, but was insufficient to increase the number of new TH+ neurons in animals with and without prior ablation of TH+ neurons. This suggests that additional factors, not derived from the immune system, may be necessary for TH+ neuron differentiation and replacement.
What are the reasons for differential regeneration of dopaminergic neuron populations?
The constitutive neurogenesis we observed in specific brain nuclei correlates with regenerative success. For example, there is ongoing addition of TH+ cells in the regeneration-competent 5/6 population without any ablation, but this is not detectable in the nonregenerated populations 12 and LC. We speculate that in brain nuclei that constitutively integrate new neurons, factors that support the integration of new neurons, such as neurotrophic factors and axon guidance molecules, might be present, whereas these could have been developmentally downregulated in populations that do not add new neurons in adults. Integration promoting factors may be rate limiting for regeneration.
Alternatively, new neurons may fail to integrate into the network and perish. This may be pronounced for population 12 and the LC, which show complex axon projections (Tay et al., 2011). Some dopaminergic cells managed to repopulate population 12 and LC, but they did not persist. These populations have neurons with particularly long axons that are led by complex guidance molecule patterns (e.g., to the spinal cord during development; Kastenhuber et al., 2009). These patterns may have disappeared in adults and thus explain failure of these neurons to reinnervate the spinal cord. Some long-range axons can successfully navigate the adult zebrafish brain, such as regenerating optic axons (Wyatt et al., 2010), but particular populations of axons descending to the spinal cord do not readily regenerate (Becker et al., 1998; Bhatt et al., 2004). This correlates with constitutive neurogenesis in the optic system, but not in the descending brainstem projection.
Specific ablation of circumscribed TH+ populations offers clues to their function
The long-lasting loss of ∼28 dopaminergic neurons in population 12 and of 18 noradrenergic neurons in the LC is associated with highly specific functional deficits in shoaling and mating, but not overall locomotion or anxiety-like behaviors. Previous studies showed reduced overall locomotion after the application of 6-OHDA in adult zebrafish. However, in these studies, application routes were different, creating larger ablation in the brain (Vijayanathan et al., 2017) or peripheral rather than central lesions (Anichtchik et al., 2004).
Among the lost neurons, population 12 contains the neurons that give rise to the evolutionarily conserved diencephalo-spinal tract, providing the entire dopaminergic innervation of the spinal cord in most vertebrates (Tay et al., 2011). Loss of this tract in larval zebrafish leads to hypolocomotion, due to a reduction in the number of swimming bouts (Thirumalai and Cline, 2008; Jay et al., 2015). Large-scale ablation of diencephalic dopaminergic neurons in larvae also led to motor impairments (Lam et al., 2005). We speculate that, in adults, dopamine in the spinal cord, which is almost completely missing after ablation, may modulate the initiation of movement changes necessary for efficient shoaling and mating behavior. However, descending dopaminergic projections also innervate the sensory lateral line (Bricaud et al., 2001; Jay et al., 2015). Altered sensation of water movements could thus also contribute to impaired ability to maneuver. Moreover, population 12 neurons have ascending projections (Tay et al., 2011) that could also be functionally important. We can also not exclude that some ablated dopaminergic neurons escaped our analysis but contributed to functional deficits.
Altered shoaling behavior (Scerbina et al., 2012) and anxiety-like behavior (Tran et al., 2016; Wang et al., 2016) has previously been correlated with alterations of the dopaminergic system, but not pinpointed to specific neuronal populations. Our results support that the <50 neurons that form the descending dopaminergic and noradrenergic projections are involved in shoaling behavior, but not anxiety-like behavior, as has been found for global manipulations of dopamine (Kacprzak et al., 2017).
Dopamine-dependent behaviors can be recovered following the regeneration of dopaminergic neurons. For example, in larval zebrafish, swimming frequency is normalized again after the ablation and regeneration of hypothalamic dopaminergic neurons (McPherson et al., 2016). In salamanders, amphetamine-inducible locomotion is recovered, correlated with the regeneration of TH+ neurons after 6-OHDA-mediated ablation (Parish et al., 2007). Here we show that the regeneration of specific TH+ neurons that project to the spinal cord is surprisingly limited in adult zebrafish and not functionally compensated, which leads to permanent functional deficits in a generally regeneration-competent vertebrate.
Conclusion
Specific TH+ neuronal populations in adult zebrafish show an unexpected heterogeneity in their capacity to be regenerated from specific progenitor populations. This system is useful to dissect the mechanisms of successful and unsuccessful functional neuronal regeneration in the same model, and we show here that the immune response is critical for regeneration. Ultimately, manipulations of immune mechanisms in conjunction with prodifferentiation factors may be used to activate proregenerative mechanisms also in mammals to lead to the generation and functional integration of new dopaminergic neurons.
Footnotes
This work was supported by the Biotechnology and Biological Sciences Research Council (BBSRC; Grant BB/M003892/1 to C.G.B. and T.B.), a Medical Research Council Doctoral Training Grant PhD Studentship (to N.O.D.), a BBSRC EASTBIO (East of Scotland BioScience Doctoral Training Partnership) PhD Studentship (to L.J.C.), and a grant from the Sigrid Juselius Foundation to S.A.S. and P.P. We thank Drs. Bruce Appel, Marc Ekker, Daniel Goldman, and Pamela Raymond for transgenic fish; Joe Finney for data analysis; and Stephen West for discussions.
J.D.A. is the founding director of Actual Analytics Ltd. The authors declare no other competing financial interests.
References
- Alunni A, Bally-Cuif L (2016) A comparative view of regenerative neurogenesis in vertebrates. Development 143:741–753. 10.1242/dev.122796 [DOI] [PMC free article] [PubMed] [Google Scholar]
- Alunni A, Krecsmarik M, Bosco A, Galant S, Pan L, Moens CB, Bally-Cuif L (2013) Notch3 signaling gates cell cycle entry and limits neural stem cell amplification in the adult pallium. Development 140:3335–3347. 10.1242/dev.095018 [DOI] [PMC free article] [PubMed] [Google Scholar]
- Anichtchik OV, Kaslin J, Peitsaro N, Scheinin M, Panula P (2004) Neurochemical and behavioural changes in zebrafish danio rerio after systemic administration of 6-hydroxydopamine and 1-methyl-4-phenyl-1,2,3,6-tetrahydropyridine. J Neurochem 88:443–453. 10.1111/j.1471-4159.2004.02190.x [DOI] [PubMed] [Google Scholar]
- Barreiro-Iglesias A, Mysiak KS, Scott AL, Reimer MM, Yang Y, Becker CG, Becker T (2015) Serotonin promotes development and regeneration of spinal motor neurons in zebrafish. Cell Rep 13:924–932. 10.1016/j.celrep.2015.09.050 [DOI] [PMC free article] [PubMed] [Google Scholar]
- Becker CG, Becker T (2015) Neuronal regeneration from ependymo-radial glial cells: cook, little pot, cook! Dev Cell 32:516–527. 10.1016/j.devcel.2015.01.001 [DOI] [PubMed] [Google Scholar]
- Becker T, Becker CG (2001) Regenerating descending axons preferentially reroute to the gray matter in the presence of a general macrophage/microglial reaction caudal to a spinal transection in adult zebrafish. J Comp Neurol 433:131–147. 10.1002/cne.1131 [DOI] [PubMed] [Google Scholar]
- Becker T, Bernhardt RR, Reinhard E, Wullimann MF, Tongiorgi E, Schachner M (1998) Readiness of zebrafish brain neurons to regenerate a spinal axon correlates with differential expression of specific cell recognition molecules. J Neurosci 18:5789–5803. 10.1523/JNEUROSCI.18-15-05789.1998 [DOI] [PMC free article] [PubMed] [Google Scholar]
- Berg DA, Kirkham M, Beljajeva A, Knapp D, Habermann B, Ryge J, Tanaka EM, Simon A (2010) Efficient regeneration by activation of neurogenesis in homeostatically quiescent regions of the adult vertebrate brain. Development 137:4127–4134. 10.1242/dev.055541 [DOI] [PubMed] [Google Scholar]
- Berg DA, Kirkham M, Wang H, Frisén J, Simon A (2011) Dopamine controls neurogenesis in the adult salamander midbrain in homeostasis and during regeneration of dopamine neurons. Cell Stem Cell 8:426–433. 10.1016/j.stem.2011.02.001 [DOI] [PubMed] [Google Scholar]
- Bernardos RL, Raymond PA (2006) GFAP transgenic zebrafish. Gene Expr Patterns 6:1007–1013. 10.1016/j.modgep.2006.04.006 [DOI] [PubMed] [Google Scholar]
- Bhatt DH, Otto SJ, Depoister B, Fetcho JR (2004) Cyclic AMP-induced repair of zebrafish spinal circuits. Science 305:254–258. 10.1126/science.1098439 [DOI] [PubMed] [Google Scholar]
- Blaser R, Gerlai R (2006) Behavioral phenotyping in zebrafish: comparison of three behavioral quantification methods. Behav Res Methods 38:456–469. 10.3758/BF03192800 [DOI] [PubMed] [Google Scholar]
- Blaser RE, Rosemberg DB (2012) Measures of anxiety in zebrafish (Danio rerio): dissociation of black/white preference and novel tank test. PLoS One 7:e36931. 10.1371/journal.pone.0036931 [DOI] [PMC free article] [PubMed] [Google Scholar]
- Boniface EJ, Lu J, Victoroff T, Zhu M, Chen W (2009) FlEx-based transgenic reporter lines for visualization of cre and flp activity in live zebrafish. Genesis 47:484–491. 10.1002/dvg.20526 [DOI] [PMC free article] [PubMed] [Google Scholar]
- Bricaud O, Chaar V, Dambly-Chaudière C, Ghysen A (2001) Early efferent innervation of the zebrafish lateral line. J Comp Neurol 434:253–261. 10.1002/cne.1175 [DOI] [PubMed] [Google Scholar]
- Chen YC, Priyadarshini M, Panula P (2009) Complementary developmental expression of the two tyrosine hydroxylase transcripts in zebrafish. Histochem Cell Biol 132:375–381. 10.1007/s00418-009-0619-8 [DOI] [PubMed] [Google Scholar]
- Dias TB, Yang YJ, Ogai K, Becker T, Becker CG (2012) Notch signaling controls generation of motor neurons in the lesioned spinal cord of adult zebrafish. J Neurosci 32:3245–3252. 10.1523/JNEUROSCI.6398-11.2012 [DOI] [PMC free article] [PubMed] [Google Scholar]
- Ding YM, Jaumotte JD, Signore AP, Zigmond MJ (2004) Effects of 6-hydroxydopamine on primary cultures of substantia nigra: specific damage to dopamine neurons and the impact of glial cell line-derived neurotrophic factor. J Neurochem 89:776–787. 10.1111/j.1471-4159.2004.02415.x [DOI] [PubMed] [Google Scholar]
- Engeszer RE, Ryan MJ, Parichy DM (2004) Learned social preference in zebrafish. Curr Biol 14:881–884. 10.1016/j.cub.2004.04.042 [DOI] [PubMed] [Google Scholar]
- Ghosh S, Hui SP (2016) Regeneration of zebrafish CNS: adult neurogenesis. Neural Plast 2016:5815439. 10.1155/2016/5815439 [DOI] [PMC free article] [PubMed] [Google Scholar]
- Godoy R, Noble S, Yoon K, Anisman H, Ekker M (2015) Chemogenetic ablation of dopaminergic neurons leads to transient locomotor impairments in zebrafish larvae. J Neurochem 135:249–260. 10.1111/jnc.13214 [DOI] [PubMed] [Google Scholar]
- González-Hernández T, Barroso-Chinea P, De La Cruz Muros I, Del Mar Pérez-Delgado M, Rodríguez M (2004) Expression of dopamine and vesicular monoamine transporters and differential vulnerability of mesostriatal dopaminergic neurons. J Comp Neurol 479:198–215. 10.1002/cne.20323 [DOI] [PubMed] [Google Scholar]
- Grandel H, Brand M (2013) Comparative aspects of adult neural stem cell activity in vertebrates. Dev Genes Evol 223:131–147. 10.1007/s00427-012-0425-5 [DOI] [PubMed] [Google Scholar]
- Grandel H, Kaslin J, Ganz J, Wenzel I, Brand M (2006) Neural stem cells and neurogenesis in the adult zebrafish brain: origin, proliferation dynamics, migration and cell fate. Dev Biol 295:263–277. 10.1016/j.ydbio.2006.03.040 [DOI] [PubMed] [Google Scholar]
- Jay M, De Faveri F, McDearmid JR (2015) Firing dynamics and modulatory actions of supraspinal dopaminergic neurons during zebrafish locomotor behavior. Curr Biol 25:435–444. 10.1016/j.cub.2014.12.033 [DOI] [PMC free article] [PubMed] [Google Scholar]
- Jessberger S. (2016) Neural repair in the adult brain. F1000Research 5:F1000 Faculty Rev-169. 10.12688/f1000research.7459.1 [DOI] [PMC free article] [PubMed] [Google Scholar]
- Juszczak GR, Stankiewicz AM (2018) Glucocorticoids, genes and brain function. Prog Neuropsychopharmacol Biol Psychiatry 82:136–168. 10.1016/j.pnpbp.2017.11.020 [DOI] [PubMed] [Google Scholar]
- Kacprzak V, Patel NA, Riley E, Yu L, Yeh JJ, Zhdanova IV (2017) Dopaminergic control of anxiety in young and aged zebrafish. Pharmacol Biochem Behav 157:1–8. 10.1016/j.pbb.2017.01.005 [DOI] [PMC free article] [PubMed] [Google Scholar]
- Kastenhuber E, Kern U, Bonkowsky JL, Chien CB, Driever W, Schweitzer J (2009) Netrin-DCC, Robo-Slit, and heparan sulfate proteoglycans coordinate lateral positioning of longitudinal dopaminergic diencephalospinal axons. J Neurosci 29:8914–8926. 10.1523/JNEUROSCI.0568-09.2009 [DOI] [PMC free article] [PubMed] [Google Scholar]
- Kizil C, Kyritsis N, Dudczig S, Kroehne V, Freudenreich D, Kaslin J, Brand M (2012) Regenerative neurogenesis from neural progenitor cells requires injury-induced expression of Gata3. Dev Cell 23:1230–1237. 10.1016/j.devcel.2012.10.014 [DOI] [PubMed] [Google Scholar]
- Knopf F, Schnabel K, Haase C, Pfeifer K, Anastassiadis K, Weidinger G (2010) Dually inducible TetON systems for tissue-specific conditional gene expression in zebrafish. Proc Natl Acad Sci U S A 107:19933–19938. 10.1073/pnas.1007799107 [DOI] [PMC free article] [PubMed] [Google Scholar]
- Kroehne V, Freudenreich D, Hans S, Kaslin J, Brand M (2011) Regeneration of the adult zebrafish brain from neurogenic radial glia-type progenitors. Development 138:4831–4841. 10.1242/dev.072587 [DOI] [PubMed] [Google Scholar]
- Kucenas S, Takada N, Park HC, Woodruff E, Broadie K, Appel B (2008) CNS-derived glia ensheath peripheral nerves and mediate motor root development. Nat Neurosci 11:143–151. 10.1038/nn2025 [DOI] [PMC free article] [PubMed] [Google Scholar]
- Kuscha V, Barreiro-Iglesias A, Becker CG, Becker T (2012) Plasticity of tyrosine hydroxylase and serotonergic systems in the regenerating spinal cord of adult zebrafish. J Comp Neurol 520:933–951. 10.1002/cne.22739 [DOI] [PubMed] [Google Scholar]
- Kyritsis N, Kizil C, Zocher S, Kroehne V, Kaslin J, Freudenreich D, Iltzsche A, Brand M (2012) Acute inflammation initiates the regenerative response in the adult zebrafish brain. Science 338:1353–1356. 10.1126/science.1228773 [DOI] [PubMed] [Google Scholar]
- Lam CS, Korzh V, Strahle U (2005) Zebrafish embryos are susceptible to the dopaminergic neurotoxin MPTP. Eur J Neurosci 21:1758–1762. 10.1111/j.1460-9568.2005.03988.x [DOI] [PubMed] [Google Scholar]
- Lambert AM, Bonkowsky JL, Masino MA (2012) The conserved dopaminergic diencephalospinal tract mediates vertebrate locomotor development in zebrafish larvae. J Neurosci 32:13488–13500. 10.1523/JNEUROSCI.1638-12.2012 [DOI] [PMC free article] [PubMed] [Google Scholar]
- Matsui H, Sugie A (2017) An optimized method for counting dopaminergic neurons in zebrafish. PLoS One 12:e0184363. 10.1371/journal.pone.0184363 [DOI] [PMC free article] [PubMed] [Google Scholar]
- McLean DL, Fetcho JR (2004a) Ontogeny and innervation patterns of dopaminergic, noradrenergic, and serotonergic neurons in larval zebrafish. J Comp Neurol 480:38–56. 10.1002/cne.20280 [DOI] [PubMed] [Google Scholar]
- McLean DL, Fetcho JR (2004b) Relationship of tyrosine hydroxylase and serotonin immunoreactivity to sensorimotor circuitry in larval zebrafish. J Comp Neurol 480:57–71. 10.1002/cne.20281 [DOI] [PubMed] [Google Scholar]
- McPherson AD, Barrios JP, Luks-Morgan SJ, Manfredi JP, Bonkowsky JL, Douglass AD, Dorsky RI (2016) Motor behavior mediated by continuously generated dopaminergic neurons in the zebrafish hypothalamus recovers after cell ablation. Curr Biol 26:263–269. 10.1016/j.cub.2015.11.064 [DOI] [PMC free article] [PubMed] [Google Scholar]
- Novak M, Vetvicka V (2008) Beta-glucans, history, and the present: immunomodulatory aspects and mechanisms of action. J Immunotoxicol 5:47–57. 10.1080/15476910802019045 [DOI] [PubMed] [Google Scholar]
- Ohnmacht J, Yang Y, Maurer GW, Barreiro-Iglesias A, Tsarouchas TM, Wehner D, Sieger D, Becker CG, Becker T (2016) Spinal motor neurons are regenerated after mechanical lesion and genetic ablation in larval zebrafish. Development 143:1464–1474. 10.1242/dev.129155 [DOI] [PMC free article] [PubMed] [Google Scholar]
- Pappas SS, Tiernan CT, Behrouz B, Jordan CL, Breedlove SM, Goudreau JL, Lookingland KJ (2010) Neonatal androgen-dependent sex differences in lumbar spinal cord dopamine concentrations and the number of A11 diencephalospinal dopamine neurons. J Comp Neurol 518:2423–2436. 10.1002/cne.22340 [DOI] [PMC free article] [PubMed] [Google Scholar]
- Parish CL, Beljajeva A, Arenas E, Simon A (2007) Midbrain dopaminergic neurogenesis and behavioural recovery in a salamander lesion-induced regeneration model. Development 134:2881–2887. 10.1242/dev.002329 [DOI] [PubMed] [Google Scholar]
- Péron S, Berninger B (2015) Reawakening the sleeping beauty in the adult brain: neurogenesis from parenchymal glia. Curr Opin Genet Dev 34:46–53. 10.1016/j.gde.2015.07.004 [DOI] [PubMed] [Google Scholar]
- Ramachandran R, Reifler A, Parent JM, Goldman D (2010) Conditional gene expression and lineage tracing of tuba1a expressing cells during zebrafish development and retina regeneration. J Comp Neurol 518:4196–4212. 10.1002/cne.22448 [DOI] [PMC free article] [PubMed] [Google Scholar]
- Reimer MM, Sörensen I, Kuscha V, Frank RE, Liu C, Becker CG, Becker T (2008) Motor neuron regeneration in adult zebrafish. J Neurosci 28:8510–8516. 10.1523/JNEUROSCI.1189-08.2008 [DOI] [PMC free article] [PubMed] [Google Scholar]
- Reimer MM, Norris A, Ohnmacht J, Patani R, Zhong Z, Dias TB, Kuscha V, Scott AL, Chen YC, Rozov S, Frazer SL, Wyatt C, Higashijima S, Patton EE, Panula P, Chandran S, Becker T, Becker CG (2013) Dopamine from the brain promotes spinal motor neuron generation during development and adult regeneration. Dev Cell 25:478–491. 10.1016/j.devcel.2013.04.012 [DOI] [PubMed] [Google Scholar]
- Ronchetti S, Migliorati G, Bruscoli S, Riccardi C (2018) Defining the role of glucocorticoids in inflammation. Clin Sci (Lond) 132:1529–1543. 10.1042/CS20171505 [DOI] [PubMed] [Google Scholar]
- Sallinen V, Torkko V, Sundvik M, Reenilä I, Khrustalyov D, Kaslin J, Panula P (2009) MPTP and MPP+ target specific aminergic cell populations in larval zebrafish. J Neurochem 108:719–731. 10.1111/j.1471-4159.2008.05793.x [DOI] [PubMed] [Google Scholar]
- Scerbina T, Chatterjee D, Gerlai R (2012) Dopamine receptor antagonism disrupts social preference in zebrafish: a strain comparison study. Amino Acids 43:2059–2072. 10.1007/s00726-012-1284-0 [DOI] [PMC free article] [PubMed] [Google Scholar]
- Skaggs K, Goldman D, Parent JM (2014) Excitotoxic brain injury in adult zebrafish stimulates neurogenesis and long-distance neuronal integration. Glia 62:2061–2079. 10.1002/glia.22726 [DOI] [PMC free article] [PubMed] [Google Scholar]
- Stewart A, Gaikwad S, Kyzar E, Green J, Roth A, Kalueff AV (2012) Modeling anxiety using adult zebrafish: a conceptual review. Neuropharmacology 62:135–143. 10.1016/j.neuropharm.2011.07.037 [DOI] [PMC free article] [PubMed] [Google Scholar]
- Tay TL, Ronneberger O, Ryu S, Nitschke R, Driever W (2011) Comprehensive catecholaminergic projectome analysis reveals single-neuron integration of zebrafish ascending and descending dopaminergic systems. Nat Commun 2:171. 10.1038/ncomms1171 [DOI] [PMC free article] [PubMed] [Google Scholar]
- Than-Trong E, Ortica-Gatti S, Mella S, Nepal C, Alunni A, Bally-Cuif L (2018) Neural stem cell quiescence and stemness are molecularly distinct outputs of the Notch3 signalling cascade in the vertebrate adult brain. Development 145:dev161034. 10.1242/dev.161034 [DOI] [PMC free article] [PubMed] [Google Scholar]
- Thirumalai V, Cline HT (2008) Endogenous dopamine suppresses initiation of swimming in pre-feeding zebrafish larvae. J Neurophysiol 100:1635–1648. 10.1152/jn.90568.2008 [DOI] [PMC free article] [PubMed] [Google Scholar]
- Tieu K. (2011) A guide to neurotoxic animal models of Parkinson's disease. Cold Spring Harb Perspect Med 1:a009316. 10.1101/cshperspect.a009316 [DOI] [PMC free article] [PubMed] [Google Scholar]
- Tran S, Nowicki M, Muraleetharan A, Chatterjee D, Gerlai R (2016) Neurochemical factors underlying individual differences in locomotor activity and anxiety-like behavioral responses in zebrafish. Prog Neuropsychopharmacol Biol Psychiatry 65:25–33. 10.1016/j.pnpbp.2015.08.009 [DOI] [PubMed] [Google Scholar]
- Vijayanathan Y, Lim FT, Lim SM, Long CM, Tan MP, Majeed ABA, Ramasamy K (2017) 6-OHDA-lesioned adult zebrafish as a useful Parkinson's disease model for dopaminergic neuroregeneration. Neurotox Res 32:496–508. 10.1007/s12640-017-9778-x [DOI] [PubMed] [Google Scholar]
- Wang Y, Li S, Liu W, Wang F, Hu LF, Zhong ZM, Wang H, Liu CF (2016) Vesicular monoamine transporter 2 (Vmat2) knockdown elicits anxiety-like behavior in zebrafish. Biochem Biophys Res Commun 470:792–797. 10.1016/j.bbrc.2016.01.079 [DOI] [PubMed] [Google Scholar]
- Westerfield M. (2000) The zebrafish book: a guide for the laboratory use of zebrafish (Danio rerio), Ed 4 Eugene, OR: University of Oregon. [Google Scholar]
- Wyatt C, Ebert A, Reimer MM, Rasband K, Hardy M, Chien CB, Becker T, Becker CG (2010) Analysis of the astray/robo2 zebrafish mutant reveals that degenerating tracts do not provide strong guidance cues for regenerating optic axons. J Neurosci 30:13838–13849. 10.1523/JNEUROSCI.3846-10.2010 [DOI] [PMC free article] [PubMed] [Google Scholar]
- Xi Y, Yu M, Godoy R, Hatch G, Poitras L, Ekker M (2011) Transgenic zebrafish expressing green fluorescent protein in dopaminergic neurons of the ventral diencephalon. Dev Dyn 240:2539–2547. 10.1002/dvdy.22742 [DOI] [PubMed] [Google Scholar]


