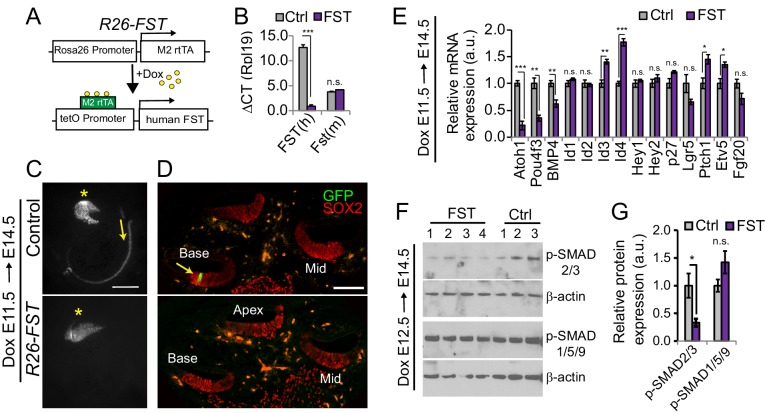
Figure 3. FST overexpression interferes with auditory hair cell differentiation.
(A) Inducible FST transgenic mouse model. In the presence of doxycycline (dox) double transgenic animals (R26-M2rtTA and tetO-human FST) express human FST under the control of the R26 promoter (R26-FST). Non-transgenic littermates and littermates that carry only one of the transgenes were used as experimental controls (Ctrl). (B) Human (h) FST transgene expression in control (Ctrl) and R26-FST transgenic (FST) cochlear epithelia after 48 hr of dox administration. Plotted is the difference in cycle threshold (ΔCT) compared to the reference gene Rpl19. Data expressed as mean ± SEM (n = 4 animals per group, ***p≤0.001, student’s t-test). (C) Low power fluorescent images showing native Atoh1-GFP reporter expression (GFP, gray) in wild type (control) and FST overexpressing (R26-FST) cochleae stage E14.5. Asterisks mark the vestibular saccule that contain GFP positive hair cells. Yellow arrows mark the onset of hair cell differentiation within the cochlea. Scale bar 100 µm. (D) Confocal images of wild type (control) and FST overexpressing (R26-FST) cochlear cross sections, stage E14.5. GFP expression (GFP, green) marks hair cells (yellow arrow), SOX2 staining (red) marks the sensory domain. Scale bar 100 µm. (E) RT-qPCR-based analysis of gene expression in FST overexpressing (FST) and control cochlear epithelia (Ctrl). Data are mean ± SEM (n = 4–5 animals per group, *p<0.05, **p<0.01, ***p<0.001, student’s t-test). (F) Western blot-based analysis of p-SMAD2/3 and p-SMAD1/5/9 protein expression in stage E14.5 FST transgenic (FST: 1–4) and control (Ctrl: 1–3) cochlear epithelia. Beta-actin was used as loading control. (G) Quantification of p-SMAD2/3 and p-SMAD1/5/9 protein levels in F.

