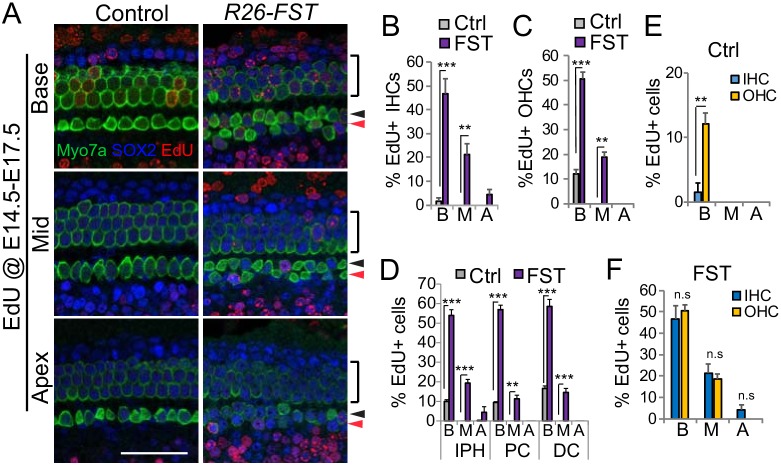
Figure 8. Overexpression of FST disrupts a medial-lateral gradient of pro-sensory cell cycle exit.
Timed mated pregnant dam received dox beginning at E11.5, followed by two daily injections of EdU starting at E14.5 until E17.5. At E18.5, FST transgenic (R26-FST) embryos and their control (single transgenic) littermates were harvested and analyzed for EdU incorporation (red). (A) Shown are basal, mid and apical segments of control and FST overexpressing auditory sensory epithelia. Myo7a immuno-staining (green) marks inner (black arrowhead), outer (black bar) and ectopic inner hair cells (red arrow head). SOX2 immuno-staining (blue) marks surrounding supporting cells and less mature hair cells. Scale bar, 50 µm. (B–C) FST overexpression (FST, purple bars) significantly increases the percentage of EdU positive inner (IHC) (B) and outer hair cells (OHC) (C) compared to control (Ctrl, gray bars). (D) FST overexpression (FST, purple bars) significantly increases the percentage of EdU positive inner phalangeal cells (IPH), pillar cells (PC) and Deiters cells compared to control (Ctrl, gray bars). (E) In control cochlear tissue IHCs (blue) incorporate EdU at a significantly lower rate than OHCs (yellow). (F) In FST overexpressing cochlear tissue IHCs (blue) and OHCs (yellow) incorporate EdU at a similar rate. Abbreviations: B, base; M, mid; A, apex. Data expressed as mean ± SEM (n = 3 animals per group **p<0.01, ***p<0.001, student’s t-test).

