

Abstract
Anti-PD-1 agents, alone or in combination with ipilimumab, produce durable responses in some melanoma patients. Tumor features that correlate with response are not well defined. We collected clinical data from metastatic melanoma patients treated at two centers who received anti-PD-1 (n=303) or anti-PD-1 + ipilimumab (n=57). We correlated number of metastases, diameter of largest tumor (tumor bulk), and organ involvement with response rate (RR), progression-free survival (PFS) and overall survival (OS). Patients with diameter of largest tumor ≤ 2cm had a 53% RR while those with largest tumor >2cm had a 38% RR (p=0.009). Those with liver metastases had lower RR (25% vs. 43%, p=0.002). RR to anti-PD-1 was greater in patients with ≤10 metastases compared with those with >10 (39% vs. 27%, p=0.027). In multivariable analyses, size of the largest tumor was independently associated with PFS (p=0.0005), OS (p<0.0001), and RR (p=0.02) whereas AJCC stage, lactate dehydrogenase, liver metastases, ECOG performance status, number of metastases, and prior therapies were not. In patients treated with anti-PD-1 + ipilimumab, however, tumor bulk was not associated with outcomes, although number of metastases was associated with PFS (p=0.035) and RR (p=0.009) but not OS. Pathologic analysis did not reveal differences in T cell infiltration in bulky vs. small tumors. Tumor bulk, defined by diameter of largest tumor, was strongly and independently associated with clinical outcomes in anti-PD-1 but not in anti-PD-1 + ipilimumab. In conjunction with molecular biomarkers, clinical predictors may help guide selection of immunotherapy agents.
Keywords: melanoma, ipilimumab, nivolumab, pembrolizumab, response, tumor bulk
Background
Immune checkpoint inhibitors have revolutionized the treatment of melanoma. In 2011, the FDA approved the first checkpoint inhibitor, ipilimumab, a fully human monoclonal antibody that blocks cytotoxic T-lymphocyte-associated antigen (CTLA-4), for metastatic or unresectable melanoma. Patients treated with ipilimumab had a median overall survival (OS) of 10 months and a response rate (RR) of 11%1. In 2014, the FDA approved nivolumab2 and pembrolizumab3, both anti-programmed death 1 (PD-1) monoclonal antibodies, based upon an improvement in outcomes compared with chemotherapy or ipilimumab. Less than one year later, the combination of ipilimumab and nivolumab was also approved after demonstrating an improved response and PFS compared with single-agent nivolumab2, 3. Despite these impressive treatment responses and survival benefits, many patients fail front-line immunotherapy and thus have a very poor prognosis.
Factors that predict melanoma response to immunotherapy need further elucidation. Some biomarkers such as mutational burden4, PD-L1 expression5, major histocompatibility expression6, RNA sequencing signatures7, 8 have been associated with response and/or survival following treatment with anti-PD-1. Several studies have also suggested that clinical factors influence the response to therapy, including melanoma subtype9–11, peripheral blood count ratios12, liver metastases13, tumor stage, and lactate dehydrogenase levels14. These findings underscore the complexity of response to immune checkpoint inhibitors, and the need for further understanding of clinical and genomic biomarkers.
We hypothesized that clinical factors could identify correlations with response and yield insights into mechanisms of resistance. Specifically, we hypothesized that the size, location, and number of metastases could influence the immune microenvironment, thus impacting clinical outcomes. Therefore, we performed a retrospective analysis of patients with metastatic melanoma from two centers who had been treated with immune checkpoint inhibitors to identify clinical factors associated with therapeutic benefits. We also performed translational studies to elucidate potential mechanisms of resistance to checkpoint inhibitor therapy.
Methods
Study design and participants
Data was collected from two large volume academic melanoma centers. Institutional review board approval was obtained at each institution. Patients with metastatic melanoma who had received immunotherapy with an anti PD-1 agent (pembrolizumab or nivolumab) or ipilimumab in combination with nivolumab between October 13, 2009 and October 14, 2016 were identified. Clinical data at the time of treatment initiation were collected including age, sex, AJCC stage, serum lactate dehydrogenase (LDH), ECOG performance status, type of immunotherapy treatment, prior treatment(s), site(s) of metastatic disease, number of metastases, and diameter of largest tumor (used as a surrogate for tumor bulk). Response to treatment was assessed by Response Evaluation Criteria in Solid Tumors (RECIST) version 1.1. The number of metastases, size of largest metastasis, and location of metastases obtained from review of radiology images and reports were correlated with RR, PFS, and OS. PFS was measured from the start of immunotherapy to time of progression or death. OS was measured from the start of immunotherapy to the time of death.
Statistical analysis
Statistical data analyses were performed in R 3.4.3. For descriptive statistics, between-group differences were assessed with two-sample t-test. Nonparametric Wilcoxon rank-sum test was used when assumptions for parametric methods were not met. Binary and categorical data were analyzed with Fisher’s exact test or chi-squared test. Univariable time-to-event data analyses were conducted using Kaplan-Meier estimates and log-rank tests. The Cox proportional hazards were used for multivariable modeling. Tests were considered significant at two-sided 5% significance level.
T cell analysis
Archival formalin-fixed, paraffin embedded melanoma samples were retrieved for a subset of patients included in this study. Tumors were selected as “large: (>4cm) and “small (≤4cm) to determine lymphocyte infiltration differences in relation to tumor bulk. Immunohistochemical studies were evaluated independently by a dermatopathologist (R.N.A.) blinded to the clinical data and outcomes. The inflammatory infiltrate for large and small metastatic foci of the same cases were evaluated separately. The infiltrate for each tumor was scored at the center and the periphery of each tumor in accordance to the gross description and histologic evaluation. Immunohistochemical studies for CD4, CD8 (cytoplasmic markers) and FOXP3 (nuclear marker) were scored as: (0) for absent staining, (1) positive staining is in less than 5% of the cells, (2) positive staining between 5–10% of the cells, (3) positive staining is between 10–50% of the cells, and (4) positive staining is more than 50% of the cells. PD-L1 membranous expression was observed on both tumor cells and immune cells (differentiated based on morphologic features) and scored separately. The PD-L1 scores ranged from: 0– 5%, 10% and 10% increments.
Results
A total of 360 patients were included in this study. Patient and disease characteristics are listed in Table 1. Fifty-seven patients received ipilimumab and nivolumab, and 303 patients received an anti-PD-1 agent alone. The median age of all patients was 63 years old (range, 22–93 years). Including all patients, there was a higher frequency of males (62%) and those with AJCC stage M1c disease (57%). Forty percent of patients had an elevated LDH. There were a higher proportion of treatment naïve patients in the combination arm, 84%, compared to 25% in the single agent cohort. The most common sites of metastatic disease in both groups were lymph nodes (71%), skin/soft tissue (53%), and lung (51%). Fifty-two percent of patients had 4–10 metastases, and 49% of patients had the largest metastasis measure 2–5cm. Response rate (partial response (PR) + complete response (CR)) was 63% for the combination arm and 37% for single agent anti-PD-1.
Table 1.
Patient and disease characteristics
| Ipilimumab + nivolumab n=57 (%) | Anti-PD-1 alone n=303 (%) | Total n=360 (%) | |
|---|---|---|---|
| Age in years, median (range) | 60 (33–89) | 64 (22–93) | 63 (22–93) |
| Sex | |||
| Male | 37 (65) | 187 (62) | 224 (62) |
| Female | 20 (35) | 116 (38) | 136 (38) |
| ECOG performance status, median (range) | 1 (0–2) | 1 (0–3) | 1 (0–3) |
| Prior systemic treatment | |||
| Yes | 9 (16) | 226 (75) | 235 (65) |
| No | 48 (84) | 77 (25) | 125 (35) |
| Site of metastases | |||
| Brain | 10 (18) | 51 (17) | 61 (17) |
| Liver | 13 (23) | 96 (32) | 109 (30) |
| Lung | 23 (40) | 162 (53) | 185 (51) |
| Bone | 12 (21) | 54 (18) | 66 (18) |
| Skin/soft tissue | 24 (42) | 166 (55) | 190 (53) |
| Lymph node | 35 (61) | 219 (72) | 254 (71) |
| Other visceral | 12 (21) | 102 (34) | 114 (32) |
| Number of metastases | |||
| 1–3 | 15 (26) | 56 (18) | 71 (20) |
| 4–10 | 25 (44) | 163 (54) | 188 (52) |
| ≥11 | 17 (30) | 84 (28) | 101 (28) |
| Largest tumor diameter | |||
| <2cm | 11 (19) | 55 (18) | 66 (18) |
| 2–5cm | 29 (51) | 147 (49) | 176 (49) |
| 5–8cm | 10 (18) | 62 (20) | 72 (20) |
| >8cm | 7 (12) | 39 (13) | 46 (13) |
| AJCC stage | |||
| IIIC | 0 (0) | 2 (<1) | 2 (<1) |
| M1a | 16 (28) | 56 (18) | 72 (20) |
| M1b | 10 (18) | 70 (23) | 80 (22) |
| M1c | 31 (54) | 175 (58) | 206 (57) |
| LDH | |||
| ≤ULN | 30 (53) | 177 (58) | 207 (58) |
| >ULN | 26 (47) | 119 (39) | 145 (40) |
| Missing | 1 (<1) | 7 (2) | 8 (2) |
| Response rate (partial + complete) | 63% | 37% | 42% |
| Prior treatment | 44% | 36% | 37% |
| No prior treatment | 67% | 42% | 51% |
ECOG, Eastern Cooperative Oncology Group; AJCC, American Joint Committee for Cancer; LDH, lactate dehydrogenase; ULN, upper limit of normal
Univariable analyses
Among patients treated with anti-PD-1 alone, there were statistically significant differences between response and non-response by site of disease (Table 2). Patients with liver metastases were less likely to respond to anti-PD-1 therapy (25% vs 43%, p=0.002) and also had lower PFS and OS than patients without liver metastases (Figure 1). Similarly, patients with skin/soft tissue metastases had lower response rates (32% vs 44%, p=0.03) but no difference in PFS or OS compared to those without skin/soft tissue metastases. There were no differences in response for patients with brain, lung, bone, lymph node, or other visceral metastases compared to those lacking these metastatic sites (Table 2). Patients who failed to respond had a significantly higher number of metastases (median 5 vs 7, p=0.02). Specifically, patients who had >10 metastases had a 27% RR to treatment compared to 39% in those with ≤ 10 metastases, p=0.027. Importantly, the largest tumor diameter was also substantially different between responders and non-responders. In patients with the largest tumor <2cm, RR was 53% versus 38% in tumors ≥ 2cm, p=0.009. PFS and OS were also significantly negatively affected by increased tumor bulk and increased number of metastases (Figure 1). There were no differences in response based upon stage of melanoma or serum LDH in our cohort.
Table 2.
Response by variable of interest for patients treated with anti-PD-1
| Variable | Total N | Response N, % | No response N, % | P value |
|---|---|---|---|---|
| Age | ||||
| ≤ 60 years | 128 | 48 (38) | 80 (62) | |
| >60 years | 175 | 65 (37) | 110 (63) | |
| Sex | ||||
| Male | 187 | 82 (44) | 105 (56) | |
| Female | 116 | 31 (27) | 85 (73) | |
| Site of metastases | ||||
| Brain | 51 | 18 (35) | 33 (65) | 0.75 |
| Liver | 96 | 24 (25) | 72 (75) | 0.002* |
| Lung | 162 | 62 (38) | 100 (62) | 0.71 |
| Bone | 54 | 19 (35) | 35 (65) | 0.72 |
| Skin/soft tissue | 167 | 54 (32) | 113 (68) | 0.03* |
| Lymph node | 219 | 75 (34) | 144 (66) | 0.08 |
| Other visceral | 102 | 32 (31) | 70 (69) | 0.11 |
| Number of metastases | ||||
| 1–3 | 56 | 28 (50) | 28 (50) | 0.02* |
| 4–10 | 163 | 62 (38) | 101 (62) | |
| ≥11 | 84 | 23 (27) | 61 (73) | |
| Largest tumor diameter | ||||
| <2cm | 55 | 29 (53) | 26 (47) | 0.003* |
| 2–5cm | 147 | 55 (37) | 92 (63) | |
| 5–8cm | 62 | 23 (37) | 39 (63) | |
| >8cm | 39 | 6 (15) | 33 (85) | |
| AJCC stage | ||||
| IIIc/M1a | 58 | 24 (41) | 34 (59) | 0.12 |
| M1b | 70 | 32 (46) | 38 (54) | |
| M1c | 175 | 57 (33) | 118 (67) | |
| LDH | ||||
| ≤ULN | 177 | 72 (41) | 105 (59) | 0.10 |
| >ULN | 119 | 38 (32) | 81 (68) | |
AJCC, American Joint Committee for Cancer; LDH, lactate dehydrogenase; ULN, upper limit of normal
Statistically significant value
Figure 1. PFS and OS in patients treated with anti-PD-1 alone.

Kaplan-Meier PFS and OS curves in patients treated with anti-PD-1. A/B: PFS by largest tumor (cm)/OS by largest tumor (cm); Red- <2cm; Blue- 2–5cm; Green- 5.01–8cm; Black- >8cm. C/D: PFS by number of metastases/OS by number of metastases; Red- 1–3; Blue- 4–10; Green- >10. E/F:PFS by liver metastases/OS by liver metastases; Red- liver mets; Blue- No liver mets.
In the combination treatment cohort, there was no statistically significant difference between the site of metastases, size of largest tumor, number of metastases, melanoma stage, or serum LDH and response to immunotherapy (Table 3). There was no difference in PFS based upon tumor bulk, number of metastases, or site of metastases. Similarly, there was no difference in OS for tumor bulk or number of metastases. However, there was marginally decreased OS for patients with liver metastases, median 10.7 months vs 11.7 months, p=0.05 (Figure 2).
Table 3.
Response by variable of interest for patients treated with ipilimumab + nivolumab
| Variable | Total N | Response N, % | No response N, % | P value |
|---|---|---|---|---|
| Age | ||||
| ≤ 60 years | 30 | 18 (60) | 12 (40) | |
| >60 years | 27 | 18 (67) | 9 (33) | |
| Sex | ||||
| Male | 37 | 25 (68) | 12 (32) | |
| Female | 20 | 11 (55) | 9 (45) | |
| Site of metastases | * | |||
| Brain | 10 | 6 (60) | 4 (40) | 0.84 |
| Liver | 13 | 8 (62) | 5 (38) | 0.89 |
| Lung | 23 | 15 (65) | 8 (35) | 0.79 |
| Bone | 12 | 10 (83) | 2 (17) | 0.10 |
| Skin/soft tissue | 24 | 16 (67) | 8 (33) | 0.64 |
| Lymph node | 35 | 25 (71) | 10 (29) | 0.10 |
| Other visceral | 12 | 9 (74) | 3 (25) | 0.34 |
| Number of metastases | ||||
| 1–3 | 15 | 6 (40) | 9 (60) | 0.07 |
| 4–10 | 25 | 19 (76) | 6 (24) | |
| ≥11 | 17 | 11 (65) | 6 (35) | |
| Largest tumor diameter | ||||
| <2cm | 11 | 6 (55) | 5 (45) | 0.56 |
| 2–5cm | 29 | 17 (59) | 12 (41) | |
| 5–8cm | 10 | 8 (80) | 2 (20) | |
| >8cm | 7 | 5 (71) | 2 (29) | |
| AJCC stage | ||||
| IIIc/M1a | 16 | 9 (56) | 7 (44) | 0.39 |
| M1b | 10 | 5 (50) | 5 (50) | |
| M1c | 31 | 22 (71) | 9 (29) | |
| LDH | ||||
| ≤ULN | 30 | 20 (67) | 10 (33) | 0.48 |
| >ULN | 26 | 15 (58) | 11 (42) | |
AJCC, American Joint Committee for Cancer; LDH, lactate dehydrogenase; ULN, upper limit of normal
Figure 2. PFS and OS in patients treated with ipi/nivo.

Kaplan-Meier PFS and OS curves in patients treated with ipi/nivo. A/B: PFS by largest tumor (cm)/OS by largest tumor (cm); Red- <2cm; Blue- 2–5cm; Green- 5.01–8cm; Black- >8cm. C/D: PFS by number of metastases/OS by number of metastases; Red- 1–3; Blue- 4–10; Green- >10. E/F:PFS by liver metastases/OS by liver metastases; Red- liver mets; Blue- No liver mets.
Multivariable analyses
To control for competing variables, we performed multivariable analyses integrating age, sex, stage, LDH, tumor bulk, site of metastases, and number of metastases. Among patients treated with single agent anti-PD-1, increasing tumor bulk was strongly and independently associated with inferior OS (HR =1.1, 95% CI: 1.08–1.13. p<0.0001), PFS (HR=1.08, 95% CI: 1.06–1.1. p=0.0005), and RR (HR=0.89, 95% CI: 0.85–0.93. p=0.015). There were no significant associations between OS, PFS, and RR and any of the other clinical factors which were significant in univariable analysis including number of metastases, site of metastases, LDH, stage of melanoma, or prior treatment.
By contrast, among patients receiving combination treatment, no factors were significantly associated with OS, including tumor bulk. The number of metastases was associated with inferior PFS: when comparing to patients with < 2 metastases, the hazard ratio (HR) was 0.3 (95% CI: 0.15–0.61) for patients with >10 metastases, 0.18 (95% CI: 0.09–0.37) for patients with 4–10 metastases, and 0.34 (95% CI: 0.16–0.72) for patients 2–3 metastases, respectively. The number of metastases was also associated with RR: when comparing to patients with < 2 metastases, the HR was 8.85 (95% CI: 2.6–30.2) for patients with >10 metastases, 16.83 (95% CI: 4.9–57.86) for patients with 4–10 metastases, and 4.73 (95% CI: 1.3–17.19) for patients with 2–3 metastases, respectively. RR was also associated with prior treatment (HR=0.18, 95% CI: 0.07–0.45).
T cell analysis
We sought to determine whether bulky tumors mediated resistance by T cell exclusion or differential immune checkpoint expression. We analyzed 18 tumors from 12 patients; the majority of tumors (56%) were obtained prior to treatment for metastatic disease. Globally, there was no significant difference between large (>4cm; average 9.9cm) and small tumors (≤4cm; average 1.2cm) in terms of PD-L1, CD8, or CD4 expression. We also sought to evaluate whether T cells might be excluded from the center of the tumor preferentially in large tumors. We did not observe significant differences in central vs. peripheral T cell infiltration in small vs. large tumors. When aggregating all tumors (both small and large), we observed slightly less PD-L1 expression in the center of tumors (p=0.02), although equivalent T cell infiltration (Figure 3).
Figure 3. T cell analysis by immunohistochemistry .
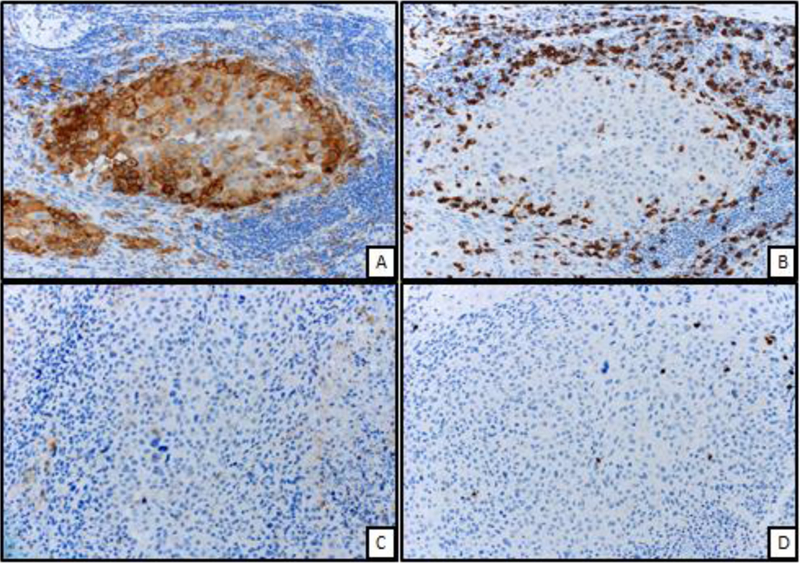
Figure A: Peripheral aspect of melanoma displaying strong and diffuse membranous expression of PD-L1 immunohistochemical stain (200X, PD-L1 IHC)
Figure B: From same area of figure “A”, marked infiltration by CD8 positive T cells surrounding the melanoma cells (200X, CD8 IHC)
Figure C: Central aspect of melanoma displaying markedly low expression of PD-L1 (200X, PD-L1 IHC)
Figure D: From same area of figure “C”, low number of CD8 positive T cell infiltrate (200X, CD8 IHC)
Discussion
In this retrospective analysis of melanoma patients treated with immunotherapy at two large academic centers, we evaluated clinical characteristics associated with treatment outcomes. In our multivariate analyses, we found that increased tumor bulk, defined as the size of the largest metastasis, was associated with worse clinical outcomes in patients treated with anti-PD-1 alone. Other factors such as age, sex, ECOG PS, LDH, prior treatment, site of metastases, size of metastases, and number of metastases, had lesser or no association with response once controlled for tumor bulk.
Our study is one of the first to evaluate the size of the largest tumor on response to immunotherapy and to integrate other clinical factors. Notably, other published negative prognostic features such as liver metastases, high LDH, and poor performance status were not significantly associated with outcome when controlling for size of the largest tumor, suggesting that this metric may supersede other clinical variables. We sought to determine mechanisms for this observation by assessing whether large tumors exclude T cells or have differential immune checkpoint expression. In our study, we did not note any significant findings in patterns of T cell infiltration in large vs. small tumors. We thus hypothesize that impairments in T cell function (mediated by hypoxia or metabolic factors) in large tumors overwhelms effective T cell responses and may explain this finding15, 16. In future studies, prospective analysis of biopsies from metastatic sites could provide insight into differences in T cell populations and function as well as and on-treatment changes.
The association with tumor bulk and response to therapy has been suggested previously. In particular, the investigators of the phase Ib of pembrolizumab in melanoma (KEYNOTE-001) performed a subset analysis of baseline tumor as a prognostic factor. This metric was chosen somewhat subjectively by treating investigators but showed that patients with tumor burden less than the median of 102mm had an increased RR (42.8%, 37–48.7) compared to those with tumor burdens above the median (24.1%, 19.2–29.4).17 Additionally, they also found that baseline tumor size was the strongest independent prognostic factor for OS. Patients with baseline tumor size below the median had worse OS (HR, 0.61, p< 0.001).18 Finally, two studies evaluated the impact of size of individual metastases on response. In thirty-seven patients with 567 metastases treated with pembrolizumab, the lesions with a CR had a mean area of 568.8mm2 versus 806.7mm2 in patients who had PR, stable or progressing disease.19 Similarly, a study of twenty seven patients with 399 metastases showed lesions with CR were three times smaller than non-CR lesions with mean product of diameters, 223mm2 and 760mm2, respectively, P<0.001.20 Collectively, these studies support our finding that increased tumor bulk has a negative effect on clinical outcomes. Our study provides an arguably simpler way to measure tumor bulk (diameter of largest tumor) compared with other studies (sum of RECIST-defined target lesions or total volumetric analyses). Furthermore, the diameter of the largest tumor has a disproportionate effect on the total tumor volume (for example, the tumor volume of a 4cm spherical tumor is >15 fold greater than four distinct 1 cm tumors {33.5cm3 vs. 2.1cm3} despite having the same RECIST defined tumor burden).
In univariate analyses, sites of metastases were correlated with clinical outcomes. Patients with liver metastases had poor RR and shorter PFS in monotherapy treated patients. However, liver metastases did not significantly affect outcomes on multivariate analyses, suggesting that bulky liver metastases could potentially explain this relationship. Notably, prior studies have corroborated this finding. A recent study in melanoma and non-small cell lung cancer evaluated both the effect on site on outcomes and T cell infiltration. In melanoma patients treated with pembrolizumab, RR and PFS were 30.6% and 5.1 months, respectively, in patients with liver metastases and 56.3% and 20.1 months, respectively, in those without liver metastases (p<0.0001).13 Further, CD8+ T cell infiltration appeared lower in liver metastases as well. We did not observe a correlation with lung metastases and outcome. Prior studies have shown that patients with lung-only metastases have superior clinical outcomes, although we did not assess this in our study.19, 20
Limitations to our study include the retrospective nature and inclusion of only two centers, although our population appears to be similar to previously published studies. The response rates of our melanoma patients to both single agent anti-PD-1 (37%) and combination ipilimumab + nivolumab (63%) are in line with prior studies, as are baseline demographics. 3, 14, 17, 21 Also, we used number of metastases and size of largest metastasis as a surrogate for overall tumor burden. Other studies have used a total RECIST 1.1 tumor burden as a surrogate. Both measurements may have flaws; our metric only assesses the largest tumor whereas RECIST measurements only include target lesions chosen by the investigator and do not specifically capture possible factors mediated by single bulky tumors. Finally, we did not observe a strong effect of LDH and stage on outcomes in this cohort, as has been noted in other studies. Thus, one cannot rule out that this finding was limited to this cohort, and future studies should both confirm the effects of tumor bulk and focus on more comprehensively assessing the volume of melanoma burden prospectively.
Conclusions
Collectively, our study suggests that tumor bulk has an impact on outcomes to anti-PD-1 monotherapy but not combination ipilimumab and nivolumab. This factor could be integrated into other clinical and molecular biomarkers and could help guide treatment decision making between monotherapy and combination. Further studies should elucidate mechanisms of this finding.
Supplementary Material
Acknowledgements
Not applicable.
Funding
This study was supported by NIH/NCI K23 CA204726 (DBJ), the James C. Bradford Jr. Melanoma Fund (DBJ), and the Melanoma Research Foundation (DBJ).
Competing interests
EJD receives research funding from Five Prime, Genentech, Bristol Myers Squibb, and Incyte. DBJ serves on advisory boards for Array Biopharma, Bristol Myers Squibb, Incyte, Merck, Novartis, and Navigate BP, and receives research funding from Bristol Myers Squibb, and Incyte.
Abbreviations
- CTLA-4
cytotoxic T-lymphocyte-associated antigen
- PD-1
programmed death 1
- PD-L1
programmed death ligand 1
- OS
overall survival
- PFS
progression free survival
- RR
response rate
- LDH
lactate dehydrogenase
- AJCC
American Joint Committee on Cancer
- ECOG
Eastern Cooperative Oncology Group
- RECIST
Response Evaluation Criteria in Solid Tumors
- PR
partial response
- CR
complete response
- HR
hazard ratio
- CI
confidence interval
- PS
performance status
Footnotes
Availability of data and material
The datasets used and/or analyzed during the current study are available from the corresponding author upon reasonable request.
Ethics approval and consent to participate
This study was reviewed and approved by the Institutional Review Board at both institutions.
Consent for publication
Not applicable.
References
- 1.Hodi FS, O’Day SJ, McDermott DF, et al. Improved survival with ipilimumab in patients with metastatic melanoma. N Engl J Med 2010;363(8): 711–23. [DOI] [PMC free article] [PubMed] [Google Scholar]
- 2.Larkin J, Hodi FS, Wolchok JD. Combined Nivolumab and Ipilimumab or Monotherapy in Untreated Melanoma. N Engl J Med 2015;373(13): 1270–1. [DOI] [PubMed] [Google Scholar]
- 3.Robert C, Schachter J, Long GV, et al. Pembrolizumab versus Ipilimumab in Advanced Melanoma. N Engl J Med 2015;372(26): 2521–32. [DOI] [PubMed] [Google Scholar]
- 4.Johnson DB, Frampton GM, Rioth MJ, et al. Targeted Next Generation Sequencing Identifies Markers of Response to PD-1 Blockade. Cancer Immunol Res 2016;4(11): 959–67. [DOI] [PMC free article] [PubMed] [Google Scholar]
- 5.Topalian SL, Hodi FS, Brahmer JR, et al. Safety, activity, and immune correlates of anti-PD-1 antibody in cancer. N Engl J Med 2012;366(26): 2443–54. [DOI] [PMC free article] [PubMed] [Google Scholar]
- 6.Johnson DB, Estrada MV, Salgado R, et al. Melanoma-specific MHC-II expression represents a tumour-autonomous phenotype and predicts response to anti-PD-1/PD-L1 therapy. Nat Commun 2016;7: 10582. [DOI] [PMC free article] [PubMed] [Google Scholar]
- 7.Hugo W, Zaretsky JM, Sun L, et al. Genomic and Transcriptomic Features of Response to Anti-PD-1 Therapy in Metastatic Melanoma. Cell 2016;165(1): 35–44. [DOI] [PMC free article] [PubMed] [Google Scholar]
- 8.Ayers M, Lunceford J, Nebozhyn M, et al. IFN-gamma-related mRNA profile predicts clinical response to PD-1 blockade. J Clin Invest 2017;127(8): 2930–40. [DOI] [PMC free article] [PubMed] [Google Scholar]
- 9.Algazi AP, Tsai KK, Shoushtari AN, et al. Clinical outcomes in metastatic uveal melanoma treated with PD-1 and PD-L1 antibodies. Cancer 2016;122(21): 3344–53. [DOI] [PMC free article] [PubMed] [Google Scholar]
- 10.Shoushtari AN, Munhoz RR, Kuk D, et al. The efficacy of anti-PD-1 agents in acral and mucosal melanoma. Cancer 2016;122(21): 3354–62. [DOI] [PMC free article] [PubMed] [Google Scholar]
- 11.Eroglu Z, Zaretsky JM, Hu-Lieskovan S, et al. High response rate to PD-1 blockade in desmoplastic melanomas. Nature 2018;553(7688): 347–50. [DOI] [PMC free article] [PubMed] [Google Scholar]
- 12.Bagley SJ, Kothari S, Aggarwal C, et al. Pretreatment neutrophil-to-lymphocyte ratio as a marker of outcomes in nivolumab-treated patients with advanced non-small-cell lung cancer. Lung Cancer 2017;106: 1–7. [DOI] [PubMed] [Google Scholar]
- 13.Tumeh PC, Hellmann MD, Hamid O, et al. Liver Metastasis and Treatment Outcome with Anti-PD-1 Monoclonal Antibody in Patients with Melanoma and NSCLC. Cancer Immunol Res 2017;5(5): 417–24. [DOI] [PMC free article] [PubMed] [Google Scholar]
- 14.Wolchok JD, Chiarion-Sileni V, Gonzalez R, et al. Overall Survival with Combined Nivolumab and Ipilimumab in Advanced Melanoma. N Engl J Med 2017;377(14): 1345–56. [DOI] [PMC free article] [PubMed] [Google Scholar]
- 15.Huang AC, Postow MA, Orlowski RJ, et al. T-cell invigoration to tumour burden ratio associated with anti-PD-1 response. Nature 2017;545(7652): 60–65. [DOI] [PMC free article] [PubMed] [Google Scholar]
- 16.Eil R, Vodnala SK, Clever D, et al. Ionic immune suppression within the tumour microenvironment limits T cell effector function. Nature 2016;537(7621): 539–43. [DOI] [PMC free article] [PubMed] [Google Scholar]
- 17.Ribas A, Hamid O, Daud A, et al. Association of Pembrolizumab With Tumor Response and Survival Among Patients With Advanced Melanoma. JAMA 2016;315(15): 1600–9. [DOI] [PubMed] [Google Scholar]
- 18.Joseph RW, Elassaiss-Schaap J, Kefford RF, et al. Baseline Tumor Size Is an Independent Prognostic Factor for Overall Survival in Patients With Melanoma Treated With Pembrolizumab. Clin Cancer Res 2018. [DOI] [PMC free article] [PubMed]
- 19.Khoja L, Kibiro M, Metser U, et al. Patterns of response to anti-PD-1 treatment: an exploratory comparison of four radiological response criteria and associations with overall survival in metastatic melanoma patients. Br J Cancer 2016;115(10): 1186–92. [DOI] [PMC free article] [PubMed] [Google Scholar]
- 20.Lee JHJ, Lyle M, Menzies AM, et al. Metastasis-specific patterns of response and progression with anti-PD-1 treatment in metastatic melanoma. Pigment Cell Melanoma Res 2017. [DOI] [PubMed]
- 21.Larkin J, Chiarion-Sileni V, Gonzalez R, et al. Combined Nivolumab and Ipilimumab or Monotherapy in Untreated Melanoma. N Engl J Med 2015;373(1): 23–34. [DOI] [PMC free article] [PubMed] [Google Scholar]
Associated Data
This section collects any data citations, data availability statements, or supplementary materials included in this article.