Abstract
Purpose
SparseCT, an undersampling scheme for compressed sensing (CS) computed tomography (CT), has been proposed to reduce radiation dose by acquiring undersampled projection data from clinical CT scanners (Koesters et al. in, SparseCT: Interrupted‐Beam Acquisition and Sparse Reconstruction for Radiation Dose Reduction; 2017). SparseCT partially blocks the x‐ray beam with a multislit collimator (MSC) to perform a multidimensional undersampling along the view and detector row dimensions. SparseCT undersamples the projection data within each view and moves the MSC along the z‐direction during gantry rotation to change the undersampling pattern. It enables reconstruction of images from undersampled data using CS algorithms. The purpose of this work is to design the spacing and width of the MSC slits and the MSC motion patterns based on beam separation, undersampling efficiency, and image quality. The development and testing of a SparseCT prototype with the designed MSC will be described in a following paper.
Methods
We chose a few initial MSC designs based on the guidance from two metrics: beam separation and undersampling efficiency. Both beam separation and undersampling efficiency were measured from numerically simulated photon distribution with MSC taken into consideration. Beam separation measures the separation between x‐ray beams from consecutive slits, taking into account penumbra effects on both sides of each slit. Undersampling efficiency measures the dose‐weighted similarity between penumbra undersampling and binary undersampling, in other words, the effective contribution of the incident dose to the signal to noise ratio of the projection data. We then compared the initially chosen MSC designs in terms of their reconstruction image quality. SparseCT projections were simulated from fully sampled patient projection data according to the MSC design and motion pattern, reconstructed iteratively using a sparsity‐enforcing penalized weighted least squares cost function with ordered subsets/momentum algorithm, and compared visually and quantitatively.
Results
Simulated photon distributions indicate that the size of the penumbra is dominated by the size of the focal spot. Therefore, a wider MSC slit and a smaller focal spot lead to increased beam separation and undersampling efficiency. For fourfold undersampling with a 1.2 mm focal spot, a minimum MSC slit width of three detector rows (projected to the detector surface) is needed for beam separation; for threefold undersampling, a minimum slit width of four detector rows is needed. Simulations of SparseCT projection and reconstruction indicate that the motion pattern of the MSC does not have a visible impact on image quality. An MSC slit width of three or four detector rows yields similar image quality.
Conclusion
The MSC is the key component of the SparseCT method. Simulations of MSC designs incorporating x‐ray beam penumbra effects showed that for threefold and fourfold dose reductions, an MSC slit width of four detector rows provided reasonable beam separation, undersampling efficiency, and image quality.
Keywords: compressed sensing, CT, multislit collimator (MSC), penumbra, SparseCT, Undersampling
1. Introduction
Although many successfully technologies have been developed over the years to reduce the radiation dose of computed tomography (CT), such as tube current modulation (TCM),1 adaptive collimation,2 and tube potential optimization,3 it is still clinically challenging to achieve routine submillisievert CT scanning.4 Compressed sensing (CS) is a promising technology to further reduce CT dose, which exploits the fact that medical images are inherently compressible or sparse in certain transform domains.5, 6, 7, 8 In contrast to commercial iterative reconstruction algorithms (IR) that reduce CT dose by reducing the tube current,10, 11, 12, 13, 19 CS methods would instead reduce dose by decreasing the amount of projection data via undersampling.7, 8, 14, 15 While conventional reconstructions of undersampled projection data lead to aliasing artifacts, CS reconstructions can iteratively remove these artifacts if they are incoherent with respect to the sparse image representation. Furthermore, because the undersampled projection data can be acquired using routine or even higher tube currents, CS is potentially more robust against photon starvation and electronic noise than commercial IR at high levels of dose reduction.
Previous CS studies using retrospective undersampling have demonstrated order‐of‐magnitude CT dose reduction.7, 8 However, practical questions remain about how such undersampled projection data can be directly acquired on CT scanners. The majority of CS studies have explored reduced‐view undersampling schemes, which pulsed the x ray during the gantry rotation to acquire a reduced number of projections.7, 8, 14, 15, 16 The drawback of this scheme is that current clinical CT systems cannot pulse the x‐ray source on the needed millisecond timeframe, since the thermal inertia of the cathode cannot be overcome quickly enough. For this reason, several previous works have proposed a different undersampling scheme that partially blocks the beam between the x‐ray tube and the patient to undersample along the detector row direction within each view.17, 18, 19, 20, 21, 22, 23, 24 SparseCT is one such undersampling approach. It interrupts the continuous beam with a multislit collimator (MSC) to acquire projection data that are undersampled along the detector row direction.1 Furthermore, SparseCT moves the MSC along the detector row direction as the gantry rotates to change the undersampling pattern for each view and thus increase data incoherence for CS.
Unlike a reduced‐view CS approach, SparseCT can be applied in practice to existing CT systems. However, design decisions must be made regarding the optimal MSC slit pattern and motion path to achieve good image quality. Specifically, the design must take into consideration the penumbra of the undersampled beam, caused by the finite size of the focal spot.25 This paper summarizes the concept of SparseCT and describes MSC design considerations with penumbra effects incorporated. Two performance metrics, beam separation and undersampling efficiency, are used to guide the MSC design, and the final designs are chosen according to the reconstruction image quality. A following paper will present the development of a SparseCT prototype and initial phantom results.
2. Materials and methods
2.A. SparseCT and MSC
Figure 1 illustrates the concept of SparseCT. To undersample the projection data, SparseCT places the MSC close to the source to partially block the beam before it reaches the patient. The MSC is a tungsten plate with slits periodically spaced along the detector column direction, so that the projection data are undersampled along the detector row direction within each view. The MSC moves in the z‐direction as the gantry rotates, so that the irradiated detector rows vary from view to view, which increases the data incoherence of the undersampled data for CS reconstruction.
Figure 1.
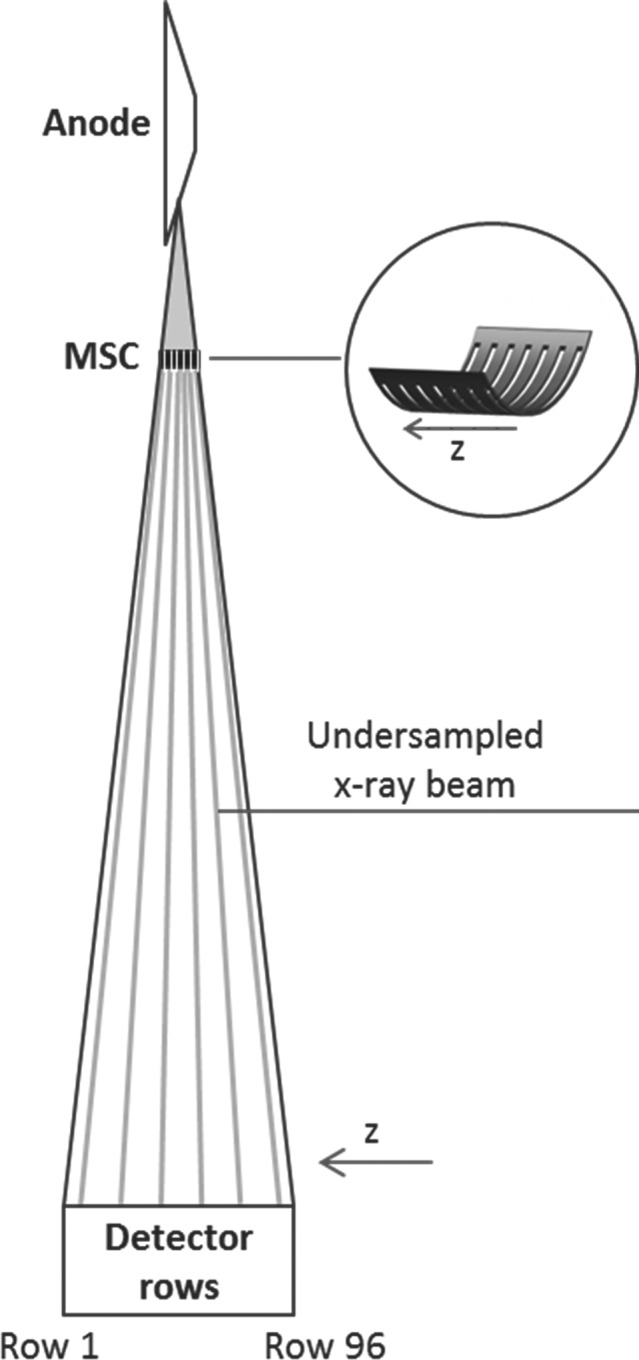
SparseCT is a compressed sensing approach that undersamples along detector row direction within each view. It interrupts the continuous beam with a multislit collimator (MSC) to acquire projection data that are undersampled along the detector row direction. The MSC moves along the detector row direction as the gantry rotates to change the undersampling pattern for each view.
The MSC is critical to the performance of SparseCT. We first selected a few MSC candidate designs under the guidance of two metrics: beam separation and undersampling efficiency. We then evaluated the candidates in terms of their reconstructed image quality to find the optimal MSC design. Beam separation measures the separation between x‐ray beams from consecutive slits, incorporating penumbra effects from both edges of each slit. Undersampling efficiency measures dose‐weighted similarity between penumbra undersampling and binary undersampling, in other words, the effective contribution of the incident dose to the signal to noise ratio (SNR) of the projection data. Beam separation is of concern because the finite size of the focal spot causes a significant penumbra on both sides of the undersampled beam (Fig. 2). If neighboring MSC slits are too close together, the penumbra regions of neighboring undersampled beams will overlap. This is undesired in CS reconstruction, since disentangling overlapping beams introduces significant challenges. Undersampling efficiency is a concern also because of the penumbra. In an ideal MSC design, the dose would be concentrated into narrow regions to minimize penumbra and acquire high SNR projection data. To investigate these two concerns, we simulated the photon distribution on the detector surface for various MSC designs and quantified the beam separation and undersampling efficiency of each design (Section 2.B). To validate the MSC designs in terms of the reconstruction image quality, we simulated SparseCT projections for various MSC slit configurations and motion patterns (Section 2.C) and compared the reconstructed images.
Figure 2.
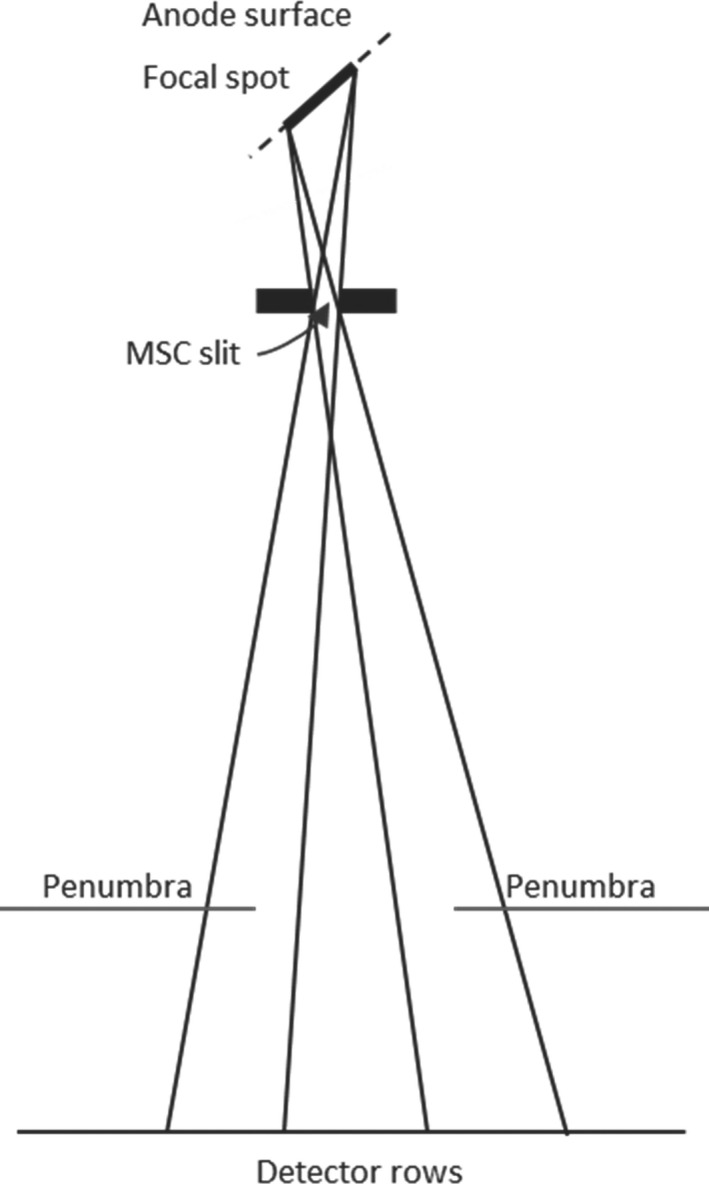
The finite size of the focal spot causes a significant penumbra on both sides of the undersampled beam.
2.B. Impact of MSC on beam separation and undersampling efficiency
We developed a ray‐tracing program to numerically simulate the photon distribution on the detector surface for air scans. The program is customized MATLAB code. It took MSC specifications as input and outputted I0B/I0A, where I0A and I0B are the location‐dependent photon counts on the detector surface without and with the MSC, respectively.
The simulation code modeled the following features: CT gantry geometry (Siemens SOMATOM Flash or Siemens SOMATOM Force), MSC geometry (number, width, and separation of slits), and anode specifications (anode angle and the intensity distribution of the focal spot on the anode surface). The focal spot intensity distribution was empirically measured using a pin‐hole method, similar to the method described by Grimes et al.26 The focal spot was accordingly modeled as a number of point sources, each varied in intensity and location. The ray between a point source and a detector pixel was calculated using the Siddon method.27 If the ray was not blocked by the MSC, its intensity (the intensity of the point source from which it came from) was recorded and accumulated toward I0B. Scattering was not considered, because the narrow undersampled beams are less susceptible to scattering than traditional full‐width beams, and because the modeled detector array has a built‐in antiscatter grid. Partial penetration of the beam through the edge of the MSC slit was also not considered, since it is negligible due to the highly attenuating tungsten material of the MSC.
The simulation program was experimentally validated using the adaptive collimator3 of a Siemens SOMATOM Force scanner. We brought the two existing plates of the adaptive collimator together in close proximity to mimic a single MSC slit, and moved the two pieces together along the detector row direction to mimic multiple slit locations irradiating different detector rows. Air scans were performed at each slit location, with two focal spot sizes, stdHR (large, 1.2 mm) and superHR (small, 0.6 mm). The detector air calibration was performed without the adaptive collimator, so the attenuation of the MSC was captured in the projection data. The change of photon distribution by the MSC was then measured as I0B/I0A = exp (−PB), where I0A and I0B are the photon distributions without and with the MSC respectively, and PB is the postlog projection data with the MSC in place. Lastly, the experimental measurements of I0B/I0A were compared to numerical simulations.
The validated simulation program was used to simulate photon distribution for various MSC designs, defined as in Table 1. All MSC designs have slits spaced periodically along the detector row directions, with the slit width denoted by “W” and the slit separation denoted by “S”. The undersampling factor is the ratio between the slit width and the slit separation. Because photons can only penetrate through the slits, the undersampling factor is also the dose reduction factor. For each MSC design, the distribution of I0B/I0A was simulated and analyzed in terms of beam separation and undersampling efficiency.
Table 1.
Multislit collimator (MSC) designs of different slit widths and slit separations
| MSC design | Undersampling factor | Slit width | Slit separation | ||
|---|---|---|---|---|---|
| At the MSC (mm) | Projected to the detector surface (number of detector rows) | At the MSC (mm) | Projected to the detector surface (number of detector rows) | ||
| W1S4 | 4 | 0.192 | 1 | 0.766 | 4 |
| W2S8 | 4 | 0.383 | 2 | 1.533 | 8 |
| W3S12 | 4 | 0.575 | 3 | 2.299 | 12 |
| W4S16 | 4 | 0.766 | 4 | 3.065 | 16 |
| W3S9 | 3 | 0.575 | 3 | 1.724 | 9 |
| W4S12 | 3 | 0.766 | 4 | 2.299 | 12 |
The undersampling efficiency (UE) was calculated as
where I0A(z) is the photon counts at detector row z without MSC, I0B(z) is the photon counts at detector row z with MSC, Ibin(z) is the photon counts at detector row z in case of binary undersampling, as illustrated in Fig. 3. w(z) is the weighting factor at detector row z without MSC, wMSC(z) is the weighting factor at detector row z with MSC, wbin(z) is the weighting factor at detector row z in case of binary undersampling, and R is the undersampling factor. The weighting factors are inversely proportional to the variance of the postlog projection data (calculated from Poisson statistics) and proportional to the dose at each detector row.28 UE can be understood as dose‐weighted similarity between penumbra undersampling and binary undersampling. In the ideal case of no penumbra (with an infinitely small focal spot), UE is maximized at 1. In the case of a finite focal spot, UE is always <1.
Figure 3.

Three types of photon distributions along detector row direction: no undersampling, penumbra undersampling, and binary undersampling. Penumbra undersampling and binary undersampling have different photon distributions but the same area under the curve. [Color figure can be viewed at wileyonlinelibrary.com]
2.C. Comparison of MSC in terms of image quality
The MSC designs chosen according to beam separation and undersampling efficiency were further evaluated in terms of their reconstruction image quality. SparseCT projection data corresponding to those MSC designs were simulated by realistic undersampling of fully sampled patient projection data, which were collected from Siemens Definition Flash scanners at routine dose levels.29
The undersampling process followed three steps. First, photon distribution on the detector surface I0B/I0A was simulated using the numerical simulation program developed in Section 2.B, assuming a large focal spot. Second, in regions significantly blocked by the MSC (I0B/I0A < 20%), the projection data were not used in the SparseCT reconstruction, because they contributed little information to the reconstruction while increasing the reconstruction time. Finally, in the unmasked regions, the projection data were inserted with added noise to account for the increase in quantum noise due to the decrease in exposure. At a given detector location, the amount of inserted noise was calculated as Ref. 30
where a is the ratio between I0B and I0A at the location, PA is the fully sampled projection data at the location, Ne is the noise equivalent quanta of electronic noise, and x is a normally distributed stochastic variable with zero mean and unit variance.
The undersampling process also incorporated MSC motion during the gantry rotation. Two MSC motion types were simulated, linear and random. For linear motion, the MSC was assumed to move linearly in one direction, with a shift of one detector row per projection (projected to the detector surface). For random motion, the MSC was assumed to shift randomly. The number of detector rows shifted per projection followed a truncated Gaussian distribution, with a mean of one detector row and a standard deviation of two detector rows. Both motion types assumed an ideal actuator capable of translating the MSC instantly from one position to the next between projections, without causing blur in the projection data.
The undersampled projection data were reconstructed iteratively using a sparsity‐enforcing penalized weighted least squares cost function with ordered subsets/momentum algorithm.31 Given the projection data f, we reconstruct the scanned volume u by minimizing
where A is the data acquisition operator and λ is a positive scalar that balances data fidelity and regularization strength. In detail, we regularize the reconstruction by applying a smoothed version of the isotropic total variation, defined as
Here, are the first order differences operators in x,y,z‐directions and ɛ is a smoothing parameter. Note that statistical weights W are applied in the data‐consistency term to account for the varying noise levels in the postlog projection data and they are inversely proportional to the variance of the postlog projection data.32 The inclusion of weighting factors is crucial to SparseCT, because the MSC creates dramatic variation in exposure along the detector row direction, producing strong variations in quantum noise in the acquired projection data. As mentioned before, projection data regions significantly blocked by the MSC (I0B/I0A < 20%) were omitted during the reconstruction. To do so, we masked out these regions using the statistical weights. The reconstructed images of different MSC designs and motions were compared in terms of peak SNR and structural similarity index (SSIM).
3. Results
3.A. Simulation of photon distributions and experimental validations
Figure 4 compares I0B/I0A of the numerically simulated photon distributions to the experimentally measured photon distributions. Each peak corresponds to the simulation/measurement at one slit location. The simulation and experimental results are in overall good agreement, with a root mean square error (RMSE) of 0.017 for stdHR focal spot and an RMSE of 0.026 for superHR. One exception is observed toward the cathode, where the simulation results have slight larger magnitude, possibly because the thickness of the MSC plate (3.5 mm) was not modeled in the simulation.
Figure 4.

The numerically simulated photon distributions (blue curves) and experimentally measured photon distributions (red dots) at multiple multislit collimator (MSC) slit locations using two focal spot sizes (stdHR, large; superHR, small), normalized to the photon distribution without the MSC. Each peak corresponds to the simulation/measurement at one slit location. [Color figure can be viewed at wileyonlinelibrary.com]
Note that in Fig. 4 the flux toward the anode is approximately three times lower than the flux toward the cathode. This variation is caused by the fact that the experimental validation mimicked each MSC slit by bringing two plates of the existing adaptive collimator2 in close proximity, but the two plates are at uneven heights, as shown in Fig. 5. As a result, the flux toward the anode is strongly blocked and reduced. However, the rest of this paper uses simulation only and models an MSC geometry with the two sides of each slit at the same height instead of the staggered geometry of the adaptive collimator, so this flux variation is not observed.
Figure 5.
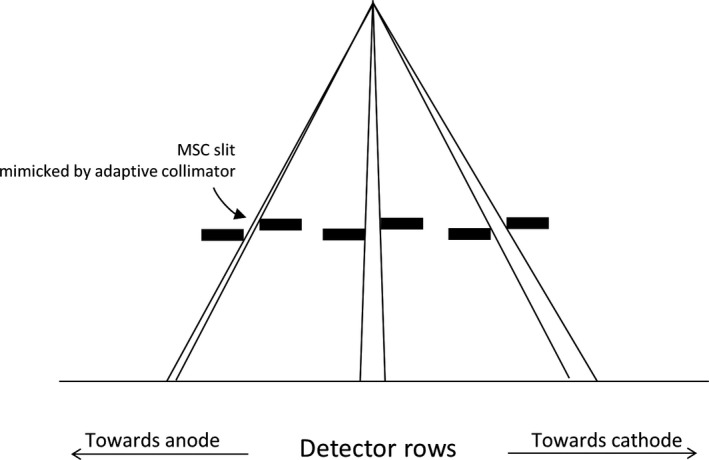
In the experimental validation of the photon distribution, each multislit collimator slit is mimicked by two plates of adaptive collimator in close proximity. Because the two plates are at uneven heights with the plate on cathode side being higher, the flux toward the anode is strongly blocked.
Figure 6 shows the simulated I0B/I0A photon distributions corresponding to the six MSC designs of Table 2 and two focal spot sizes, using the validated simulation program. Several trends are observed. (a) I0B/I0A is mostly <1, meaning that no detector row can “see” the entire focal spot due to the narrow width of the slit. (b) A smaller focal spot size helps reduce the penumbra while increasing the magnitude of I0B/I0A, as evidenced by comparing stdHR to superHR and by comparing the anode side to the cathode side of the detector (the effective focal spot size is smaller toward the anode side). (c) The area under each peak, representing the number of photons contained in each undersampled beam, is proportional to the slit width. (d) The full width half maximum (FWHM) of the undersampled beam does not increase proportionally with the slit width, because the FWHM is dominated by the size of the penumbra, which largely depends on the size of the focal spot. The FWHM increases from anode side to cathode side because the effective focal spot size is larger on the anode side, but the area under the peak remains the same. (e) For a given undersampling factor, wider slits allow better beam separation. In the case of fourfold undersampling with stdHR focal spot, which is the focal spot for most clinical applications, a minimum slit width of three detector rows is needed for beam separation; in the case of threefold undersampling with stdHR focal spot, a minimum slit width of four detector rows is needed. The undersampling efficiency was also calculated for each MSC design and focal spot size, as listed in Table 2. The undersampling efficiency is always smaller than 1 due to the penumbra, but increases with a wider MSC slit and a smaller focal spot.
Figure 6.
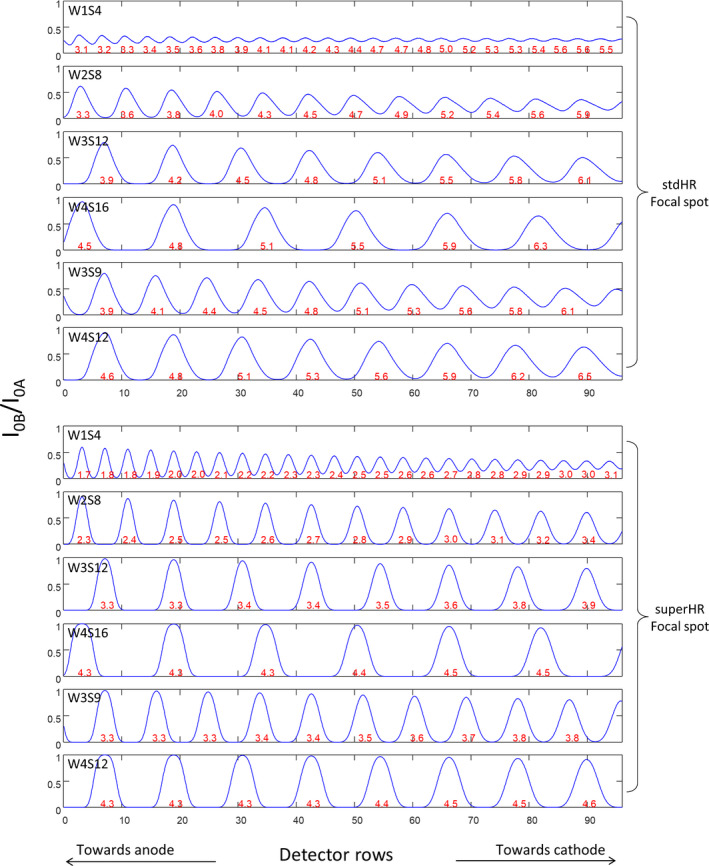
Photon distributions corresponding to six multislit collimator (MSC) designs and two focal spot sizes, normalized to the photon distribution without the MSC. Each peak is an undersampled beam passing through an MSC slit. The numbers in red are the FWHM of each undersampled beam, in units of detector rows. [Color figure can be viewed at wileyonlinelibrary.com]
Table 2.
The undersampling efficiency corresponding to the six multislit collimator designs (MSC) and two focal spot sizes
| Focal spot mode | MSC design | Undersampling efficiency |
|---|---|---|
| stdHR (large) | W1S4 | 0.26 |
| W2S8 | 0.33 | |
| W3S12 | 0.45 | |
| W4S16 | 0.55 | |
| W3S9 | 0.45 | |
| W4S12 | 0.55 | |
| superHR (small) | W1S4 | 0.32 |
| W2S8 | 0.53 | |
| W3S12 | 0.67 | |
| W4S16 | 0.75 | |
| W3S9 | 0.66 | |
| W4S12 | 0.74 |
3.B. Simulation and reconstruction of SparseCT projection data
Based on the results of Section 3.1, three designs were chosen for further investigation, W4S12, W3S12, and W4S16, with dose reduction factors of three, four, and four, respectively. Examples of fully sampled patient projection data and undersampled SparseCT projection data corresponding to W4S16 MSC and large focal spot are shown in Fig. 7. Note that although 3/4 of the x‐ray beam is blocked by the W4S16 MSC, around 1/2 of the detector has signal readout as a result of the penumbra.
Figure 7.
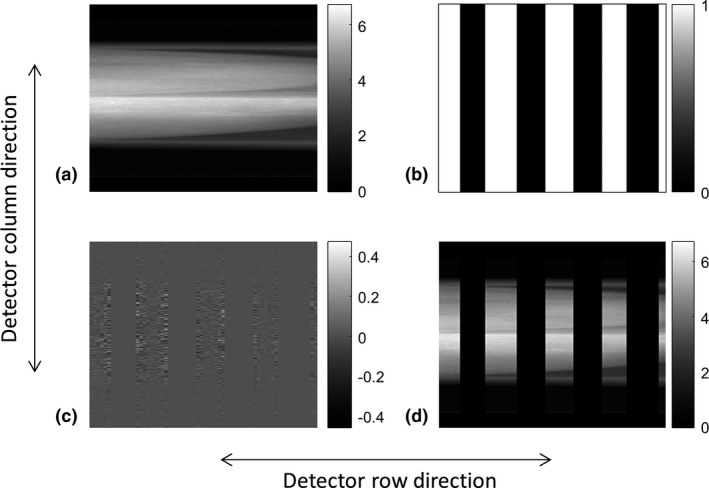
(a) Fully sampled patient projection, (b) regions where I0B/I0A > 0.2 (marked in white) based on a W4S16 multislit collimator and a large focal spot, (c) noise to be inserted, and (d) simulated undersampled SparseCT projection.
Figure 8 shows the images reconstructed from undersampled SparseCT projection data using linear motion pattern. It also shows the images reconstructed from fully sampled projection data as a reference. The PSNR and SSIM values, referencing to the regularized full data reconstruction, are presented in the images. The MSC with threefold dose reduction (W4S12) yields better performance than the MSC with fourfold dose reduction (W3S12 and W4S16), as expected. W3S12 and W4S16 yield similar results, possibly because W3S12 has better data incoherence while W4S16 has better undersampling efficiency.
Figure 8.
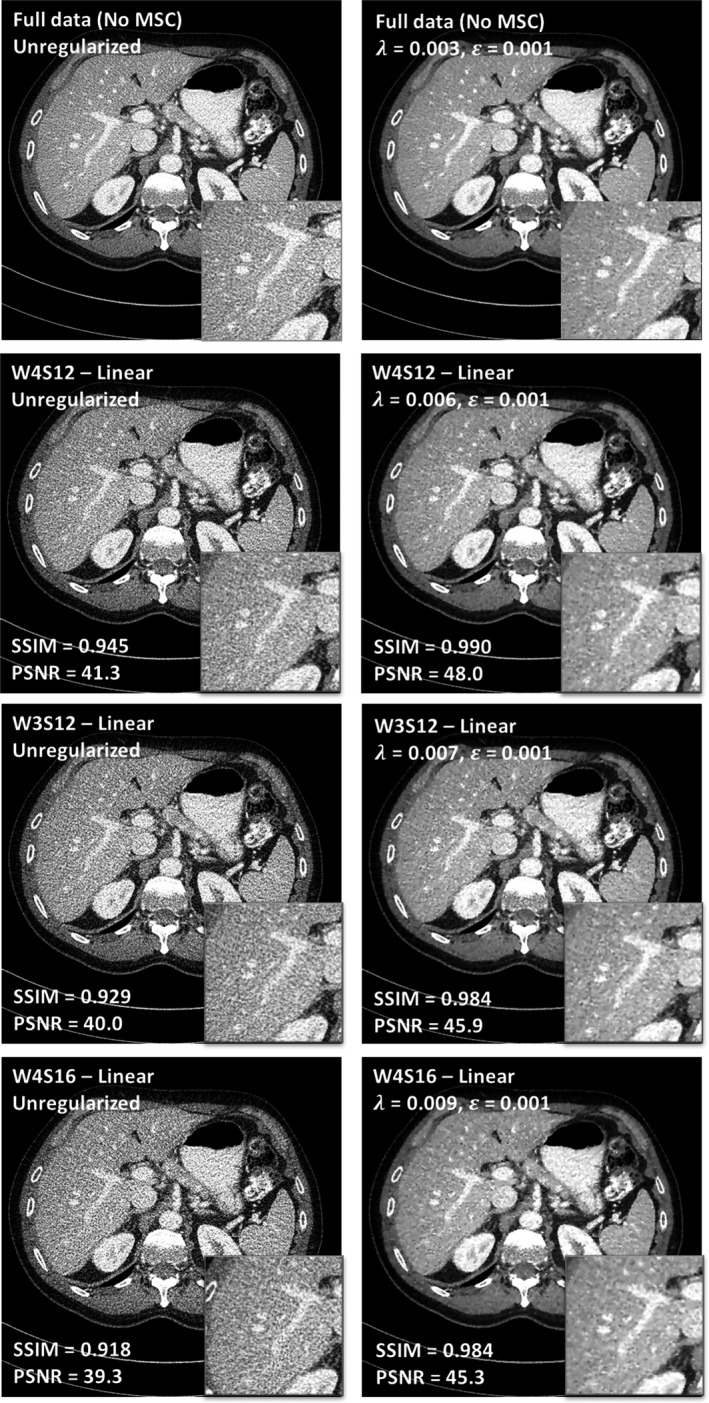
Comparison between different multislit collimator designs (W4S12, threefold dose reduction; W3S12, fourfold dose reduction; and W4S16, fourfold dose reduction) under the assumption of linear motion.
Figure 9 shows the images of the MSC designs using random motion pattern. Compared to Fig. 8, the two motion patterns do not show a visible difference in image quality, potentially because the extent of randomness of the motion patterns investigated in this study is limited (truncated Gaussian distribution with a mean of one detector row and a standard deviation of two detector rows). Based on these observations, W4S12 and W4S16 were chosen as designs to be implemented on a prototype.
Figure 9.
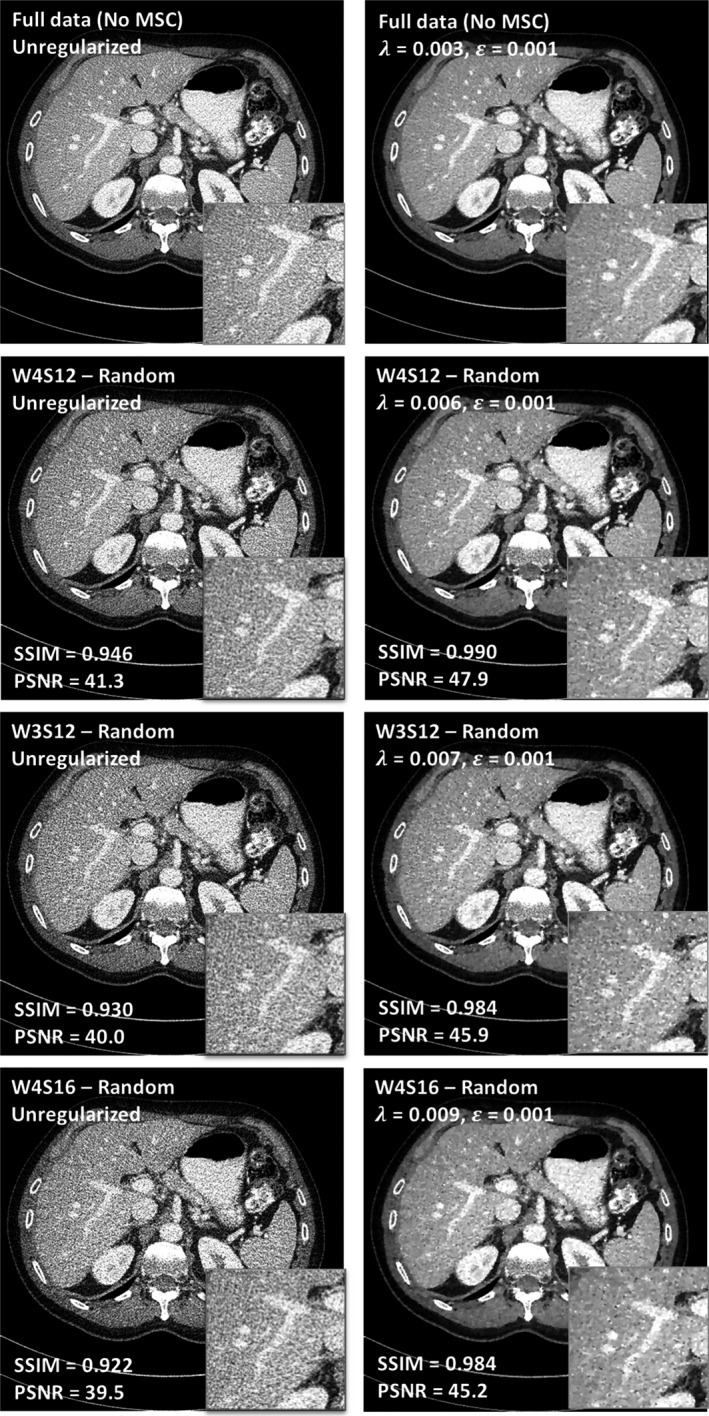
Comparison between different multislit collimator designs (W4S12, threefold dose reduction; W3S12, fourfold dose reduction; and W4S16, fourfold dose reduction) under the assumption of random motion.
4. Discussion
Although CS has been extensively explored for CT imaging, it has not been clinically implemented due to the difficulty in pulsing x‐ray beams. SparseCT is a potential way of implementing CS on clinical CT scanners, which undersamples the continuous beam with an MSC instead of pulsing the x‐ray beam. This study simulated photon distributions and undersampled projection data corresponding to several MSC designs, such that the MSC can be designed and evaluated in terms of beam separation, undersampling efficiency, and image quality.
This study used regular slits for MSC designs, that is, slits of the same width and separation along the detector row direction. Irregular slit widths and spacings could potentially increase data incoherence and improve CS performance. However, it would be difficult to maintain proper beam separation with irregular slits due to the extensive penumbra observed in this study (approximately three detector rows on each side of the undersampled beam using a stdHR focal spot). Another predetermined design choice was to undersample and shift the MSC along the detector row direction only, while the MSC could also undersample and move along the detector column direction. This choice was motivated mainly by the fact that current clinical CT systems already have actuators that drive the adaptive collimator plates along the detector row direction, which could easily be repurposed to drive the MSC for SparseCT. Moreover, moving the MSC along different dimensions while the gantry is rotating at high speed can introduce significant challenges and physical instabilities.
This study optimized the width and separation of the slits and motion patterns of the MSC based on a helical scan that has a pitch of 0.7, which is a typical protocol for adult abdomen CT scans. However, the optimal MSC design may depend on other factors, including the scan mode (axial vs helical), the pitch, and the complexity of the object being scanned. For example, helical scans with a lower pitch might favor a wider slit width; geometric phantom scans might benefit more from a wide slit width than patient scans.
Our results showed that the size of the penumbra is dominated by the size of the focal spot, favoring the use of a small focal spot to reduce the penumbra and improve the performance of SparseCT. However, given limitations of anode heating and electron density of the anode material, the small focal spot has restricted power that precludes its use for most routine CT procedures. Therefore, the selected MSC designs assumed a large focal spot (stdHR). For clinical applications where tube power is not a limitation, such as pediatric patients, the small focal spot size remains a potentially preferred choice. In addition to using a small focal spot, the size of the penumbra can also be reduced by using a thicker MSC or placing the MSC further away from the focal spot. However, a thicker MSC is also heavier, and thus more difficult to accelerate during gantry rotation, and placing the MSC further from the focal spot would reduce the scan field of view.
Similar beam‐interrupting undersampling schemes have been explored by other groups. Dong et al. used a beam blocker to interrupt the beam along the detector column direction.22 Although their study focused on the utility of the blocker for scatter correction, it employed CS reconstruction and achieved dose reduction with the beam blocker as well. Even though the focal spot for their counter‐top CT system is much smaller than ours (0.4 vs 1.2 mm), they chose a relatively wide slit (17 mm on the detector surface) to minimize penumbra effects. Instead of moving the beam blocker during the gantry rotation, they left the beam blocker stationary in the beam, but positioned it asymmetrically with respect to the central longitudinal line of the detector, so that at least one ray from its conjugate ray pair can be measured on the detector. Chen et al.24 also investigated a beam‐interrupting blocker for cone‐beam CT and optimized the blocker design in terms of slit separation and moving speed. Because their study focused on scatter correction rather than dose reduction, they designed a blocker with much lower dose reduction factor (only 25%) than SparseCT (67% for W4S12 and 75% for W4S16) and used a slit much wider (60 detector rows) than SparseCT (only four detector rows). They also found that blocker geometry has stronger impact on reconstruction results than blocker moving speed, which is consistent with our findings. Lee et al.21 used a moving beam blocker along the detector column direction for CT dose reduction, and also pointed out the penumbra effect as a main caveat. Because their reconstruction algorithm does not use the projection data in the penumbra region, the penalty of the penumbra is even higher. As a result, their optimal slit width is larger than ours (2.7 vs 0.7 mm). In addition, their optimal slit width was determined based on a piece‐wise constant phantom instead of patient images, which might be another reason why a larger slit width is desired.
As shown in Fig. 6, due to the fact that effective focal spot size is smaller on the anode side than cathode side, the FWHM of the undersampled beam increases from anode to cathode side while the peak height of the undersampled beam decreases from anode to cathode side. We used statistical weights in our reconstruction to model this variation of FWHM and peak height. The statistical weights were proportional to the photon flux after the MSC and the patient, therefore reflecting the FWHM and flux difference at different detector rows.
We expect MSC and TCM to be complimentary techniques, because MSC does not physically interfere with the x‐ray tube during the acquisition. Furthermore, both MSC and TCM are essential parts of SparseCT: MSC modulates the beam spatially along the detector row to provide undersampled beam, while TCM modulates the beam temporally across projections to account for path length difference.
This paper designed the MSC and its motion patterns based on simulations. Although the simulations modeled the penumbra effect, it was still simplified in some aspects. For example, our simulations did not model the detector's reaction to the highly dynamic undersampled beam. To acquire real‐world data, a SparseCT prototype has been manufactured with W4S12 and W4S16 MSC installed. A following paper will present the development and testing of this prototype. A picture of the prototype is shown in Fig. 10.
Figure 10.
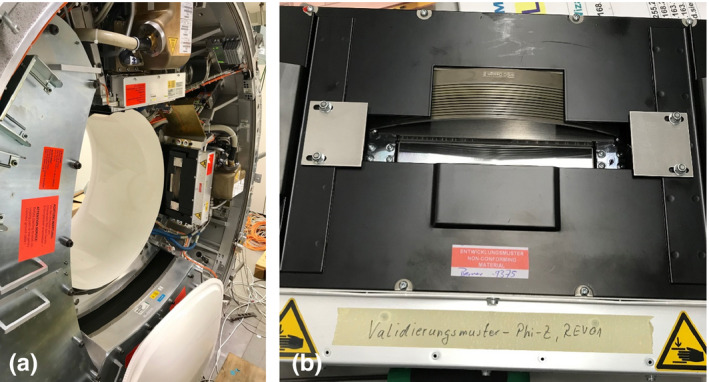
(a) The prototype of SparseCT with multislit collimator (MSC) installed and (b) a zoomed view of W4S16 MSC. [Color figure can be viewed at wileyonlinelibrary.com]
5. Conclusion
SparseCT presents a practical scheme for CS CT, which collects undersampled data within each projection by partially blocking the x‐ray beam along the detector row dimension with a MSC. This work describes the design process of the MSC on the basis of the resultant beam separation, undersampling efficiency and image quality.
Conflict of interest
The authors have no conflicts to disclose.
Acknowledgment
This work was funded by NIBIB (U01 EB018760). We would like to thank Dr. David Faul for many inspiring discussions. We would also like to thank Dr. Cynthia McCollough for providing the standardized patient dataset, which was collected under the grant U01 EB017185.
References
- 1. Kalender WA, Wolf H, Suess C. Dose reduction in CT by anatomically adapted tube current modulation. II. Phantom measurements. Med Phys. 1999;26:2248–2253. [DOI] [PubMed] [Google Scholar]
- 2. Christner JA, Zavaletta VA, Eusemann CD, Walz‐Flannigan AI, McCollough CH. Dose reduction in helical CT: dynamically adjustable z‐axis X‐ray beam collimation. Am J Roentgenol. 2010;194:W49–W55. [DOI] [PubMed] [Google Scholar]
- 3. Yu L, Bruesewitz MR, Thomas KB, Fletcher JG, Kofler JM, McCollough CH. Optimal tube potential for radiation dose reduction in pediatric CT: principles, clinical implementations, and pitfalls. Radiographics. 2011;31:835–848. [DOI] [PubMed] [Google Scholar]
- 4. McCollough CH, Chen GH, Kalender W, et al. Achieving routine submillisievert CT scanning: report from the summit on management of radiation dose in CT. Radiology. 2012;264:567–580. [DOI] [PMC free article] [PubMed] [Google Scholar]
- 5. Donoho DL. Compressed sensing. IEEE Trans Inform Theory. 2006;52:1289–1306. [Google Scholar]
- 6. Candes EJ, Romberg JK, Tao T. Stable signal recovery from incomplete and inaccurate measurements. Commun Pure Appl Math. 2006;59:1207–1223. [Google Scholar]
- 7. Sidky EY, Kao C‐M, Pan X. Accurate image reconstruction from few‐views and limited‐angle data in divergent‐beam CT. J X‐ray Sci Technol. 2006;14:119–139. [Google Scholar]
- 8. Chen GH, Tang J, Leng S. Prior image constrained compressed sensing (PICCS): a method to accurately reconstruct dynamic CT images from highly undersampled projection data sets. Med Phys. 2008;35:660–663. [DOI] [PMC free article] [PubMed] [Google Scholar]
- 9. Hsieh J. Adaptive statistical iterative reconstruction. White paper, GE Healthcare; 2008.
- 10. Ramirez‐Giraldo JC, Grant KL, Raupach R. ADMIRE: Advanced Modeled Iterative Reconstruction. White paper, Siemens Healthcare.
- 11. Grant K, Raupach R. SAFIRE: Sinogram affirmed iterative reconstruction. White paper, Siemens Healthcare.
- 12. Thibault J. Veo CT model‐based iterative reconstruction. White paper, GE Healthcare; 2010.
- 13. Scibelli A. iDose iterative reconstruction technique. White Paper, Philips Healthcare; 2011.
- 14. Sidky EY, Pan X. Image reconstruction in circular cone‐beam computed tomography by constrained, total‐variation minimization. Phys Med Biol. 2008;53:4777. [DOI] [PMC free article] [PubMed] [Google Scholar]
- 15. Tang J, Nett BE, Chen G‐H. Performance comparison between total variation (TV)‐based compressed sensing and statistical iterative reconstruction algorithms. Phys Med Biol. 2009;54:5781. [DOI] [PMC free article] [PubMed] [Google Scholar]
- 16. Choi K, Wang J, Zhu L, Suh TS, Boyd S, Xing L. Compressed sensing based cone‐beam computed tomography reconstruction with a first‐order method. Med Phys. 2010;37:5113–5125. [DOI] [PMC free article] [PubMed] [Google Scholar]
- 17. Abbas S, Lee T, Shin S, Lee R, Cho S. Effects of sparse sampling schemes on image quality in low‐dose CT. Med Phys. 2013;40:111915. [DOI] [PubMed] [Google Scholar]
- 18. Koesters T, Knoll F, Sodickson A, Sodickson D, Otazo R. SparseCT: Interrupted‐Beam Acquisition and Sparse Reconstruction for Radiation Dose Reduction. Orlando, FL: SPIE Medical Imaging; 2017. [Google Scholar]
- 19. Cho S, Lee T, Min J, Chung H. Feasibility study on many‐view under‐sampling technique for low‐dose computed tomography. Opt Eng. 2012;51:080501. [Google Scholar]
- 20. Lee H, Min J, Lee T, et al. Investigation on beam‐blocker‐based scatter correction method for improving CT number accuracy. IEEE Trans Nucl Sci. 2017;64:908–914. [Google Scholar]
- 21. Lee T, Lee C, Baek J, Cho S. Moving beam‐blocker‐based low‐dose cone‐beam CT. IEEE Trans Nucl Sci. 2016;63:2540–2549. [Google Scholar]
- 22. Dong X, Jia X, Niu T, Zhu L. Low‐dose and scatter‐free cone‐beam CT imaging: a preliminary study. Paper presented at: Medical Imaging 2012: Physics of Medical Imaging; 2012.
- 23. Dong X, Petrongolo M, Niu T, Zhu L. Low‐dose and scatter‐free cone‐beam CT imaging using a stationary beam blocker in a single scan: phantom studies. Comput Math Methods Med. 2013;2013:637614. [DOI] [PMC free article] [PubMed] [Google Scholar]
- 24. Chen X, Ouyang L, Yan H, et al. Optimization of the geometry and speed of a moving blocker system for cone‐beam computed tomography scatter correction. Med Phys. 2017;44:e215–e229. [DOI] [PMC free article] [PubMed] [Google Scholar]
- 25. Chen B, Muckley M, O'Donnell T, et al. Realistic Undersampling Model for Compressed Sensing Using a Multi‐Slit Collimator. Fully3D; 2017; Xi'an, China.
- 26. Grimes J, Duan X, Yu L, et al. The influence of focal spot blooming on high‐contrast spatial resolution in CT imaging. Med Phys. 2015;42:6011–6020. [DOI] [PubMed] [Google Scholar]
- 27. Siddon RL. Fast calculation of the exact radiological path for a three‐dimensional CT array. Med Phys. 1985;12:252–255. [DOI] [PubMed] [Google Scholar]
- 28. Zeng GL, Wang W. On Approximation of Compound Poisson by Poisson. The 4th International Conference on Image Formation in X‐Ray Computed Tomography; 2016.
- 29. Chen B, Leng S, Yu L, Holmes D 3rd, Fletcher J, McCollough C. An open library of CT patient projection data. Proc SPIE Int Soc Opt Eng. 2016;9783. [DOI] [PMC free article] [PubMed] [Google Scholar]
- 30. Yu L, Shiung M, Jondal D, McCollough CH. Development and validation of a practical lower‐dose‐simulation tool for optimizing computed tomography scan protocols. J Comput Assist Tomogr. 2012;36:477–487. [DOI] [PubMed] [Google Scholar]
- 31. Kim D, Ramani S, Fessler JA. Combining ordered subsets and momentum for accelerated x‐ray CT image reconstruction. IEEE Trans Med Imaging. 2015;34:167–178. [DOI] [PMC free article] [PubMed] [Google Scholar]
- 32. Thibault JB, Sauer KD, Bouman CA, Hsieh J. A three‐dimensional statistical approach to improved image quality for multislice helical CT. Med Phys. 2007;34:4526–4544. [DOI] [PubMed] [Google Scholar]


