

Abstract
We studied 78 participants having a parental or multiple‐sibling history of Alzheimer’s disease (AD) in a two‐year randomized placebo‐controlled trial of naproxen 220 mg b.i.d. for mitigation of early AD pathogenesis. Naproxen was detected in cerebrospinal fluid at concentrations ~100 times lower than in plasma, but produced negligible change in immune markers. The repeated lack of benefit in AD prevention trials using naproxen and related drugs may reflect limited CNS permeability, lack of expected drug effects, or both. These findings suggest reconsideration of implications from results of AD prevention trials using anti‐inflammatory drugs.
Introduction
Alzheimer's disease (AD) amyloid‐β and tau deposits are accompanied by microglial activation and other signs of innate immune activation (inflammation). Early clinical observations,1 and subsequent pharmaco‐epidemiological data,2 suggested that nonsteroidal anti‐inflammatory drugs (NSAIDs) prevent subsequent development of AD symptoms. Clinical trials failed to confirm this effect, however,3, 4, 5 and we know of no human studies regarding NSAID effects on CNS immune activity. Among participants in a recently completed 2‐year trial of oral naproxen sodium 220 mg b.i.d. for mitigation of presymptomatic AD biomarker progression,6 we therefore explored CNS permeability of naproxen and the corresponding change in immune markers.
Methods
Participants
INTREPAD, a recently completed 2‐year placebo‐controlled trial of naproxen 220 mg b.i.d. for AD prevention,6 enrolled 101 cognitively unimpaired (CU) serial CSF donors with a parental or multiple‐sibling history of “sporadic” AD.7 These were 55 or more years of age (most aged 60+). Two or more lumbar punctures were available from 78, the first at baseline in all but two instances (Table 1). Each participant and study partner provided written informed consent. All procedures were approved by the McGill University Faculty of Medicine Institutional Review Board. All research complied with ethical principles of the Declaration of Helsinki.
Table 1.
Sample characteristics
| Baseline | 3 Months | 12 Months | 24 Months | |||||||||||||
|---|---|---|---|---|---|---|---|---|---|---|---|---|---|---|---|---|
| All | Placebo | Nap. | P | All | Placebo | Nap. | P | All | Placebo | Nap. | P | All | Placebo | Nap. | P | |
| N | 761 | 33 | 43 | 73 | 29 | 44 | 72 | 32 | 30 | 66 | 30 | 36 | ||||
| Age (years) | 62.70 (5.53) | 61.90 (5.35) | 63.31 (5.66) | 0.27 | 63.01 (5.35) | 61.84 (4.59) | 63.80 (5.71) | 0.11 | 63.62 (4.85) | 62.88 (5.13) | 64.21 (4.59) | 0.26 | 63.86 (4.54) | 62.96 (4.36) | 64.61 (4.61) | 0.14 |
| Sex (M:F) | 24:52 | 9:24 | 15:28 | 0.62 | 22:51 | 7:22 | 15:29 | 0.44 | 22:50 | 7:25 | 15:25 | 0.20 | 19:47 | 6:24 | 13:23 | 0.18 |
| %APOE | 38.2 | 42.4 | 34.9 | 0.63 | 38.4 | 30.2 | 34.1 | 0.46 | 37.5 | 43.8 | 32.5 | 0.34 | 37.9 | 43.3 | 33.3 | 0.45 |
| CSF Aβ 1‐42 (pg/mL) | 1136.04 (286.80) | 1160 (239.67) | 1117.28 (319.83) | 0.50 | 1124.69 (296.92) | 1146.78 (283.63) | 1110.13 (307.71) | 0.60 | 1125.54 (298.57) | 1131.67 (281.43) | 1120.64 (315.08) | 0.88 | 1109.03 (298.15) | 1173.33 (279.99) | 1055.44 (305.99) | 0.11 |
| CSF t‐tau (pg/mL) | 274.56 (131.01) | 258.32 (118.94) | 287.03 (139.65) | 0.33 | 282.60 (141.31) | 240.38 (79.79) | 310.43 (165.22) | 0.02 | 283.84 (132.39) | 257.19 (120.92) | 305.16 (138.70) | 0.12 | 295.48 (170.78) | 286.72 (177.33) | 302.78 (167.30) | 0.71 |
| CSF P‐tau (pg/mL) | 47.68 (18.23) | 45.57 (16.81) | 49.30 (19.29) | 0.37 | 47.19 (17.40) | 43.53 (13.73) | 49.61 (19.22) | 0.12 | 47.57 (17.15) | 45.20 (16.97) | 49.47 (17.27) | 0.30 | 46.72 (18.79) | 45.46 (17.20) | 47.76 (20.21) | 0.62 |
Two participants did not receive a lumbar puncture until the 3‐months visit.
CSF measurements
CSF collection and storage as well as APOE genotyping were performed as described.8 We measured concentrations of the “classic” AD biomarkers Aβ 1‐42, total‐tau (t‐tau), and P181‐tau (P‐tau) using the INNOTEST ELISA kit (Fujirebio, Ghent, Belgium). CSF apolipoprotein E (apoE) levels were assessed using the Milliplex APOMAG‐62k multiplex kit, and 29 immune proteins were assayed using the Milliplex HCYTMAG60PMX29BK xMap kit (EMD Millipore, Billerica, MA). We excluded marker analyses with coefficient of variation >15% or missing data >20%, leaving 13 protein species for analysis. We also used mass spectrometry to assay naproxen concentrations in plasma and CSF of 57 and 30 participants, respectively, using methods described elsewhere.9 Data collected at the trial's 3‐ and 12‐month evaluations were discarded for two participants who had previously discontinued treatment.
Statistical analyses
Group comparisons of summary statistics used t‐tests and Fisher's exact test when appropriate. Mann–Whitney U‐tests compared baseline levels of CSF protein markers along with plasma and CSF naproxen concentrations.
Naproxen and CSF immune markers
We tested data for normality, applied Box‐Cox transformation when necessary, and calculated Z‐scores. Paired t‐tests and linear models adjusted for age and sex, as appropriate, compared within‐ and between‐treatment group marker levels at each time point. We then tested for association of naproxen concentration and protein marker levels. Mass spectrometry assays for CSF naproxen concentration were obtained for 30 (18 naproxen‐assigned and 12 placebo‐assigned) participants. We then performed a linear mixed‐effects analysis to test whether CSF immune marker levels changed over the trial period, adjusting for age, sex, APOE ε4 carrier status, and compliance as well as CSF t‐tau and Aβ 1‐42 concentrations. When there was a statistically significant change over time, we repeated the linear mixed‐effects analysis, now adding an interaction term for treatment‐by‐time to test for a difference in slope of change between treatment groups. Naproxen‐treated participants had concurrent measurement of CSF markers and naproxen at 3, 12, and 24 months of follow‐up (16, 16, and 4 participants). We used general linear regression models, adjusted for APOE carrier status and age, to investigate the association of naproxen concentrations with 3‐ and 12‐month protein marker levels. We repeated this analysis pooling all available postbaseline data while also considering participant sex, and CSF t‐tau and Aβ 1‐42, because immune marker levels are associated with AD biomarkers.8 All analyses used two‐sided α = 0.05 in MATLAB software (MathWorks Inc., Natick, Massachusetts).
Results
Summary statistics
Among the 78 participants analyzed, 4 (1 placebo and 3 naproxen), 8 (3 placebo and 5 naproxen), and 66 (30 placebo and 36 naproxen) participants completed 3‐, 12‐, and 24‐month visits on treatment. At baseline, naproxen‐ and placebo‐assigned groups were indistinguishable in sex ratios, proportion of APOE ε4 allele carriage, or CSF P‐tau, t‐tau, and Aβ 1‐42 levels. The naproxen‐assigned group was somewhat older (P = 0.27). Baseline immune marker concentrations were comparable between groups except for IL‐6 levels, which trended higher in participants assigned to naproxen (P = 0.08).
Naproxen enters the brain of treated individuals
No participants had measurable naproxen levels in either plasma or CSF at baseline (before randomization). At follow‐up, only naproxen‐assigned participants had measurable drug in either plasma or CSF (Fig. 1). Follow‐up assays revealed two naproxen‐assigned individuals who had measurable drug in plasma but not in CSF. Otherwise, CSF concentrations were typically ~100‐fold lower than in plasma. Pooling all available postbaseline data revealed little if any association between CSF and plasma concentrations of naproxen (R 2 = 0.02, P = 0.37) and a marginal association of CSF naproxen with age (R 2 = 0.08, P = 0.08). Variability in apparent CNS permeability to naproxen (i.e., CSF naproxen concentration) was not appreciably associated with compliance.
Figure 1.
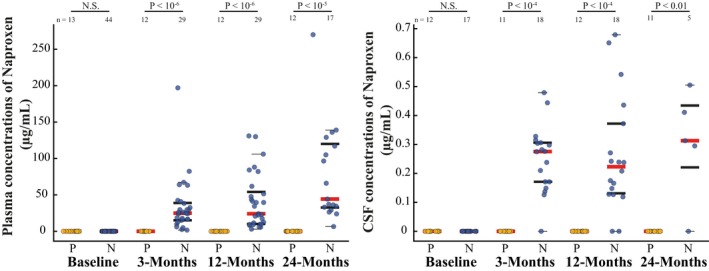
Plasma and CSF concentrations of naproxen in the trial cohort. Plasma (left) and CSF (right) concentrations of naproxen were measured in placebo (yellow)‐ and naproxen (blue)‐assigned participants using LC–MS/MS. The placebo group showed no measurable levels of the drug at any time point. Naproxen‐assigned participants had readily detectable naproxen in plasma, but ~100‐fold lower concentrations in CSF at each follow‐up (note the difference in y‐axis scales). Red lines depict medians, bold lines represent the 25th and 75th percentile, and thin black lines represent the minimum and maximum values not considered to be outliers (first and third quartile ± 1.5 times the interquartile range).
Naproxen does not affect concentrations of CSF immune markers
IL‐1RA, IFN‐α2, and apoE levels increased from baseline over the trial period in both treatment groups (Fig. 2). However, these changes were comparable across the treatment groups at all time points, suggesting that they might uniformly reflect aging of the population10, 11 and not an effect of naproxen. IL‐6 levels declined significantly at 3, 12, and 24 months in naproxen‐assigned participants only, but fell readily within the distribution of placebo participants. A linear mixed‐effects analysis indicated that apoE concentration increased substantially over the trial interval, independent of age, sex, APOE ε4 carrier status, compliance, and CSF t‐tau or Aβ 1‐42 (β = 0.13 units/month, SE = 0.06, P = 0.03). This 2‐year slope of apoE concentrations appeared steeper in naproxen‐assigned participants versus placebo (time‐by‐treatment interaction β = +0.02 units/month, SE = 0.01, P = 0.09). Interestingly, 3‐ and 12‐month CSF naproxen concentrations appeared to be associated with CSF apoE protein (β = 4.10, SE = 2.28, P = 0.10 and β = 3.13, SE = 1.24, P = 0.03), with adjustment for APOE ε4 carrier status and age. Upon pooling all postbaseline data in the naproxen‐assigned group, the association between drug and apoE concentration was stronger and apparently independent of age, sex, APOE ε4 carrier status, and CSF t‐tau and Aβ 1‐42 (β = 3.10, SE = 0.86, P = 0.001). Interpretation of this last observation is difficult, however, because no detectable difference appeared in mean apoE concentrations at all time points across the two treatment arms. This finding may relate to a relative (not statistically significant) difference in baseline apoE levels between the two groups. Further adjustment for this variable indicated a difference in slope between the treatment groups (time‐by‐treatment interaction β = +0.02 units/month, SE = 0.01, P = 0.04). All results remained similar when restricting our analyses to the 66 participants who completed 24 months on study drug.
Figure 2.
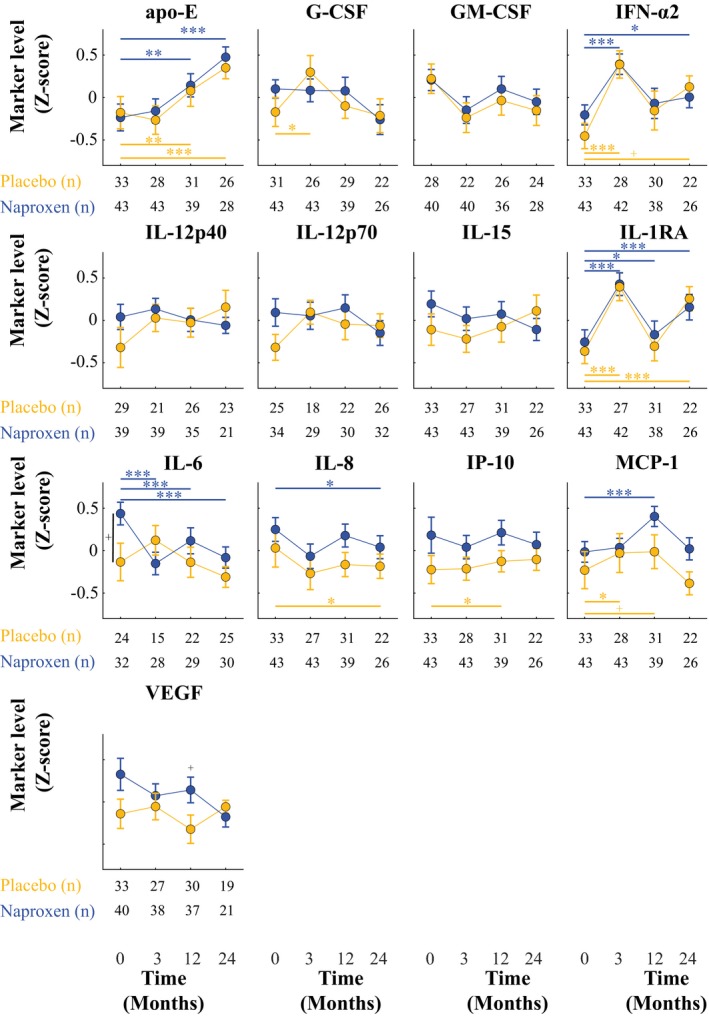
Trajectory of CSF immune markers by treatment group. Longitudinal CSF levels of immune markers in the placebo (yellow) and naproxen (blue) groups are represented. Point estimates represent group means and error bars standard error of the mean. IL‐6 levels tended to be higher at baseline in the naproxen‐assigned group compared to placebo (P ≤ 0.1). IL‐1RA, IFN‐α2, and apoE levels increased from baseline in both treatment groups over the trial period. IL‐6 levels decreased significantly at 3, 12, and 24 months compared to baseline in naproxen‐assigned participants only. At all postbaseline time points, immune marker levels were comparable between both treatment arms. + P < 0.1; * P < 0.05; ** P < 0.01; *** P < 0.005.
Discussion
In a sample of healthy elderly at increased risk for AD dementia, we examined whether 220 mg of oral naproxen b.i.d. entered the CSF and thereby affected immune marker concentrations. While drug levels were measurable in plasma, CSF concentrations were ~100‐fold lower. Naproxen treatment did not meaningfully alter CSF concentrations of several immune markers. CSF apolipoprotein E concentrations increased during the trial period, and the results suggested its association with CSF naproxen concentrations.
Early epidemiologic observations of reduced AD risk with NSAID treatment led to widespread speculation that these drugs produced a beneficial suppression of inflammatory responses to accruing pathology. However, this interpretation has never been verified. While the inhibition of cyclooxygenase activity (the proximate target of NSAID activity) can lead to reduced inflammation, NSAIDs also have other effects. For instance, some NSAIDs may reduce accrual of Aβ pathology itself,12 while others may promote neuronal survival.13 However, few human studies have examined whether NSAIDs cross the blood–brain barrier. Our results suggest CSF permeability for naproxen is limited, much like other conventional NSAIDs.14 While it is uncertain whether CSF levels of naproxen fully reflect brain levels, the proportion of drug in CSF compared to blood is comparable to what is measurable in brain tissue in animal models.15, 16 Thus, brain levels of naproxen may never reach levels needed to observe the neuroprotective effects described in vitro.17 Drug levels were, nonetheless, sufficiently measurable in CSF to suggest no meaningful effects on immune marker activity. One important limitation is that some immune markers may be actively transported across the BBB and possibly hide the apparent effects of naproxen on immune markers. However, while IL‐6 may be actively transported across the BBB,18 our IL‐6 results appear to suggest nothing more than regression toward the mean among treated individuals. More importantly, the contribution of contamination – if any – to CSF concentration of immune markers is unknown, and one would expect that a decrease in global brain immune reactivity would be reflected at the CSF level, as it is for amyloid and tau. By contrast, CSF naproxen concentrations were associated with increasing CSF apoE levels. One of us (J.P.) had previously shown that NSAIDs may increase astrocytic production of apoE19 and that this apparent effect was obtained at NSAID concentrations below those typically required for COX inhibition.
We conclude that it is unlikely that a central “anti‐inflammatory” effect would be responsible for any purported benefit of NSAIDs, if any, in protecting against the development of AD. Our findings suggest instead that NSAID benefits may stem from increased apoE concentration in proportion to drug levels. However, this drug‐related increase was not strong enough to obviate increasing apoE levels over time, possibly as a consequence of aging. Before being regarded as conclusive, these results require replication, possibly in a larger group of individuals. We cannot, however, exclude that NSAIDs still bear some influence on CNS immune pathways not measured here or that peripheral immune system activation might in some way modulate risk of AD pathology.20
Author Contributions
P‐F.M. and J.B. contributed to data interpretation as well as drafting and revising of the manuscript. P‐F.M. analyzed the data. A.L., P.R‐N., and J.P. had a major role in data acquisition (measures of CSF proteins, lumbar punctures, and laboratory methods, respectively). J.P. and J.B. contributed to study conceptualization and design. J.B. supervised the study.
Conflict of Interest
The authors declare no conflict of interest.
Acknowledgment
The authors thank all research participants and their study partners for their generosity and commitment to this work. We also acknowledge efforts from many members of the PREVENT‐AD Research Group (https://preventad.loris.ca/acknowledgements/acknowledgements.php?date=2019‐01‐31).
Funding Information
The INTREPAD trial was supported by McGill University, by an unrestricted gift from Pfizer Canada, and by infrastructure support from the Canada Fund for Innovation. P‐F.M. is supported by funding from the Canada First Research Excellence Fund, awarded to McGill University for the Healthy Brains for Healthy Lives initiative and the Lazlo & Etelka Kollar fellowship fund for this project. J.B.'s efforts were supported by a Canada Research Chair award from the Government of Canada. Genetic and laboratory work (J.P.) was supported by the Fonds de Recherche du Québec‐Santé (FRQ‐S) and the J.L. Levesque Foundation. Additional support was provided by the Douglas Mental Health University Institute Foundation. The funding agencies had no role in study design, data analysis, and interpretation of results.
Funding Statement
This work was funded by McGill University grant ; Canada Fund for Innovation grant ; Government of Canada grant ; Fonds de Recherche du Québec‐Santé grant ; J.L. Levesque Foundation grant ; Douglas Mental Health University Institute Foundation grant .
Data availability
All de‐identified data and related documentation from this trial are available upon request to qualified researchers without limit of time, subject to a standard data sharing agreement.
References
- 1. McGeer PL, McGeer E, Rogers J, Sibley J. Anti‐inflammatory drugs and Alzheimer disease. Lancet 1990;335:1037. [DOI] [PubMed] [Google Scholar]
- 2. in t’ Veld BA, Ruitenberg A, Hofman A, et al. Nonsteroidal antiinflammatory drugs and the risk of Alzheimer's disease. N Engl J Med 2001;345:1515–1521. [DOI] [PubMed] [Google Scholar]
- 3. Adapt Research Group . Naproxen and celecoxib do not prevent AD in early results from a randomized controlled trial. Neurology 2007;68:1800–1808. [DOI] [PubMed] [Google Scholar]
- 4. Aisen PS, Schafer KA, Grundman M, et al. Effects of rofecoxib or naproxen vs placebo on Alzheimer disease progression: a randomized controlled trial. JAMA 2003;289:2819–2826. [DOI] [PubMed] [Google Scholar]
- 5. Thal LJ, Ferris SH, Kirby L, et al. A randomized, double‐blind, study of rofecoxib in patients with mild cognitive impairment. Neuropsychopharmacology 2005;30:1204–1215. [DOI] [PubMed] [Google Scholar]
- 6. Meyer PF, Tremblay-Mercier J, Leoutsakos J, et al. INTREPAD: A randomized trial of naproxen to slow progress of presymptomatic Alzheimer disease. Neurology. 2019;92(18):e2070–e2080. [DOI] [PMC free article] [PubMed] [Google Scholar]
- 7. Breitner JCS, Poirier J, Etienne PE, Leoutsakos JM; PREVENT‐AD Research G . Rationale and structure for a new center for studies on prevention of Alzheimer's disease (StoP‐AD). J Prev Alz Dis 2016;3:236–242. [DOI] [PubMed] [Google Scholar]
- 8. Meyer PF, Savard M, Poirier J, et al. Bi‐directional association of cerebrospinal fluid immune markers with stage of Alzheimer's disease pathogenesis. J Alzheimers Dis 2018;63:577–590. [DOI] [PMC free article] [PubMed] [Google Scholar]
- 9. Elsinghorst PW, Kinzig M, Rodamer M, et al. An LC‐MS/MS procedure for the quantification of naproxen in human plasma: development, validation, comparison with other methods, and application to a pharmacokinetic study. J Chromatogr B Analyt Technol Biomed Life Sci 2011;879:1686–1696. [DOI] [PubMed] [Google Scholar]
- 10. Lu T, Pan Y, Kao SY, et al. Gene regulation and DNA damage in the ageing human brain. Nature 2004;429:883–891. [DOI] [PubMed] [Google Scholar]
- 11. Giunta B, Fernandez F, Nikolic WV, et al. Inflammaging as a prodrome to Alzheimer's disease. J Neuroinflammation 2008;11:51. [DOI] [PMC free article] [PubMed] [Google Scholar]
- 12. Weggen S, Eriksen JL, Das P, et al. A subset of NSAIDs lower amyloidogenic Abeta42 independently of cyclooxygenase activity. Nature 2001;414:212–216. [DOI] [PubMed] [Google Scholar]
- 13. Woodling NS, Colas D, Wang Q, et al. Cyclooxygenase inhibition targets neurons to prevent early behavioural decline in Alzheimer's disease model mice. Brain 2016;139:2063–2081. [DOI] [PMC free article] [PubMed] [Google Scholar]
- 14. Bannwarth B, Netter P, Pourel J, et al. Clinical pharmacokinetics of nonsteroidal anti‐inflammatory drugs in the cerebrospinal fluid. Biomed Pharmacother 1989;43:121–126. [DOI] [PubMed] [Google Scholar]
- 15. Eriksen JL, Sagi SA, Smith TE, et al. NSAIDs and enantiomers of flurbiprofen target gamma‐secretase and lower Abeta 42 in vivo. J Clin Investig 2003;112:440–449. [DOI] [PMC free article] [PubMed] [Google Scholar]
- 16. Mannila A, Rautio J, Lehtonen M, et al. Inefficient central nervous system delivery limits the use of ibuprofen in neurodegenerative diseases. Eur J Pharm Sci 2005;24:101–105. [DOI] [PubMed] [Google Scholar]
- 17. Gasparini L, Ongini E, Wenk G. Non‐steroidal anti‐inflammatory drugs (NSAIDs) in Alzheimer's disease: old and new mechanisms of action. J Neurochem 2004;91:521–536. [DOI] [PubMed] [Google Scholar]
- 18. Banks WA. Blood‐brain barrier transport of cytokines: a mechanism for neuropathology. Curr Pharm Des 2005;11:973–984. [DOI] [PubMed] [Google Scholar]
- 19. Aleong R, Aumont N, Dea D, Poirier J. Non‐steroidal anti‐inflammatory drugs mediate increased in vitro glial expression of apolipoprotein E protein. Eur J Neurosci 2003;18:1428–1438. [DOI] [PubMed] [Google Scholar]
- 20. Wendeln AC, Degenhardt K, Kaurani L, et al. Innate immune memory in the brain shapes neurological disease hallmarks. Nature 2018;556:332–338. [DOI] [PMC free article] [PubMed] [Google Scholar]
Associated Data
This section collects any data citations, data availability statements, or supplementary materials included in this article.
Data Availability Statement
All de‐identified data and related documentation from this trial are available upon request to qualified researchers without limit of time, subject to a standard data sharing agreement.