Abstract
Objective
To examine phenotype–genotype discrepancies (PGDs) wherein genotype‐concealed and prospective judgments of the motor onset of Huntington disease (HD) occurred among at‐risk adults who had nonexpanded (<37) cytosine–adenine–guanine (CAG) trinucleotide DNA repeats.
Methods
We examined the prospective clinical assessments of investigators who were kept unaware of individual CAG lengths in the Prospective Huntington At‐Risk Observational Study (PHAROS) who enrolled and followed undiagnosed adults at risk for HD who chose not to learn their gene status. Subjects (n = 1001) at 43 Huntington Study Group research sites in the US and Canada were evaluated prospectively and systematically between 1999 and 2009. At each site, an investigator was designated to perform comprehensive clinic assessments and another investigator to rate only the motor examination. Phenoconversion from a “premanifest” status to a confidently “manifest” status was based on investigator judgment (diagnostic confidence level) of the extrapyramidal motor features of HD.
Results
There were 20 PGDs that over time had less severe motor scores than the 101 phenoconversions with CAG ≥37, but more severe motor scores than nonconversions. Following conversion, subjects with CAG ≥37 expansions worsened more motorically and cognitively than PGD subjects in the < 37 group. PGDs were concentrated among three sites and a few investigators, especially raters who only assessed the motor examination.
Interpretation
The ability to detect the clinical onset of HD in a timely and reliable fashion remains the key for developing experimental treatments aimed at postponing the clinical onset of HD. Comprehensive clinical evaluation is a more accurate and reliable basis for determining HD clinical onset than sole reliance on judging the extrapyramidal features of HD.
Introduction
Huntington disease (HD) is an autosomal dominant neurodegenerative disease that arises from a single gene mutation on the short arm of chromosome 4, as detected by an exonic cytosine–adenine–guanine (CAG) repeat length ≥ 37.1 Adults at risk for HD who have expanded CAG ≥ 37 have nearly a 100% lifetime risk to develop clinical manifestations of this fatal disease, consisting of progressive motor, cognitive, and functional decline. Individuals with so‐called intermediate CAG in the range of 27–35 repeats are relatively uncommon and show more variable penetrance and expression.2 A major aim of the large prospective study of individuals at risk for HD, the Prospective Huntington Disease At‐Risk Observational Study (PHAROS), was to determine the annual rate of conversion from premanifest to clinically manifest HD. This information is central to the design and statistical powering of disease‐modifying therapeutic trials in the population of clinically unaffected individuals at high risk to develop HD.
PHAROS was a multisite prospective study of 1001 clinically unaffected adults at nominal 50:50 risk for HD who had chosen not to undergo presymptomatic DNA testing for the CAG trinucleotide expansion, and who had a parent or sibling diagnosed with HD clinically or by expanded CAG or autopsy. Participants consented to longitudinal assessments about every 9 months and to provide a blood sample for research analysis of CAG with the proviso that their individual CAG results would not be disclosed to anyone.3, 4
PHAROS took place over 10 years (1999–2009), and the data on motor phenoconversion showed a surprising number of phenotype–genotype discrepancies (PGDs) (i.e., instances in which research participants were rated by investigators with ≥ 99% confidence of having motor features of HD but had CAG < 37 repeats) in the setting of the overall number of participants who were judged as having phenoconverted with CAG ≥ 37.
Methods
Each of the 43 PHAROS research sites in the United States and Canada included a site investigator (SI), who examined all clinical aspects of the participant's condition, and an independent rater (IR), who only carried out the motor examination of the Unified Huntington Disease Rating Scale (UHDRS)5 and was kept unaware of all other clinical evaluations. Both SI and IR were kept unaware of CAG results and answered the following question at the end of each motor assessment: “To what degree are you confident that this person meets the operational definition of the unequivocal presence of an otherwise unexplained extrapyramidal movement disorder (e.g., chorea, dystonia, bradykinesia, rigidity) in a subject at risk for HD?” Diagnostic Confidence Level (DCL) ratings ranged from 0 “normal” (no abnormalities), 1 “non‐specific motor findings” (<50% confidence), 2 “possible HD motor signs” (50–89% confidence), 3 “likely HD motor signs” (90–98% confidence), to 4 “motor abnormalities that are unequivocal signs of HD” (≥ 99% confidence). A rating of 4 by the IR was prespecified as the primary indicator of motor phenoconversion for the study.
In addition, SIs replied to two further questions: UHDRS Q80, “Based on the entire UHDRS (motor, cognitive, behavioral and functional components), do you believe with a confidence level ≥ 99% that this subject has manifest HD?” (Yes or No); UHDRS Q80b, “Based on the entire UHDRS (motor, cognitive, behavioral and functional components), what is your hunch about HD positivity in this participant?” (HD gene‐positive or not HD gene‐positive), and if “gene‐positive,” “What are the reasons (motor, cognitive, behavioral, functional) you feel this participant is gene positive?” More than one reason could be selected. Both SI and IR raters underwent baseline and annual training on the UHDRS and DCL.
Clinical outcome scoring was carried out at all visits as described in the UHDRS.
To compare postbaseline phenoconverters and nonconverters (as judged by the IR) by CAG status, UHDRS motor progression and symbol digit cognition scores over time were plotted using means and standard errors from each visit. Repeated measures analyses, adjusted for age and gender, were used to compare progression over time for phenoconverters by CAG status.
Subjects identified by the IR as phenoconverters postbaseline were each matched with two nonconverters (as defined by the IR) from the expanded CAG group and two nonconverters from the nonexpanded group. The matching was based on age, paternal or maternal inheritance of HD, and visit number at the time of phenoconversion (i.e., first rating of diagnostic confidence ≥ 99%), which required nonconverters to have data from the same visit as the phenoconversion visit. Motor progression and UHDRS symbol digit scores before and after the phenoconversion (or index) visit were plotted using means and standard errors from each visit.
Results
Four of 1001 participants were excluded from analysis at enrollment due to lack of CAG repeat data; 997 individuals with CAG data were followed prospectively for mean (SD) of 6.1 (2.8) years; 355 persons (35.6%) had expanded ≥ 37 repeats, and 642 (64.4%) had a CAG repeat number < 37. Over the course of the study, 121 individuals were rated 4 with ≥ 99% confidence as motor phenoconversion by either the IR or the SI, 101 (83.5%) of whom had a CAG ≥ 37 and 20 (16.5%) of whom had a CAG < 37. For this report, we refer to these latter 20 cases as “Phenotype–Genotype Discrepancies”.
Baseline characteristics of phenoconverters are shown in Table 1, and ratings by the IRs and the SIs are summarized in Table 2. Over the course of the study, the SIs (who did comprehensive clinical evaluations) judged 92 individuals who were phenoconverted (a rating of 4), eight (8.7%) of whom had a CAG < 37 repeat, representing a PGD. Over the same period, the IRs (who only performed the motor exam) judged 86 individuals who were phenoconverted, 15 (17.4%) of whom had a CAG < 37 that was discrepant with the diagnosis of HD. Only three of the 20 PGDs were rated 4 by both IR and SI. Three subjects had intermediate‐range CAG repeats (27, 31, 34). One was judged by both IR and SI to have phenoconverted; another was judged to have phenoconverted by the IR, and another by the SI.
Table 1.
Baseline characteristics of motor phenoconverters by CAG
| CAG < 37 (n = 20) (range 17–34) | CAG ≥ 37 (n = 101) (range 37–48) | |
|---|---|---|
| Age | 42.7 (7.7) | 43.5 (7.1) |
| Female gender | 15 (75%) | 72 (71%) |
| Affected mother | 9 (45%) | 53 (52%) |
| IR total motor score (higher worse) | 7.2 (5.5) | 7.4 (7.7) |
| Symbol digit (higher better) | 47.7 (9.4) | 45.8 (10.2) |
| CAG repeat length | 20.4 (5.0) | 42.6 (2.0) |
Shown as mean (standard deviation) or number (%), as appropriate.
Table 2.
Motor phenoconversion by CAG status for independent raters (IRs) and site investigators (SIs)
| Independent rater | Site investigator | |||
|---|---|---|---|---|
| CAG < 37 N = 642 | CAG ≥ 37 N = 355 | CAG < 37 N = 642 | CAG ≥ 37 N = 355 | |
| Baseline | 4 | 10 | 0 | 10 |
| After baseline | 11 | 61 | 8 | 74 |
| Total | 15 | 71 | 8 | 84 |
The SIs (who did comprehensive clinical evaluations) judged a total of 92 individuals phenoconverted (a rating of 4), eight (8.7%) of whom had a CAG < 37 repeat, representing a PGD. Over the same period, the IRs (who only performed the motor exam) judged 86 individuals phenoconverted, 15 (17.4%) of whom had a CAG < 37 that was discrepant with the diagnosis of HD. Only three of the 20 PGDs were rated 4 by both an IR and an SI.
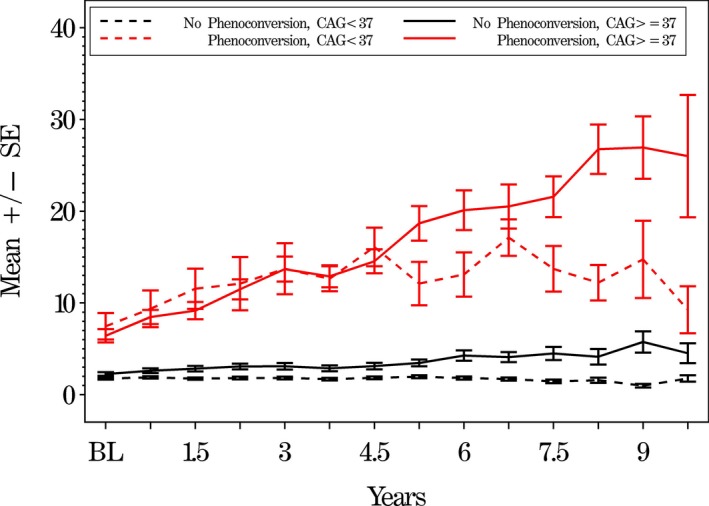
Starting at baseline and as rated by the IR, motor progression of the PGD cases (CAG < 37) was compared with CAG ≥ 37 subjects who did or did not show motor phenoconversion (Fig. 1). The PGD cases generally had lower (less severe) motor scores than those of the other phenoconverters and higher (more severe) scores than the nonconverters. Motor scores for phenoconverters with CAG ≥ 37 worsened over time with an estimated annual slope (SE) of 2.45 (0.19), compared with an estimated slope of 0.40 (0.41) for PGD phenoconverters with CAG < 37 (P < 0.0001). Plots showing motor evaluations by SIs were similar (data not shown).
Figure 1.

Mean independent rater (IR) total motor UHDRS scores comparing subjects by motor phenoconversion and CAG status. Mean UHDRS motor scores (higher scores are worse) on the y‐axis versus time in years on the x‐axis of those who phenoconverted with ≥ 37 repeats (solid red line) and those PGDs who phenoconverted with < 37 repeats (dotted red line). Black lines show subjects who have not phenoconverted and have ≥ 37 repeats or < 37 repeats, respectively. The error bars show the standard error of the mean.
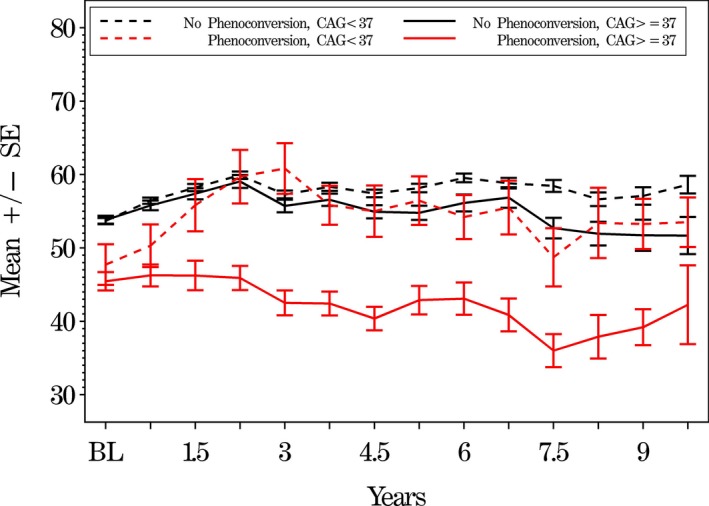
Analyses of progression of symbol digit cognitive measures also showed that phenoconverters with CAG ≥ 37 worsened significantly (P = 0.0004) more than phenoconverters with CAG < 37 (Fig. 2). Analyses of UHDRS Stroop interference (P = 0.0004) and verbal fluency (P = 0.0570) cognitive scores were similar (data not shown).
Figure 2.

Mean Symbol digit cognitive scores comparing subjects by IR‐judged motor phenoconversion and CAG status. Mean symbol digit scores (lower scores are worse) on the y‐axis versus time in years on the x‐axis of those who phenoconverted with ≥ 37 repeats (solid red line) and those PGDs who phenoconverted with < 37 repeats (dotted red line). Black lines show subjects who have not phenoconverted and have ≥ 37 repeats or < 37 repeats, respectively. The error bars show the standard error of the mean.
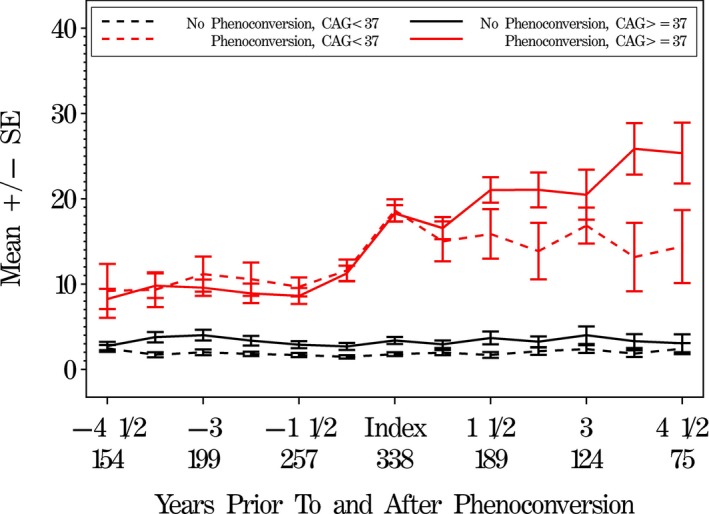
The IRs judged 72 subjects as motor phenoconversions postbaseline, 11 (15.3%) of whom had CAG < 37 (Table 2). Each of these 72 subjects was matched with two subjects each from the CAG < 37 and CAG ≥ 37 groups whom the IR judged as nonconverters. For subjects approaching phenoconversion (index visit), the motor scores in the two CAG groups were similar. However, following conversion, subjects in the expanded group worsened more than those in the nonexpanded group (Fig. 3).
Figure 3.

Mean independent rater (IR) total motor UHDRS scores comparing prior to and after motor phenoconversion. IR total motor scores (higher scores are worse) prior to and after phenoconversion, by phenoconversion and CAG status (matched subjects). The phenoconversion visit is designated as the index visit. For each of the four conversion/CAG groups, we look both backwards from phenoconversion and forward after phenoconversion. Numbers on the x‐axis represent years prior to and after the index visit, along with total sample size for each time point.
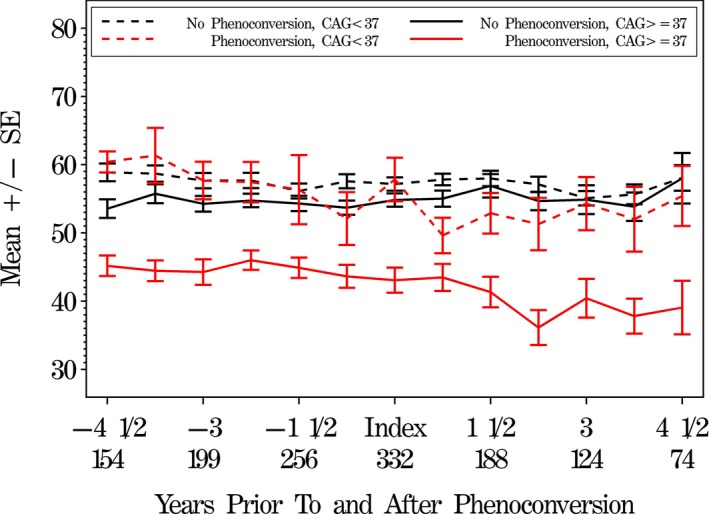
Figure 4 shows a similar plot of symbol digit score looking backward and forward from the phenoconversion index visit. Scores for phenoconverters with CAG ≥ 37 are clearly lower (worse) than those in the other groups, but subjects in the CAG < 37 PGD group more closely resemble the nonconverters.
Figure 4.

Mean symbol digit cognitive scores comparing prior to and after IR‐judged motor phenoconversion. Symbol digit scores (lower scores are worse) prior to and after phenoconversion, by phenoconversion and CAG status (matched subjects). The phenoconversion visit is designated as the index visit. For each of the four conversion/CAG groups, we look both backward from phenoconversion, and forward after phenoconversion. Numbers on the x‐axis represent years prior to and after the index visit, along with total sample size for each time point.
SIs were asked at each visit if they believed with ≥ 99% confidence that subjects had manifest HD. A comparison of all SI ratings over the course of the study (multiple visits per subject) showed that, for visits where subjects with CAG < 37 had a motor confidence rating of 4 (≥99%), SIs indicated that these subjects had manifest HD only 62% of the time, compared with 94% of the time for subjects with CAG ≥ 37.
SIs were also asked if they thought subjects carried the HD gene (gene‐positive). Over all visits by subjects with CAG < 37, the SIs believed that 14% of these visits represented gene‐positive subjects; however, for 96% of visits by subjects with a DCL motor rating of 3 or 4, the SIs believed that subjects were HD gene‐positive. Over all visits by subjects with CAG ≥ 37, the SIs believed that 55% of these visits were by gene‐positive subjects; however, for 98% of visits by subjects with a motor rating of 3 or 4, the SIs believed that subjects were gene‐positive. Reasons given for the belief that subjects were gene positive are shown in Table 3 by SI motor score and CAG status; these hunches were generally based on motor scores, with functional scores seldom selected as a reason. However, for visits by the 20 PGD subjects, behavioral scores were cited more frequently as a reason for HD positivity than for visits by other CAG < 37 subjects (57% vs. 31%, P = 0.0006, for visits where the SI DCL motor rating was 0–2, and 64% vs. 25%, P = 0.11, for visits where the SI DCL motor rating was 3–4).
Table 3.
Site investigators (SIs) reasons for believing that subjects were HD gene‐positive by CAG and diagnostic confidence level (DCL)
| Reasons for believing that subject is gene positive | CAG < 37 N = 434 visits | CAG ≥ 37 N = 906 visits | ||
|---|---|---|---|---|
| DCL 0–2 N = 391 visits | DCL 3–4 N = 43 visits | DCL 0–2 N = 510 visits | DCL 3–4 N = 394 visits | |
| Motor | 290 (75%) | 36 (84%) | 410 (81%) | 390 (99%) |
| Cognitive | 49 (13%) | 13 (32%) | 81 (16%) | 189 (48%) |
| Behavioral | 130 (34%) | 23 (56%) | 169 (34%) | 176 (45%) |
| Functional | 17 (4%) | 0 (0%) | 32 (6%) | 108 (28%) |
Subject visits where site investigator thought that the subject was gene positive: multiple visits per subject (N = 1340 visits). SI motor evaluation and reasons for believing that subject is gene positive; multiple reasons could be selected.
Discussion
The primary goal of PHAROS was to determine the feasibility of a double‐concealed prospective trial of therapies in persons at risk for HD who wish to remain unaware of their genetic status. One aim was to determine the rate at which participants may move from “motor premanifest” to “motor manifest” HD. This so‐called “motor phenoconversion” rate would then provide estimates to form the basis for a statistical power analysis for studies examining therapies in such a population of at‐risk adults. Over the span of 10 years, we examined prospectively 997 individuals at risk for HD and identified 121 phenoconverters. Of these, we found that 20 (16.5%) “phenoconverters” had < 37 CAG repeats. The IRs who reported a higher proportion of PGDs than SIs (17.4% vs. 8.7% overall, including baseline) may have been disadvantaged by their lack of comprehensive clinical data. In retrospect, independent motor ratings without the benefit of other clinical data add little or no precision to detection of manifest HD. Three of the 20 PGD cases had intermediate‐range CAG that may have reflected variable penetrance and expressivity. Regardless, the observed false‐positive rate would be problematic for any large clinical trial.
To understand this high number of PGD, we examined several potential explanations. We retested CAG repeat numbers in seven of the 20 PGD cases and found all retests to be the same as the original CAG analyses. Intermediate repeats with CAG between 27 and 34 were present in three PGDs, but the rest of the PGDs had CAG repeat numbers < 27 CAG, clearly in the nonexpanded range. Nonetheless, it is possible that some of the PGDs were hereditary phenocopies related to a non‐HD disorder. Six of the 20 PGDs who had an opportunity for a subsequent visit were judged only transiently as motor phenoconversion; that is, the rating of 4 was not repeated on any subsequent visit. It may have been that such nonsustained ratings were individuals who had an isolated abnormal motor exam after an unrelated illness or might otherwise have been impaired (e.g., low‐level intoxication with caffeine or other stimulants) at the time of the visit. The question of HD phenocopies (another disease that looks like HD) was also considered. It is possible that some of these PGDs represented mild cases of comorbid disease such as occult vascular or infectious diseases or other transient causes of motor dysfunction.
We also examined the possibility of investigator error. Fifteen of the 20 PGDs were concentrated at three sites and comprised 33%, 39%, and 56% of phenoconversion judgments at these sites. We reviewed all PGDs at these three sites, but no systematic sources of investigator‐related error were found, such as lack of experience or training.
There is no single, clear explanation for phenotype/genotype discrepancies. The PHAROS study demonstrates the challenge in carrying out a long‐term trial using motor diagnostic confidence as a single primary endpoint. The rate of motor false‐positive misdiagnoses was relatively high, despite yearly training in the diagnosis, especially among the IRs whose assessments were restricted to the motor examination. Rather than motor diagnosis as a singular endpoint, a composite of motor and cognitive functions and a comprehensive investigator assessment could provide a more robust and informative outcome measure. Wearable devices to quantitatively monitor movement6 may prove useful in improving the specificity and sensitivity of motor phenoconversion.
Examining experimental interventions among at‐risk adults who choose not to learn their HD gene status might reasonably be considered as an inefficient approach to detect treatments aimed at postponing the clinical onset of HD. However, most adults at risk for HD have opted not to undergo presymptomatic DNA testing, and many of these individuals would likely consent to participate in a randomized controlled trial (RCT) if they could retain their choice not to learn of or disclose their individual gene status.
A large randomized controlled trial in adults at risk for carrying the autosomal dominant Alzheimer presenilin‐1 E280A mutation7, 8 has been successfully enrolled whereby only subjects with the gene mutation are randomized to active treatment or placebo, and all research participants without the mutation are assigned to placebo. In this trial design, individual gene mutation status is not revealed. Participants may decide on their own to undergo DNA testing during or after conclusion of the trial. The feasibility of this research approach, taken together with our PGD findings in PHAROS, suggests that both motor and cognitive outcomes and comprehensive clinical evaluations are applicable to the experimental therapeutics of the large population of adults at risk for HD.
Understanding PGDs in PHAROS also has implications for the experimental therapeutics of other neurogenetic disorders where phenoconversion represents a key clinical endpoint. Refinement of the specificity, sensitivity, accuracy, and operational definitions for phenoconversion will help accelerate the pace of experimental therapeutics for HD and other disorders wherein premanifest disease becomes clinically manifest.
Conflict of Interest
None of the authors report conflicts of interest related to the conduct or reporting of PHAROS.
Acknowledgments
Funding/Support: This research was supported by grants and awards from the National Institites of Health, National Human Genome Research Institute (HG‐02449) and National Institutes of Neurological Disorders and Stroke (I Shoulson, PI), the High Q Foundation/CHDI Foundation, Inc, the Huntington's Disease Society of America, the Hereditary Disease Foundation, the Huntington Society of Canada, and the Fox Family Foundation.
Role of the Funder/Sponsor: The funding organizations had no role in the collection, management, analysis, and interpretation of the data; preparation, review, or approval of the manuscript; or decision to submit the manuscript for publication.
The research participants who volunteered for PHAROS are recognized especially for their committed and sustained participation in this long‐term observational study.
Funding Information
This research was supported by grants and awards from the National Institutes of Health, National Human Genome Research Institute (HG‐02449) and National Institutes of Neurological Disorders and Stroke (I Shoulson, PI), the High Q Foundation/CHDI Foundation, Inc, the Huntington's Disease Society of America, the Hereditary Disease Foundation, the Huntington Society of Canada, and the Fox Family Foundation.
PHAROS Investigators are named in acknowledgement sections of references 3 and 4.
PHAROS is registered at Clinicaltrials.gov NCT00052143 (January 24, 2003).
Institutional review was carried out at all 43 research sites under the lead of the University of Rochester.
Funding Statement
This work was funded by Fox Family Foundation grant ; National Human Genome Research Institute grant HG 02449; Hereditary Disease Foundation grant ; Huntington Society of Canada grant ; CHDI Foundation grant ; Huntington's Disease Society of America grant ; National Institute of Neurological Disorders and Stroke grant ; National Institutes of Health grant .
References
- 1. Shoulson I, Young AB. Milestones in huntington disease. Mov Disord 2011;26:1127–1133. 10.1002/mds.23685. [DOI] [PubMed] [Google Scholar]
- 2. Killoran A, Biglan KM, Jankovic J, et al. Characterization of the Huntington intermediate CAG repeat expansion phenotype in PHAROS. Neurology 2013;80:2022–2027. 10.1212/WNL.0b013e318294b304. [DOI] [PMC free article] [PubMed] [Google Scholar]
- 3. Huntington Study Group PI . At risk for Huntington disease: the PHAROS (Prospective Huntington At Risk Observational Study) cohort enrolled. Arch Neurol 2006;63:991–996. 10.1001/archneur.63.7.991. [DOI] [PubMed] [Google Scholar]
- 4. Huntington Study Group PI ; Biglan KM, Shoulson I, Kieburtz K, et al. Clinical‐genetic associations in the Prospective Huntington at Risk Observational Study (PHAROS): implications for clinical trials. JAMA Neurol 2016;73:102–110. 10.1001/jamaneurol.2015.2736. [DOI] [PubMed] [Google Scholar]
- 5. Investigators HSGP . Unified Huntington's disease rating scale: reliability and consistency. Huntington Study Group. Mov Disord 1996;11:136–142. 10.1002/mds.870110204. [DOI] [PubMed] [Google Scholar]
- 6. Adams JLDK, Xiong M, Tarolli CG, et al. Multiple wearable sensors in Parkinson and Huntington disease individuals: a pilot study in clinic and at home. Digit Biomark 2017;1:52–63. 10.1159/000479018. [DOI] [PMC free article] [PubMed] [Google Scholar]
- 7. Reiman EM, Langbaum JB, Tariot PN. Endpoints in preclinical Alzheimer's disease trials. J Clin Psychiatry 2014;75:661–662. 10.4088/JCP.14com09235. [DOI] [PMC free article] [PubMed] [Google Scholar]
- 8. Reiman EM, Langbaum JB, Fleisher AS, et al. Alzheimer's prevention initiative: a plan to accelerate the evaluation of presymptomatic treatments. J Alzheimers Dis 2011;26(Suppl 3):321–329. 10.3233/JAD-2011-0059. [DOI] [PMC free article] [PubMed] [Google Scholar]


