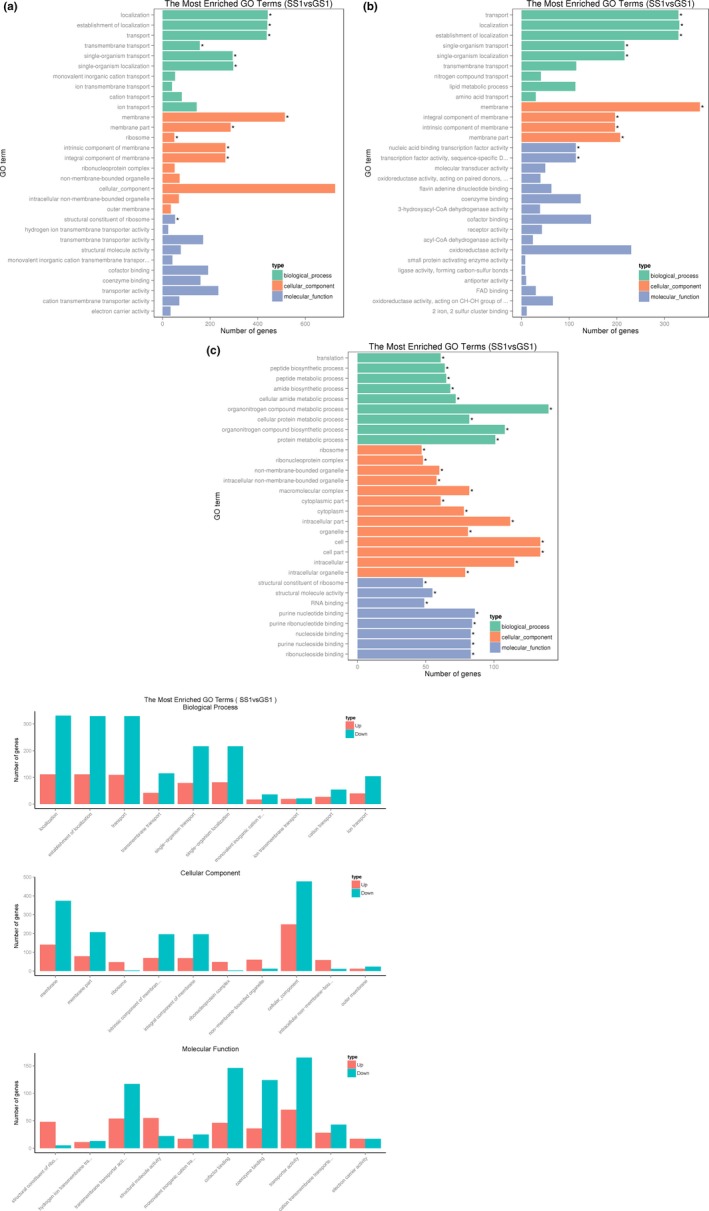
Figure 8.

(a) Distribution of differentially expressed genes (DEGs) in gene ontology (GO) functional categories. (b) Distribution of DEGs downregulated in GO functional categories. (c) Distribution of DEGs upregulated in GO functional categories. (d) Distribution of DEGs up/down in GO functional categories. Green means downregulated, and red means upregulated
