Figure 7.
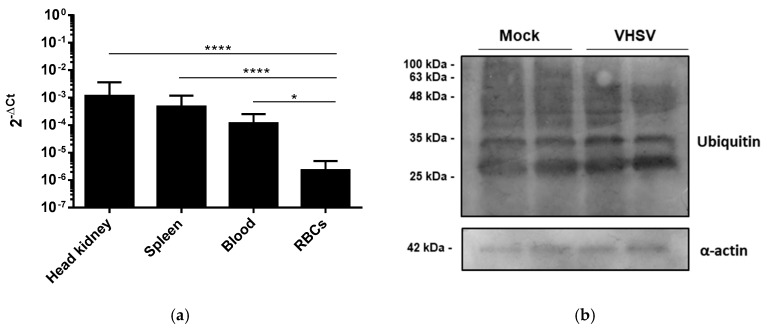
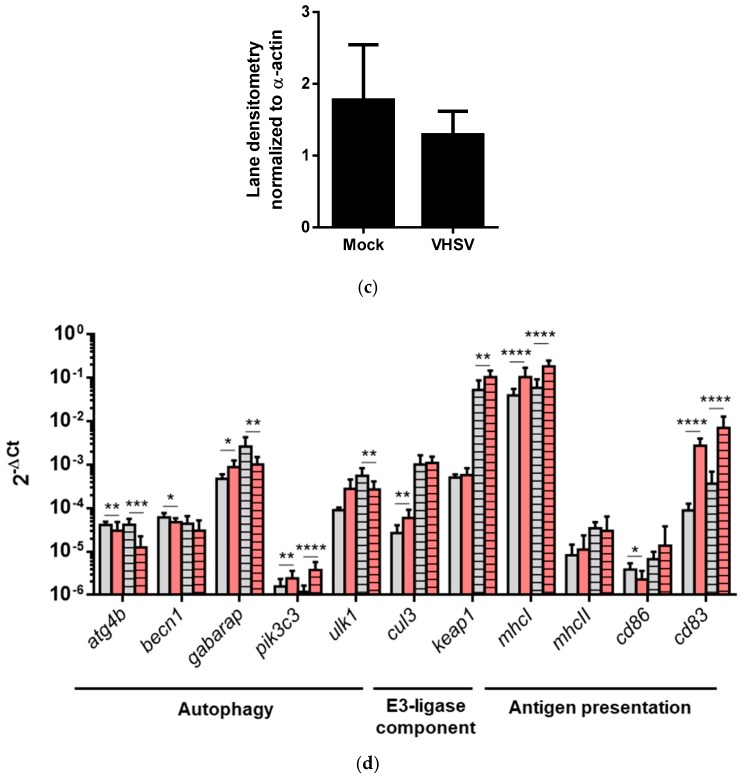
VHSV induced autophagy, E3 ubiquitin ligase components, and antigen presentation genes expression in RBCs from VHSV-challenged rainbow trout. (a) Quantification of NVHSV in head kidney, spleen, blood, and purified RBC samples from challenged rainbow trout 2 dpc. Data represent mean ± SD (n = 7). A Kruskal-Wallis with Dunn´s multiple comparisons test was performed to test statistical significance. (b) Western blot of ubiquitin in RBCs from mock and VHSV-challenged rainbow trout at 2 dpc. α-actin was used as a loading control. Samples from 2 individuals were loaded for each condition. (c) Densitometry bar plot of ubiquitin lane protein content of RBCs from mock and VHSV-challenged rainbow trout after 2 dpc. Values were normalized to α-actin. Data represent mean ± SD (n = 2). Mann-Whitney test was used to test statistical differences. (d) Gene expression values of the autophagy-related genes atg4b, ulk1, becn1, gabarap, and pik3c3; E3 ligase component genes cul3 and keap1; and antigen presentation genes mhcI, mhcII, cd83, and cd86 measured by RT-qPCR in RBCs from mock (gray) and VHSV-challenged (red) rainbow trout at 1 dpc (no pattern) and 2 dpc (striped pattern). Data represent mean ± SD (n = 6). A Mann-Whitney test was performed to test statistical significances between RBCs from mock and VHSV-challenged rainbow trout. Asterisks denote statistical significance.


