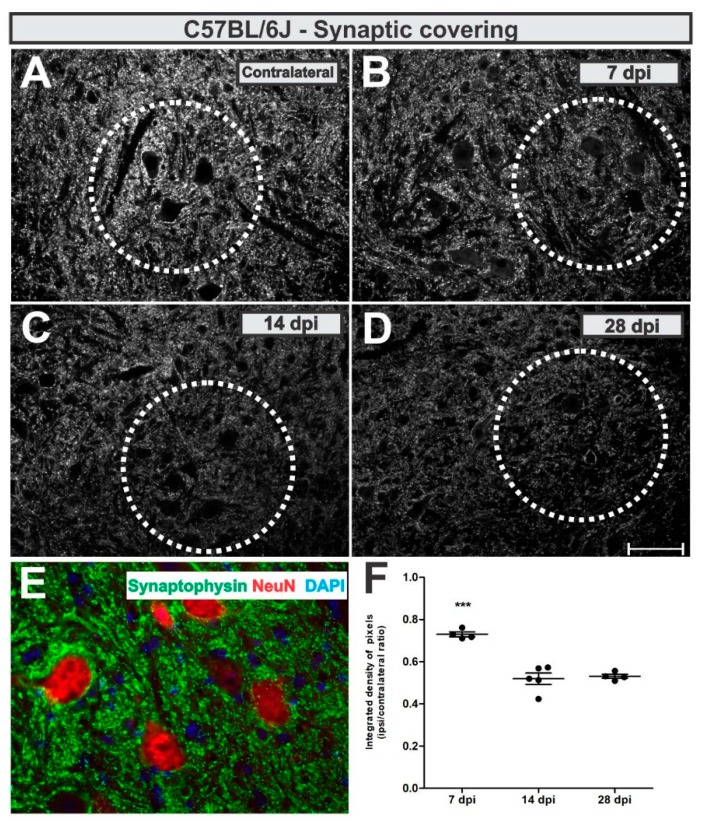
Figure 5.
Synaptic covering in WT mice. (A) representative contralateral image, (B) 7 dpi, (C) 14 dpi and (D) 28 dpi. (E) illustrates the synaptic inputs (in green) to ipsilateral motoneuron-like cells, labelled with NeuN (in red). (F) Comparative quantification among time points (ipsi/contralateral ratio); p < 0.001 (***). Scale bar = 50 µm.

