Figure 4.

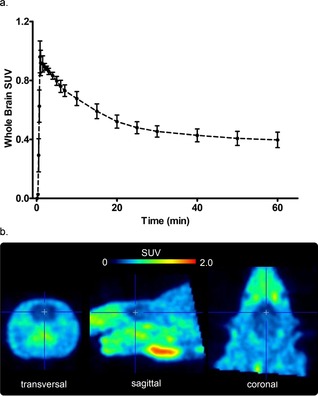
a) Time–activity curve (TAC, n=2) over the acquisition time of 60 min and b) summed 30–60 min PET image of racemic [18F]6 in a healthy rat.

a) Time–activity curve (TAC, n=2) over the acquisition time of 60 min and b) summed 30–60 min PET image of racemic [18F]6 in a healthy rat.