

Abstract
Background.
Before clinical manifestation of regurgitation, the tricuspid annulus dilates and flattens when right ventricular dysfunction is potentially reversible. That makes the case for a prophylactic tricuspid annuloplasty even in the absence of significant tricuspid regurgitation. Owing to the appreciation of the favorable prognostic value of tricuspid annuloplasty, the geometry of the normal tricuspid annulus merits critical analysis.
Methods.
Three-dimensional transesophageal echocar-diographic data from 26 patients were analyzed using Image Arena (TomTec, Munich, Germany) software. Cartesian coordinate data from tricuspid annuli were exported to MATLAB (Mathworks, Natick, MA) for further processing. Annular metrics related to size, shape, and motion were computed.
Results.
The tricuspid annulus demonstrated significant changes in area (p < 0.01) and perimeter (p < 0.03) during the cardiac cycle, with maximum values attained at end diastole. There was significant correlation between two- and three-dimensional area changes, indicating true expansion in the annulus. The anterolateral region of the annulus demonstrated the greatest dynamism (p < 0.01), and the anteroseptal region showed the least. The anteroseptal region also displayed the most non-planarity in the annulus. In addition, vertical translational motion was observed, with a mean distance of 11.3 ± 3.7 mm between end systolic and end diastolic annular centroids.
Conclusions.
The tricuspid annulus is a dynamic, multiplanar structure with heterogeneous regional behavior. These characteristics should be taken into account for optimal annuloplasty device design and efficacy.
The prognostic role of functional tricuspid regurgitation (TR) in patients with left-side heart problems has been appreciated [1–3]. The presence of TR in these circumstances used to be ignored under the presumption that treatment of left-sided pathology would improve TR severity [4, 5]. Hence, surgical therapy of mitral valve (MV) stenosis or regurgitation alone was believed to reduce upstream pressures with subsequent improvement in functional TR severity and right ventricular (RV) remodeling [3]. However, mild to moderate TR during MV surgery not only tends to recur postoperatively but is also associated with reduced functional recovery [6, 7]. As a result, there is a trend to treat mild to moderate TR during MV surgery with annuloplasty as an adjunct procedure, with improved functional recovery [3, 8]. It is now known that before clinical manifestation of TR, the tricuspid annulus dilates and flattens when the RV function is potentially reversible [9]. That makes the case for a prophylactic tricuspid annuloplasty when the annulus is dilated, even in absence of significant TR [9, 10]. Annuloplasty in this scenario facilitates leaflet coaptation by reducing the tricuspid annular area. Owing to the appreciation of the favorable prognostic value of tricuspid annuloplasty, the geometry of the tricuspid annulus has received significant attention [11, 12].
Whereas mitral annular structure and function have been extensively explained, there are limited studies on the geometry of the tricuspid annulus (TA). Current literature is based on analyses derived from invasive animal studies or low-resolution transthoracic echocardiographic data. Recently, intraoperative three-dimensional (3D) transesophageal echocardiography (TEE) and magnetic resonance data have been used to demonstrate the complex shape of the tricuspid annulus [13, 14]. However, there remains a need to describe TA geometry and structure routinely with a degree of precision in a clinically feasible manner. Therefore, utilizing intraoperative 3D TEE data, we sought to devise metrics for precise analysis of the TA. We also reconstructed the TA at end systole and end diastole to enable accurate appreciation of the changes in shape and size over the cardiac cycle. Such information about the shape and size of the annulus can possibly aid in development of annuloplasty rings to restore a dilated, flattened annulus to its natural shape. Since the intraoperative surgical decision hinges on the diagnosis of a remodeled tricuspid annulus, this information can have implications for surgical decision making as well.
Material and Methods
The study was conducted at our medical center between June 2012 and June 2013 under an Institutional Review Board–approved protocol with waiver of informed consent for prospective data collection in cases undergoing routine intraoperative TEE examinations for elective coronary artery bypass graft surgery. Specific inclusion criteria included normal intracardiac valves, absence of rhythm abnormalities, less than mild mitral regurgitation, less than 3.5 cm tricuspid annular diameter to ensure absence of tricuspid pathology, and normal function of left and right ventricles (>55% ejection fraction). Data from 26 consecutive patients were used for analysis.
All TEE examinations were conducted with an iE-33 ultrasound system with an X7–2t TEE probe (Philips Medical Systems, Andover, MA) after induction of general anesthesia and before the institution of cardiopulmonary bypass. Data were acquired during brief periods of apnea without electric interference or patient movement over 4 to 8 R-wave–gated cardiac cycles. Starting with the midesophageal four-chamber view for image acquisition, the TEE probe was positioned to include the entire tricuspid annulus in the sector boundaries. After satisfactory acquisition, echocardiographic data were exported to a Windows-based workstation equipped with Image Arena software (TomTec, Munich, Germany) for analysis. Four-dimensional Cardio-View, version 2.1 (TomTec), was used to access the data. Analysis was conducted at end-systolic and end-diastolic frames, defined by tricuspid closing and tricuspid opening, respectively.
In the four-dimensional Cardio-View interface, 3D images were viewed in sagittal, coronal, and transverse planes. Tricuspid valve was identified, and multiplanar reformatting was used to digitally mark opposing annular points in a series of 24 paired points, until the entire annulus was represented. Landmarks were added at septal, lateral, anterior, and posterior positions so that the anteroposterior (AP) and septolateral (SL) lines were perpendicular to each other. The Cartesian coordinates (x, y, and z coordinates) of the marked annular points were then exported to MATLAB (Mathworks, Natick, MA), where the TA for each patient was graphically visualized.
Within the MATLAB environment, the 3D distance was calculated between anterior and posterior points and labeled as the AP diameter. Similarly, the 3D distance between the septal and lateral points was calculated and labeled as the SL diameter. All data were processed using MATLAB code derived for this study from existing libraries.
Annulus Curve Fitting
A Fourier curve-fitting model was used to reconstruct the annulus. The natural periodicity of trigonometric functions in the Fourier series maps well with the closed-loop nature of the annulus. A fourth-order Fourier series was verified through higher-order tests for goodness of fit in this study and utilized [15]. Each dimensional value was isolated and fit individually using the Fourier method. The resulting coefficients were then used to interpolate values, through a Fourier reconstruction, producing a 100-point curve representing the annulus (Fig 1).
Fig 1.

Ultrasound points (asterisks) plotted with the respective radiologic landmarks (circle = septal; diamond=lateral; square = anterior; triangle = posterior) and axis (dotted line = septolateral; dashed line = anteroposterior). The centroid (stars) of the raw data points and the Fourier curve fit (solid line) are shown.
Geometric Analysis
The initial goals of geometric analyses were to identify the centroid and linear planar fit of the annular points. The centroid of the ring was determined by calculating the mean of each of the x, y, and z components of the annular points. A planar fit of the points was performed by using a first-order polynomial fit in both the x and y direction (Fig 2A) within MATLAB’s Curve Fitting Toolbox. Using the centroid as an offset and deriving planar angles from the polynomial fit, the annular points were translated and rotated to center the annulus at the origin with the valve plane coplanar with the x-y plane (Fig 2B). This alignment procedure enabled out-of-plane metrics to be easily calculated, and removed the offset bias considerations from the statistical analyses.
Fig 2.

(A) Tricuspid annulus points extracted from the ultrasound data at end diastole plotted with a three-dimensional planar fit. The fit was performed using least squares regression. This planar fit best represents the tricuspid valve plane. (B) Using the planar fit of the valve, the points and the plane are rotated so that the valve plane is oriented on the x-y plane. The perpendicular lines represent the distance of each point from the plane. The sum of squared error (SSE) was computed for the ultrasound points with respect to the valve plane. This total error quantifies the out-of-plane curvature for the annulus.
Description of Metrics
The curve fit was interrogated at two points in the cardiac cycle, end diastole (ED) or end systole (ES), to generate the desired annular and quadrant-based metrics. Annular metrics included Euclidean distance between phase centroids, change in the SL axis length, change in the AP axis length, sum of squared error (SSE) in the planar fit, and change in two-dimensional (2D) and 3D areas. The SSE of the plane indicates the curvature of the annulus out of the valve plane, and the 2D area is the projection of the valve opening on the valve plane [16]. These metrics seek to quantify the broad 3D behavior of the annulus.
The SL and AP axes demarcated quadrants of the annulus. Their crossing produced four regions as projected on the valve plane: anteroseptal (AS), anterolateral (AL), posteroseptal (PS), and posterolateral (PL) (Fig 3). Changes in the arc angle of the regions, maximum out-of-plane distance, change in 2D area for that quadrant, and change in 3D area were computed. The area calculations involved summing the integration of the curve fit projections on the respective planes; 3D utilized all orthogonal projections and 2D involved the x-y plane (valve plane) projection. By integrating between the respective landmarks, the areas for each quadrant were determined.
Fig 3.
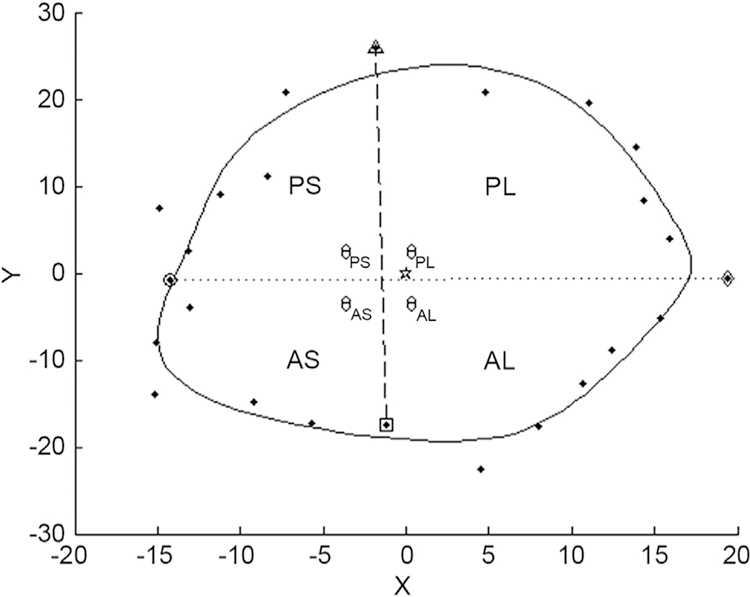
Two-dimensional projection of the valve data on the valve plane. The four quadrants—posteroseptal (PS), posterolateral (PL), anteroseptal (AS), and anterolateral (AL)—used for the metrics analysis are demarcated by the crossing of the septolateral and anteroposterior axis and are bounded radially by the curve fit for the points. The dotted line represents two-dimensional septolateral diameter whereas the dashed line represents the anteroposterior diameter. (θ = angle prescribed by each quadrant in its two-dimensional projection.)
Statistical Methods
Statistical analyses were performed on interphase datasets using the paired t test. Correlation hypotheses were tested with χ2 and product moment correlation coefficient methods. The use of both methods was valid because of the ambiguity of the underlying distribution and sparseness of the dataset because of small sample size [17]. For all statistical analyses, a probability threshold of p less than 0.05 was utilized. False negative (type II) sensitivity testing indicated that this was an appropriate threshold for the conclusions produced [18].
RECONSTRUCTION.
To reconstruct the valve using spatial coordinates obtained from Image Arena, data were imported in to SolidWorks software (Dassault Systemes, Paris, France). For clinical feasibility purposes, eight points at 45-degree intervals, including the four labeled as anterior, posterior, septal, and lateral in TomTec Image Arena, were selected. These points were then joined by a 3D spline curve, generating a smooth sketch representing the annulus at both end-systolic and end-diastolic frames. That yielded the 3D structure shown in Figure 4, which could be used to develop annuloplasty prostheses or assist in surgical planning by 3D printed models.
Fig 4.

Rendering of the SolidWorks reconstruction of the tricuspid annulus. The green annulus represents the end-systolic state, the red annulus represents the end-diastolic state. These models enable the reproduction of the annulus through additive manufacturing methods such as fused deposition modeling.
Results
In all, 26 patients were analyzed in the present study. Patient demographics are listed in Table 1.
Table 1.
Patient Characteristics
| Characteristics | Value |
|---|---|
| Number of patients | 26 |
| Sex | |
| Male | 16 |
| Female | 10 |
| Age, years | 67.1 ± 9.8 |
| Body surface area index | 1.98 ± 0.14 |
Area Changes and Perimeter
The TA demonstrated dynamic area and perimeter change during the cardiac cycle. The 3D perimeter and area, as well as projected 2D valve area, changed significantly (p < 0.05) between ES and ED. The global area changes were reflected in regional dynamism as well (Table 2). All quadrants, except AS, exhibited statistically significant change (Table 3). That was reflected in the 3D area change as well, with the AS quadrant maintaining its disconnection from other quadrants. Maximum dynamism was displayed by the AL quadrant, which demonstrated maximal area changes (2D and 3D; p < 0.001) as well as a statistically significant difference between ES and ED in the arc-angle prescribed by the quadrant. The AL was also noted to be the largest of the four quadrants, with PS being the smallest. The χ2 and product moment correlation coefficient analyses demonstrated significant (threshold 0.95) correlation between 2D and 3D area changes across all four quadrants.
Table 2.
Mean and Standard Deviation in Area and Perimeter at End Systole and End Diastole for Patients (n = 26)
| Measurement | End Systole |
End Diastole |
p Value |
|---|---|---|---|
| Global two-dimensional area, cm2 | 10.9 ± 2.2 | 12.1 ± 3.1 | 0.01 |
| Global three-dimensional area, cm2 | 11.2 ± 2.1 | 12.5 ± 3.1 | 0.01 |
| Three-dimensional perimeter, cm | 12.2 ± 0.99 | 12.8 ± 1.4 | 0.03 |
Values were compared using a paired t test for evaluating the extent of change in each variable between the two stipulated time frames.
Table 3.
Mean Change in Quadrant Measurements Between End Diastole and End Systole
| Quadrant | Angle (degrees) |
2D Area (mm2) |
3D Area (mm2) |
|||
|---|---|---|---|---|---|---|
| ED-ES Change | p Value | ED-ES Change | p Value | ED-ES Change | p Value | |
| Anteroseptal | 1.1 | 0.14 | 28.7 | 0.46 | 28.8 | 0.47 |
| Anterolateral | 5.5 | 0.008 | 143.9 | 0.0004 | 146.8 | 0.0003 |
| Posteroseptal | 3.1 | 0.37 | 70.0 | 0.005 | 69.4 | 0.001 |
| Posterolateral | 3.3 | 0.73 | 71.4 | 0.001 | 73.0 | 0.005 |
The p values were calculated using a paired t test for the end-diastolic (ED) and end-systolic (ES) values.
2D = two-dimensional; 3D = three-dimensional.
Vertical Descent
The mean Euclidean distance between systolic and diastolic annular centroids was 11.3 ± 3.7 mm (Table 4). Of the anterior, posterior, septal and lateral points, the lateral point demonstrated the greatest mean vertical translational motion (17.6 ± 5.4 mm), and the septal displayed the least (9.6 ± 2.8 mm) between ES and ED timeframes (Fig 5).
Table 4.
Interphase Metrics of Annulus Properties, Yielding Comparative Analysis Between End Diastole and End Systole
| Annulus Properties |
ED | ES | ED-ES Change |
p Value |
|---|---|---|---|---|
| Centroid distance, mm | … | … | 11.3 ± 3.7 | … |
| Anteroposterior diameter, mm | 41.1 ± 8.4 | 40.4 ± 7.8 | 0.7 | 0.57 |
| Septolateral diameter, mm | 40.9 ± 8.0 | 37.9 ± 4.9 | 3.0 | 0.017 |
| Sum of squared errors | 257.6 | 344.3 | −86.7 | 0.37 |
The p values calculated using a paired t test of the end-diastolic (ED) and end-systolic (ES) values. The centroid distance was not analyzed with the paired t test owing to the nonpaired nature of the metric.
Fig 5.

Tricuspid annulus points extracted from the ultrasound data for both endsystolic (ES) points (asterisks) and enddiastolic (ED) points (blue circles). The valve planes are indicated by the mesh grids for the respective annuli, brown for ES and blue for ED. The landmark points—septal (dotted green line), lateral (broken green line), anterior (dotted lavender line), and posterior (broken lavender line)—have been connected with indicator lines between ED and ES to illustrate the translation of these points. Pivoting of the valve about the septal landmark is indicated not only by the plane alignment, but also by the length of the respective indicator lines. The centroids for the respective valve annuli are also shown (blue star = ED centroid; black star = ES centroid), along with the translation-indicating line (red).
Axes of Dynamism
Analysis using a single-dimension angular offset around the hydraulic axis was performed to investigate a combination of 1,000 possible axes within the annulus to investigate significant expansion anywhere other than the echocardiographic measurements (AP and SL). However, we were unable to find any other annulus diameter that exhibited statistically significant change. Between the two axes used clinically, the SL axis demonstrated significant dynamism, as opposed to the AP.
Annular Shape
We did not find consistency in location of the high and low points of the annulus. Figure 6 shows the mean distribution of points occurring in a given quadrant across our sample. The PS quadrant was noted to be the most planar section of the annulus, with the AS quadrant being most “out of plane.” Overall, the SSE for the entire annulus showed a mean decrease of 86.7 (p = 0.37) between ED and ES.
Fig 6.

Illustration of the z-axis curve fit as a function of angular rotation about the z-axis. The quadrants in which the points lie are demarcated at the top: anteroseptal (AS); anterolateral (AL); posterolateral (PL); and posteroseptal (PS). In reference to the valve plane (dotted line), the points that are the furthest above and below the plan are marked. The quadrant that exhibits the most planarity is the PS quadrant; the sum of the distances from the valve plane is the least for this quadrant. (Asterisks = ultrasound points; circle = septal landmark; diamond = lateral landmark; square = anterior landmark; triangle = posterior landmark; right-pointing arrowhead = maximum point; left-pointing arrowhead = minimum point.)
Comment
Our study demonstrates the utility of high-resolution 3D echocardiographic data in dynamic analysis and reconstruction of the TA. Our results show that the TA undergoes numerous dynamics changes during the cardiac cycle. The annular dynamics are heterogeneous, with the AS quadrant undergoing the least and the AL quadrant showing the most change in area. Overall, the annular area is greater at end diastole than it is at end systole. We investigated whether the 2D area change was a true expansion or a representation of the conformational change in shape, resulting from a straightening action of the annulus during diastole. Although SSE (our metric for tortuosity) decreased as 2D area increased, this correlation was not statistically significant, namely, the expansion of the annulus did not result in significant reduction of curvature. That was confirmed with the product moment correlation coefficient statistical analysis indicating strong positive correlation between the increase in both 2D and 3D areas. These findings imply that the annulus undergoes true expansion, leading to an increase in orifice area during diastole.
In terms of shape, it appears that the TA is a complex multiplanar structure with annular high and low points. In contrast to the MA shape, the considerable variation in the location of these high and low points throughout the cardiac cycle is suggestive of a complex, flexible shape. However, in our probability analysis, the AS quadrant, which is close to the RV outflow tract, was the most nonplanar section of the annulus, with the highest probability of containing the annular high point.
The TA moves vertically over the course of the cardiac cycle, reaching a nadir at end systole and ascending during diastole. The maximum vertical excursion at lateral and minimum at septal landmarks, respectively, point to a rotation of the annular plane, with the septal point acting as a hinge. We also used distance between annular centroids as a tool to measure the extent of vertical motion in normal valves. Finally, we were able to describe a clinically feasible method to reconstruct individual annuli with a degree of precision that allows for an improved appreciation of the spatial structure and orientation of the annulus.
Our study confirms earlier descriptions of multiplanar shape of the TA, suggesting the need for a different approach to annuloplasty ring design as compared with the mitral annulus [19]. Our area measurements at end systole and end diastole, while different in absolute values reported, conform to the notion that the annulus enlarges during diastole. The heterogeneous nature of the TA in this study is also in line with earlier reports implying greater flexibility of the annulus toward the free wall of the right ventricle, with the AS quadrant being the most fixed portion of the annulus [11, 20].
To describe the anatomy of the TA, we sought to devise new metrics, which are derived from clinical echocardiographic data and hence can be helpful during clinical decision making as well. That is especially important as the TA has an irregular shape and there remains a need for a system to describe and track this shape to classify the TV as normal or abnormal. Based on the correlation between TA remodeling and RV dysfunction, an accurate description of the shape and size of the TA has received significant attention [12, 21]. The TR encountered during MV surgery is most commonly due to chronically elevated pulmonary artery pressure and is functional in nature [22]. Progressive RV dilation leads to tricuspid annular dilation/flattening with eventual leaflet malcoaptation and resultant TR [23]. Therefore, the degree of TA remodeling can be used as surrogate marker of RV dysfunction, or vice versa [21]. The TA dilation has also been postulated as an early sign of RV dysfunction, while it is still reversible [2]. Therefore, there is a need to develop tools that can track and detect changes in TA geometry that correlate with later occurrence of TA dilation, TR, and eventually, RV dysfunction.
Although our group has previously published an analysis of tricuspid annuli derived from 3D echocardiographic data, the present study employs a more rigorous and robust approach to normal tricuspid geometric analysis. The precise geometry described in this study could be helpful in aiding annuloplasty ring design. In that respect, this is one of few analyses derived from invivo 3D echocardiographic imaging of human TA. Our study highlights the need for TA analysis that is nonmitral centric, given the significant physiologic and anatomic differences between the two sides of the heart. With irregular expansion and dilation along multiple axes, the TA should not be assumed to have consistent 3D conformations such as nonplanarity. Therefore, the optimal design for tricuspid annuloplasty needs to be based on tricuspid-specific analyses, such as this study. Further studies are needed, perhaps with larger sample sizes, to confirm whether there exists a relatively replicable 3D shape among tricuspid annuli on which a ring can be modeled.
We can identify several limitations to our study. Our sample size is small, but we used a well-established methodology of tracking annular geometry and used a rigorous analytical model to draw our results and conclusions. The motion of the entire heart and diaphragm could confound the measurement of translational motion of during breathing. However, data were collected over single beats during periods of apnea to minimize this error. We also did not observe the biphasic area changes in TA as noted in some other studies. That may be attributable to our use of ES and ED timeframes alone.
In conclusion, the TA is a complex 3D structure with irregular geometry. Tricuspid annuloplasty device design requires a multiplanar approach to ensure optimal coaptation and competence in line with normal TV structure and function. There remains a need to devise clinically relevant metrics that can be used to detect early changes in TA geometry and size, which in turn can accurately predict TR and RV dysfunction in patients.
Acknowledgments
The authors thank the Ronald M. Weintraub, MD, Family Research Fund for its support.
Abbreviations and Acronyms
- AL
anterolateral
- AP
anteroposterior
- AS
anteroseptal
- ED
end diastole
- ES
end systole
- MV
mitral valve
- PL
posterolatera
- PS
posterosepta
- RV
right ventricular
- SL
septolateral
- SSE
sum of squared error
- TA
tricuspid annulus
- TEE
transesophageal echocardiography
- TR
tricuspid regurgitation
- 2D
two-dimensional
- 3D
three-dimensiona
References
- 1.Nath J, Foster E, Heidenreich PA. Impact of tricuspid regurgitation on long-term survival. J Am Coll Cardiol 2004;43:405–9. [DOI] [PubMed] [Google Scholar]
- 2.Benedetto U, Melina G, Angeloni E, et al. Prophylactic tricuspid annuloplasty in patients with dilated tricuspid annulus undergoing mitral valve surgery. J Thorac Cardiovasc Surg 2012;143:632–8. [DOI] [PubMed] [Google Scholar]
- 3.Desai RR, Abello LMV, Klein AL, et al. Tricuspid regurgitation and right ventricular function after mitral valve surgery with or without concomitant tricuspid valve procedure. J Thorac Cardiovasc Surg 2013;146:1126–32. [DOI] [PMC free article] [PubMed] [Google Scholar]
- 4.Braunwald NS, Ross J, Morrow AG. Conservative management of tricuspid regurgitation in patients undergoing mitral valve replacement. Circulation 1967;35(Suppl):I63–9. [DOI] [PubMed] [Google Scholar]
- 5.Duran CM, Pomar JL, Colman T, Figueroa A, Revuelta JM, Ubago JL. Is tricuspid valve repair necessary? J Thorac Cardiovasc Surg 1980;80:849–60. [PubMed] [Google Scholar]
- 6.Groves PH, Ikram S, Ingold U, Hall RJ. Tricuspid regurgitation following mitral valve replacement: an echocardiographic study. J Heart Valve Dis 1993;2:273–8. [PubMed] [Google Scholar]
- 7.Pfannmueller B, Verevkin A, Borger MA, et al. Role of tricuspid valve repair for moderate tricuspid regurgitation during minimally invasive mitral valve surgery. Thorac Cardiovasc Surg 2013;61:386–91. [DOI] [PubMed] [Google Scholar]
- 8.Van de Veire NR, Braun J, Delgado V, et al. Tricuspid annuloplasty prevents right ventricular dilatation and progression of tricuspid regurgitation in patients with tricuspid annular dilatation undergoing mitral valve repair. J Thorac Cardiovasc Surg 2011;141:1431–9. [DOI] [PubMed] [Google Scholar]
- 9.Dreyfus GD, Corbi PJ, Chan KMJ, Bahrami T. Secondary tricuspid regurgitation or dilatation: which should be the criteria for surgical repair? Ann Thorac Surg 2005;79:127–32. [DOI] [PubMed] [Google Scholar]
- 10.Porter A, Shapira Y, Wurzel M, et al. Tricuspid regurgitation late after mitral valve replacement: clinical and echocardiographic evaluation. J Heart Valve Dis 1999;8:57–62. [PubMed] [Google Scholar]
- 11.Fawzy H, Fukamachi K, Mazer CD, et al. Complete mapping of the tricuspid valve apparatus using three-dimensional sonomicrometry. J Thorac Cardiovasc Surg 2011;141:1037–43. [DOI] [PubMed] [Google Scholar]
- 12.Park Y-H, Song J-M, Lee E-Y, Kim Y-J, Kang D-H, Song J-K. Geometric and hemodynamic determinants of functional tricuspid regurgitation: a real-time three-dimensional echocardiography study. Int J Cardiol 2008;124:160–5. [DOI] [PubMed] [Google Scholar]
- 13.Mahmood F, Kim H, Chaudary B, et al. Tricuspid annular geometry: a three-dimensional transesophageal echocardiographic study. J Cardiothorac Vasc Anesth 2013;27:639–46. [DOI] [PMC free article] [PubMed] [Google Scholar]
- 14.Maffessanti F, Gripari P, Pontone G, et al. Three-dimensional dynamic assessment of tricuspid and mitral annuli using cardiovascular magnetic resonance. Eur Heart J Cardiovasc Imaging 2013;14:986–95. [DOI] [PubMed] [Google Scholar]
- 15.Legget ME, Bashein G, McDonald JA, et al. Three-dimensional measurement of the mitral annulus by multiplane transesophageal echocardiography: in vitro validation and in vivo demonstration. J Am Soc Echocardiogr 1998;11:188–200. [DOI] [PubMed] [Google Scholar]
- 16.Kaplan SR, Bashein G, Sheehan FH, et al. Three-dimensional echocardiographic assessment of annular shape changes in the normal and regurgitant mitral valve. Am Heart J 2000;139:378–87. [DOI] [PubMed] [Google Scholar]
- 17.Lee Rodgers J, Nicewander WA. Thirteen ways to look at the correlation coefficient. Am Stat 1988;42:59–66. [Google Scholar]
- 18.Sawilowsky SS, Blair RC. A more realistic look at the robustness and type II error properties of the t test to departures from population normality. Psychol Bull 1992;111:352–60. [Google Scholar]
- 19.Fukuda S, Saracino G, Matsumura Y, et al. Three-dimensional geometry of the tricuspid annulus in healthy subjects and in patients with functional tricuspid regurgitation: a realtime, 3-dimensional echocardiographic study. Circulation 2006;114(Suppl):I492–8. [DOI] [PubMed] [Google Scholar]
- 20.Hiro M, Jouan J, Pagel M, Duran C. Sonomicrometric study of the normal tricuspid valve annulus in sheep. J Heart Valve Dis 2004;13:452–60. [PubMed] [Google Scholar]
- 21.Song J-M, Jang M-K, Kim Y-J, Kim D-H, Kang D-H, Song J-K. Right ventricular remodeling determines tricuspid valve geometry and the severity of functional tricuspid regurgitation: a real-time 3-dimensional echocardiography study. Korean Circ J 2010;40:448–53. [DOI] [PMC free article] [PubMed] [Google Scholar]
- 22.Mutlak D, Aronson D, Lessick J, Reisner SA, Dabbah S, Agmon Y. Functional tricuspid regurgitation in patients with pulmonary hypertension: is pulmonary artery pressure the only determinant of regurgitation severity? Chest 2009;135:115–21. [DOI] [PubMed] [Google Scholar]
- 23.Abello LMV, Klein AL, Marwick TH, et al. Understanding right ventricular dysfunction and functional tricuspid regurgitation accompanying mitral valve disease. J Thorac Cardiovasc Surg 2013;145:1234–5. [DOI] [PubMed] [Google Scholar]