

Abstract
Natural selection driven by water availability has resulted in considerable variation for traits associated with drought tolerance and leaf‐level water‐use efficiency (WUE). In Arabidopsis, little is known about the variation of whole‐plant water use (PWU) and whole‐plant WUE (transpiration efficiency). To investigate the genetic basis of PWU, we developed a novel proxy trait by combining flowering time and rosette water use to estimate lifetime PWU. We validated its usefulness for large‐scale screening of mapping populations in a subset of ecotypes. This parameter subsequently facilitated the screening of water use and drought tolerance traits in a recombinant inbred line population derived from two Arabidopsis accessions with distinct water‐use strategies, namely, C24 (low PWU) and Col‐0 (high PWU). Subsequent quantitative trait loci mapping and validation through near‐isogenic lines identified two causal quantitative trait loci, which showed that a combination of weak and nonfunctional alleles of the FRIGIDA (FRI) and FLOWERING LOCUS C (FLC) genes substantially reduced plant water use due to their control of flowering time. Crucially, we observed that reducing flowering time and consequently water use did not penalize reproductive performance, as such water productivity (seed produced per unit of water transpired) improved. Natural polymorphisms of FRI and FLC have previously been elucidated as key determinants of natural variation in intrinsic WUE (δ13C). However, in the genetic backgrounds tested here, drought tolerance traits, stomatal conductance, δ13C. and rosette water use were independent of allelic variation at FRI and FLC, suggesting that flowering is critical in determining lifetime PWU but not always leaf‐level traits.
Keywords: Arabidopsis, drought tolerance, flowering time, plant phenotyping, quantitative trait loci (QTL), water productivity, water use, water‐use efficiency
Short abstract
Accelerated flowering time achieved through nonfunctional and weak alleles of flowering time genes FRIGIDA (FRI) and FLOWERING LOCUS C (FLC) reduce water use in Arabidopsis thaliana without detrimentally impacting reproductive output.
1. INTRODUCTION
Water availability is essential for the optimal allocation of resources to achieve maximal growth and reproductive fitness (Anderson, 2016). Consequently, a water deficit may force survival trade‐off costs resulting in reduced reproductive fitness (Sletvold & Ågren, 2015; Von Euler, Ågren, & Ehrlén, 2014). In natural populations, adaptations to water deficits encompass several unique ecological strategies that include drought escape and avoidance leading to drought resistance. Although drought escape is characterized by rapid growth and early flowering to reproduce before the onset of terminal drought, avoidance limits growth during periods of dehydration through lowering stomatal conductance and transpiration (Ludlow 1989; Kooyers, 2015). Drought resistance traits, characterized by the ability to survive a water deficit, have traditionally been used to assess plant performance under reduced water availability. However, the usefulness of drought resistance as a trait to optimize plant productivity has been questioned, as the improvement of various drought resistance‐related traits has been demonstrated to reduce productivity under some circumstances, regardless of the ability of plants to survive the period of drought stress (Blum, 2005, 2009; Passioura, 2007). It is widely accepted that drought resistance facilitates plant survival, but it does not contribute towards the maintenance of yield following drought stress or in water replete conditions (Blum, 2005, 2009; Passioura, 2007). The identification of plant varieties that are able to produce stabilized or improved yields with reduced water inputs is therefore an important goal for plant breeders, physiologists, and molecular biologists alike (Morison, Baker, Mullineaux, & Davies, 2008; Parry, Flexas, & Medrano, 2005).
Water‐use efficiency (WUE) at the leaf level is the net amount of CO2 fixed per unit of transpired water, hereafter referred to as instantaneous water‐use efficiency (WUE i, A/E) (Condon, Richards, Rebetzke, & Farquhar, 2004; Table 1). It relates equally to water loss by transpiration and net carbon gain achieved via gas exchange (Long, Marshall‐Colon, & Zhu, 2015). Alternatively, carbon isotope composition (δ13C; Table 1), as an estimator of intrinsic WUE, that is the ratio of net CO2 assimilation to stomatal conductance for water vapour (A/g s; Farquhar & Von Caemmerer, 1982; Farquhar, Ehleringer, & Hubick, 1989), is regularly used to describe integrated leaf‐level intrinsic WUE and have been targeted in several studies as a primary trait to achieve “more crop per drop” as well as enhancing drought resistance (Blum, 2009; Morison et al., 2008).
Table 1.
Glossary of water use efficiency and water use parameters
| Parameter | Abbreviation | Calculations | |
|---|---|---|---|
| Carbon isotope composition | δ13C |
|
|
| Instantaneous leaf‐level water use efficiency | WUEi |
|
|
| Absolute vegetative (rosette) water use | VWU |
slope 1 of linear regression |
|
| Calculated plant water use | cPWU | VWU * days of flowering | |
| Measured plant water use | mPWU | ∑daily added water | |
| Mean daily water use | ‐ | average of daily added water over the life time of the plant | |
| Water productivity calculated or measured | cWP/mWP |
|
|
| Transpiration efficiency calculated or measured | cTE/mTE |
|
|
| Dehydration plasticity (VWU plasticity) | DP | segmented regression |
Abbreviations: A: carbon assimilation; C: carbon; cPWU: calculated lifetime plant water use E: evaporation; mPWU: measured plant water use; rSWC: relative soil water content; VWU: vegetative water use; WUE: water‐use efficiency.
The value of leaf‐level WUE estimates for improving crop yield has previously been questioned. For example, it has been shown that despite the association between δ13C and WUE in many species (Farquhar et al., 1989), its relation to yield across multiple environments and genotypes is often variable (Condon et al., 2004). This suggests that both additional intrinsic plant factors, as well as environmental conditions, impact the relationship between intrinsic WUE and agronomic WUE, that is, the amount of yield produced per unit of water transpired. Therefore, leaf‐level intrinsic WUE estimates may not be a useful proxy to select for yield under water limited conditions. This lack of consistent upscaling from leaf‐ to whole‐plant WUEs may be a product of the heterogeneity of net CO2 assimilation rates within and across individual photosynthetic organs or it may also be due in part to the lack of integration of night‐time transpiration and plant respiration rates in leaf‐level WUE measurements (reviewed in Cernusak, Winter, & Turner, 2009; Cernusak et al., 2013). Furthermore, this inconsistency may be related to changes in environmental conditions leading to variations in other processes that affect CO2 supply and demand (Medrano et al., 2015; Seibt, Rajabi, Griffiths, & Berry, 2008). In addition, discrepancies may occur due to genotypic variation in carbon isotope signatures of crop plants being often driven by variation in stomatal conductance (Blum, 2005; Marguerit et al., 2014; Monclus et al., 2006; Monneveux, Sánchez, Beck, & Edmeades, 2006), thereby limiting carbon assimilation and productivity. It should be noted, however, that in some species, variation in δ13C has also been attributed to variation in carbon fixation as well as stomatal conductance (Brendel et al., 2008; Donovan, Dudley, Rosenthal, & Ludwig, 2007; Masle, Gilmore, & Farquhar, 2005).
Investigating the natural variation in whole‐plant WUE and the mechanisms of drought resistance in natural populations is challenging, due to difficulties in recreating realistic drought conditions in an experimental setting. For example, in short‐dehydration experiments (Bechtold et al., 2010, 2016; Ferguson, Humphry, Lawson, Brendel, & Bechtold, 2018), water loss is greater in larger plants creating substantial heterogeneity in the timing of water deficits (Kooyers, 2015). Although plant size greatly contributes to water loss in Arabidopsis, drought response traits are independent of the transpiring leaf surface (Ferguson et al., 2018). This suggests that above ground biomass impacts water use and consequently whole‐plant WUE but not necessarily drought tolerance. Central to the determination of whole‐plant WUEs, such as transpiration efficiency (TE, here ratio between aboveground biomass and transpired water; Table 1) or water productivity (WP, here ratio between seed biomass and transpired water; Table 1), is the quantification of water lost by the plant. We have previously shown that leaf‐level WUE is not representative of absolute vegetative (rosette) water use (VWU), or biomass production (Ferguson et al., 2018), as the transpiring leaf surface is a major upscaling factor. Additionally, we have demonstrated in a few selected ecotypes that differences in life‐time plant water use (PWU; Table 1) and plant‐level WUE (TE and WP) exist (Bechtold et al., 2010); however, little is known about the underlying molecular mechanisms of the variation in PWU and TE/WP. In Arabidopsis, the measurement of lifetime PWU has received little attention, mainly due to the difficult and time‐consuming nature of manually phenotyping PWU on a daily basis for the majority of the lifetime of the plant (Bechtold et al., 2010, 2013). As plants begin to develop stalks and flowers, automated watering systems (Granier & Tardieu, 2009; Tisné et al., 2013) would cause considerable disturbance of the tall structures. Conversely, nonconveyor belt platforms (Halperin, Gebremedhin, Wallach, & Moshelion, 2017) or a manual approach involving careful handling of flowering plants limits the potential for harmful effects occurring due to movement and touch induced changes (Van Aken et al., 2016). From limited studies of this nature, the C24 ecotype has emerged as drought tolerant and highly water use efficient (Bechtold et al., 2010); additionally, it demonstrates resistance to numerous abiotic and biotic perturbations (Brosché et al., 2010; Lapin, Meyer, Takahashi, Bechtold, & Van den Ackerveken, 2012; Lapin et al., 2012; Xu et al., 2015; Bechtold, Ferguson, & Mullineaux, 2018).
Our recent study of 35 Arabidopsis ecotypes confirmed the above‐described uniqueness of C24 in uniting several desirable water use and drought response traits (Ferguson et al., 2018). To build upon these findings, we set out to ascertain whether PWU of C24 was reduced compared to other ecotypes and whether this had a heritable and genetically discernible basis. We therefore employed a C24 × Col‐0 recombinant inbred line (RIL) population (Törjék et al., 2006) to identify QTLs that underlie the natural variation of these traits. However, due to the difficulties of manually phenotyping PWU, development of a suitable proxy trait was required to phenotype the mapping population in a high‐throughput manner. Arabidopsis represents an ideal system through which to develop and evaluate the usefulness of proxy traits, such as WUEi, δ13C, flowering time, VWU, and biomass parameters for predicting PWU and whole‐plant WUEs. To this end, we assessed the usefulness of this suite of traits for acting as proxies to predict whole‐plant WUEs (TE and WP; see Table 1) in a set of 12 summer annual ecotypes. A highly accurate proxy trait was subsequently identified and employed in a forward genetic screen for whole‐ PWU traits.
2. MATERIALS AND METHODS
2.1. Plant material and plant growth
A selection of 12 facultative summer annual Arabidopsis thaliana (Arabidopsis) ecotypes (Table S1) and 164 RILs derived from a cross between ecotypes Col‐0 and C24 (Törjék et al., 2006) was employed to assess the natural variation of long‐term PWU. The genetic map and genotype information for the RIL population are as described in Törjék et al., 2006 (Table S2). The Col‐0 × C24 RIL mapping population was used to identify QTL relating to key traits associated with water use. Detected QTL regions of interest were further investigated using near‐isogenic lines (NILs) that captured Col‐0 alleles in a homogenous C24 genomic background and vice versa (Törjék et al., 2008). The ecotypes, RILs, and NILs were phenotyped for water use (VWU and PWU), flowering time, and above ground biomass parameters. Additionally, the 12 ecotypes and NILs were phenotyped for δ13C (Figure 1).
Figure 1.
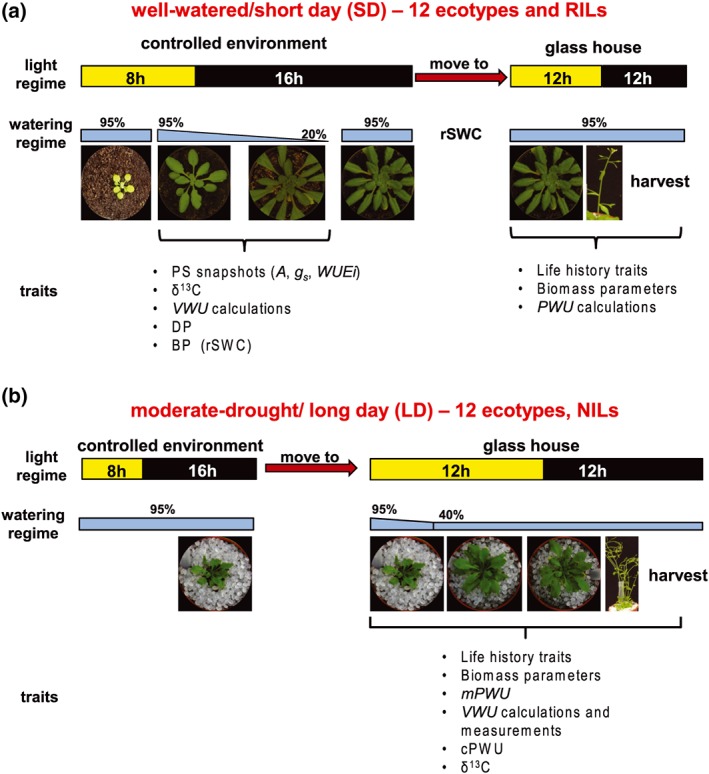
Overview of growth conditions and watering experiments. (a) Short‐dehydration experiment carried out on 12 ecotypes and the RIL population. Plants were grown for most of their lifespan under short‐day (65 days) and well‐watered conditions with a short‐dehydration period to assess plant water use and drought sensitivity (b) Continuous maintenance of moderate drought experiment carried out on 12 ecotypes and near‐isogenic lines (NILs). Plants were grown for most of their lifespan under long‐day and moderate drought conditions (40% rSWC; Bechtold et al., 2013, 2010). VWU: vegetative water use; PWU: lifetime plant water‐use; DP: dehydration plasticity. See Table 1 for glossary of terms
Plants were sown in peat‐based compost (Levington F2 + S, The Scotts Company, Ipswich, UK.) and stratified at 4°C in darkness for 4 days. After stratification plants were grown in a growth chamber at 23°C under short‐day (SD; 8 hr:16 hr; light:dark) conditions, under a photosynthetically active photon flux density of 150 ± 20 μmol · m−2 · s−1 and at 65% relative humidity (VPD of 1 kPa, Figure 1). Plants were transferred to the glasshouse at distinct stages depending on the applied watering regime (see below and Figure 1). Within the glasshouse, the environmental conditions were variable, as temperature and external light cycles fluctuated during the experimental periods. Supplemental lighting was maintained at a minimum photosynthetically active photon flux density threshold of ~200 μmol · m−2 · s−1 at plant level for a 12‐hr day (long‐day [LD] conditions). Plants were watered according to the different watering regimes (see Figure 1), and their positions within the two growth environments (SD and LD) were changed daily. In this study, we deliberately opted for transitions between SD and LD conditions (growth chamber to glasshouse) without a vernalization period, which resulted in delayed flowering compared to some studies. This decision was taken as physiological measurements (snapshot measurements for WUEi) required a minimal rosette size that would normally not be achieved in vernalized plants.
2.2. Watering regimes
2.2.1. Short‐term dehydration experiment for the determination of VWU
All lines undergoing a short‐dehydration experiment were grown in the growth chamber in 6‐cm diameter (0.11 L) pots for the determination of VWU as described in Ferguson et al. (2018). Briefly, at 50‐day postsowing, plants were left to progressively dry to 20% relative soil water content (rSWC), at which point they were rewatered and transferred from the controlled environment room to the glasshouse for flowering time determination and seed production. VWU was calculated as the slope of the linear regression of the rate of drying from 95% to 20% rSWC (lasting between 10 and 12 days; Figure 1a and Table 1). Plants were transferred to the glasshouse after rewatering and maintained well‐watered to determine flowering time and the number of rosette leaves at bud initiation. Plant biomass components were separated and measured as rosette biomass (vegetative biomass), chaff biomass (stalks and pods; reproductive biomass), and seed yield (reproductive biomass), and the sum of all biomass components produced the total above ground biomass value. PWU was calculated as VWU multiplied by the time it took from germination to flowering to generate calculated lifetime PWU (cPWU; Table 1). WP was calculated as seed biomass divided by either calculated or measured lifetime water use (cWP or mWP, Table 1). This watering regime is designated as SD, as plants spend most of their life time under SD conditions (~65 days).
2.2.2. Continuous maintenance of moderate drought for determination of lifetime PWU
For the determination of PWU, 8‐cm diameter (0.3 L) pots were filled with the same volume of soil following the experimental setup as described in Bechtold et al. (2010). The soil surface was covered with 0.4‐cm diameter polypropylene granules to limit soil evapotranspiration. Plants were germinated in the previously described growth chamber before being transplanted into individual pots 12 days after sowing at the initiation of the rosette growth stage (Boyes et al., 2001). Four days after being transferred into individual pots, plants were moved into the glasshouse, where pots were weighed daily (Kern PCB, 350‐3 balance) to determine and maintain the pots at a moderate drought level of 40% rSWC (Bechtold et al., 2010). Daily water use was recorded after plants were transferred into the glass house. Control pots without plants were also measured daily to estimate evaporation from the soil surface. Estimates of PWU were corrected to take account of soil evaporation. Flowering time and number of leaves at bud initiation were recorded, and once the final flower had opened, watering ceased, and plants were bagged for harvesting. During harvest the vegetative (rosette) and reproductive (stalks, pods, and seeds) biomass components were separated. Measured PWU (mPWU) was determined as the sum of water added every day until bagging minus the water lost through evaporation from control pots. This parameter is also termed mPWU in order to distinguish it from cPWU (Table 1). This watering regime is denoted as LD, as plants only spend 16 days from germination under SD conditions; the remaining time plants were grown under LD conditions (Figure 1b).
2.3. Estimating drought sensitivity
For analysing in more detail the data used for calculating VWU, we applied the Davies test (Davies, 2002) and segmented regression analysis as part of the segmented package in R (Muggeo, 2017) in order to test (a) for a significant difference in slope parameter and (b) for the breakpoint in the regression. This analysis produced the breakpoint in the drying period and the slopes before (stage 1) and after (stage 2) the breakpoint. VWU plasticity was calculated as the slope before the breakpoint (stage1; supposed to represent transpiration under control conditions) − slope after breakpoint (stage2; supposed to represent transpiration under drought conditions)/slope before breakpoint (stage1). Both breakpoint (in terms of rSWC) and VWU plasticity were used to estimate the drought sensitivity (DS) as per Ferguson et al. (2018).
2.4. Physiological measurements
2.4.1. Photosynthetic rate (snapshot measurements) in the short‐dehydration experiment
Instantaneous measurements of net CO2 assimilation rate (A) and stomatal conductance to water vapour (gs) and transpiration rate (E) were taken on leaf 7, using an open gas exchange system (PP Systems, Amesbury, MA, USA). Leaves were placed in the cuvette at ambient CO2 concentration (Ca) of 400 μmol/mol, leaf temperature was maintained at 22 ± 2°C and vapour pressure deficit was approximately 1 kPa, and irradiance was set to growth conditions (150 μmol · m−2 · s−1). A reading was recorded after the IRGA conditions had stabilized (approximately 1.5 min), but before the leaf responded to the new environment (Parsons, Weyers, Lawson, & Godber, 1997). WUEi was estimated as A/E.
2.4.2. Delta carbon 13 analysis
The carbon isotope composition (δ13C) of bulk leaf material was assessed for the 12 ecotypes comprising the SD experiment (well‐watered samples) and the NILs and parental lines from the continuous moderate drought experiment. The harvested leaves had developed during moderate drought stress (40% rSWC). δ 13 C was measured as described in Roussel et al. (2009) and Ferguson et al. (2018). δ 13 C was calculated as (R s − R b)/R b × 1000, where R s and R b represent the 13C/12C ratio in the samples and in the Vienna Pee Dee Belemnite standard, respectively (Craig, 1957).
2.5. Statistical analysis
All statistical analyses were performed within the R software environment for statistical computing and graphics (R Core Team, 2015). Experiments using the RIL population were performed across several blocks over a period of 2 years. Each temporally divided block contained the two parental ecotypes and between 20 and 40 RILs. One‐way analysis of variance (ANOVA) comparison of means tests were performed across all lines and all blocks to determine the existence of experimental block effects that could potentially confound further analysis and the QTL mapping. Best linear unbiased predictors (BLUPs) were extracted using the following general linear mixed model: Y = E + B + Residual (Error) variance, where Y represents the phenotypic trait parameter of interest and both E (Ecotype) and B (Experimental block) are treated as random effects, while controlling for fixed effects, that is, "temporal block effects (Lynch & Walsh, 1998). Predicted means were obtained for each trait and for each RIL by adding the appropriate BLUP value to the population mean. Predicted means were employed for all subsequent analyses involving the RILs and for QTL mapping. The general linear mixed models allowed for the determination of phenotypic (V P) and genotypic (V G) variation for all trait parameters. These parameters were used to obtain estimates of broad sense heritability (H 2) as V G/V P.
2.6. QTL Mapping
We mapped for QTLs underlying all assessed parameters using the qtl R package (Broman & Shen, 2009; Broman, Wu, Sen, & Churchill, 2003). The Lander‐Green algorithm (Lander & Green, 1991), that is, the hidden Markov model technology, was used to reestimate the genetic map using the Kosambi map function to convert genetic distance into recombination fractions with an assumed genotyping error rate of 0.0001. The reestimated genetic map, based on the lines incorporated in this study, was preferred to the original genetic map, which was based on over 400 RILs. The hidden Markov model technology and Kosambi map function were further employed to calculate the probabilities of true underlying genotypes at pseudo‐marker points between actual markers based on observed multipoint marker data, while allowing for the same rate of genotyping errors. Genotypes were calculated at a maximum distance of 2 cM between positions.
Multiple QTL mapping (MQM) was performed using the predicted means derived from BLUPs. The best multiple QTL models were fitted via the multiple imputation approach, using genotype probabilities at both genetic markers and calculated pseudo‐markers. This is the most appropriate method for fitting multiple QTL models, especially when maker density is not especially high (average inter‐marker distance here: 3.87 cM; Broman & Sen, 2009).
About 10 000 permutations were used to determine logarithm of the odd (LOD) significant thresholds for incorporating both additive QTL and epistatic interactions at an experiment‐wise α = 0.05. Automated stepwise model selection was performed (Manichaikul, Moon, Sen, Yandell, & Broman, 2009). The penalties for the stepwise model selection were derived from a two‐dimensional genome scan. Finally, the positions of detected QTLs were refined, and the model was fitted with ANOVA to calculate the effect size, percentage variance explained, and the LOD score for each QTL. Interval estimates of all detected QTLs were obtained as 95% Bayesian credible intervals.
Following MQM, the log10 ratio comparing the full QTL model and the single QTL model from the two‐dimensional genome scan was directly assessed to test for the presence of an epistatic interaction between the two main effect QTL for cPWU (Broman & Sen 2009).
To determine whether flowering time, vegetative biomass, or VWU were confounding the results of QTL mapping for cPWU, we performed standard interval mapping to detect QTL for cPWU fitted with multiple imputation and whilst independently including these three traits as covariates in the interval mapping model. This was achieved using the scanone() function within R‐qtl, where the trait covariate, that is, flowering time, vegetative biomass, or VWU, was defined using the “intcovar” argument. About 10 000 permutations were performed to determine the LOD threshold for significance at the 5% level (Broman & Sen 2009). If either of the covariate traits reduced the LOD score, or eliminated the significance, of any of the cPWU QTL, this was interpreted as a confounding effect of that covariate trait on cPWU, such that that QTL could not be described as acting on cPWU in a manner independent of the covariate trait.
2.7. Genotyping using insertion‐deletion markers
Insertion‐deletion (InDel) marker polymorphic between Col‐0 and C24 alleles of FRI and FLC were obtained to address the hypothesis that these genes underlie the two major QTLs detected. A 16‐bp deletion in the Col‐0 allele of FRI was scored using primers developed by Johanson et al. (2000). A 30‐bp deletion in the Col‐0 allele of FLC was scored using primers developed by Gazzani, Gendall, Lister, and Dean (2003). InDel markers with a single polymerase chain reaction (PCR) band for both InDels (Figure S1a and Table S3) were assayed by quantitative PCR (qPCR) and high‐resolution melting genotyping using the CFX96 Touch Real‐Time PCR Detection System (BIO‐RAD). This information for 138 individuals of the RIL population and both parents was subsequently integrated into the reestimated genetic map (Figure S1b and Table S4).
2.8. Analysis of publicly available RNAseq and microarray datasets
Publicly available RNAseq (Xu et al., 2015; GSE61542) and microarray datasets of C24 and Col‐0 (Bechtold et al., 2010, E‐MEXP‐2732) were analysed for differentially expressed genes. These datasets were compared with the protein coding genes within mapping intervals using VENNY (Oliveros, 2007).
2.9. RNA extraction and gene expression analysis by qPCR
Leaves of a minimum of four biological replicates were harvested from the NILs and both parental lines at 26= and 43‐day postgermination and frozen in liquid nitrogen. Total RNA was extracted using Tri‐reagent (SIGMA, Aldrich, UK) according to the manufacturer's instructions. For cDNA synthesis, 1 μg of total RNA was treated with RNase‐free DNase (Ambion) according to manufacturer's instructions and reverse transcribed as previously described (Bechtold et al., 2008). Quantitative real‐time PCR was performed using a cybergreen fluorescence based assay as described previously (Bechtold et al., 2008). Gene‐specific cDNA amounts were calculated from threshold cycle (Ct) values and expressed relative to controls and normalized with respect to Actin and Cyclophilin cDNA according to Gruber, Falkner, Dorner, and Hämmerle (2001). To calculate the standard error of the calculated ratios of fold differences for gene expression data, the errors of individual means were combined “in quadrature,” and the final ratio was a combination of the error of the two‐different means of the NILs and Col‐0 samples. The primers used for RT‐qPCR can be found in Table S3.
3. RESULTS
We used a selection of 12 facultative summer annual ecotypes of Arabidopsis that previously demonstrated variation for DS and water use associated traits (Table S1; Ferguson et al., 2018), as well as a RIL mapping population and associated NILs (BC4F3‐4) to examine natural variation of PWU and above ground biomass allocation (Tables S2 and 5). The assessment of natural variation for VWU, PWU, biomass accumulation, and DS was followed by QTL mapping to establish the genetic basis of these traits. Two experimental setups were used as part of this study: (a) 12 ecotypes and RILs—a short‐dehydration experiment under predominantly SD conditions to measure a range of leaf‐level WUE parameters (WUEi, δ13C), VWU, flowering time, biomass parameters, and DS (Figure 1a; Ferguson et al., 2018) and (b) 12 ecotypes and NILs—a continuous moderate drought experiment under predominantly LD conditions, during which rSWC was maintained at moderate drought levels (~40% rSWC) to measure leaf‐level WUE parameters (δ13C), VWU, PWU, flowering time, and biomass parameters (Bechtold et al., 2010; Figure 1b).
3.1. Identification of a proxy trait for lifetime (plant) water use (PWU)
We analysed a range of parameters associated with plant water status by performing a short dehydration as well as a continuous maintenance of moderate drought experiment on 12 selected Arabidopsis ecotypes (Figure 1 and Table 1). We determined VWU (Ferguson et al., 2018; Figure 1a and Table 1), lifetime PWU (Figure 1b and Table 1), flowering time, above ground biomass parameters, δ13C, and calculated whole‐plant WUE parameters, namely, TE and WP (Table 1 and Figure 1; Bechtold et al., 2013, 2010, 2016; Ferguson et al. 2018). Both δ13C and WUEi measurements were taken to determine the influence of leaf‐level processes on whole plant traits (i.e., transpiring leaf surface area); however, we did not observe a significant relationship with whole‐plant WUE parameters such as TE and WP (Figure S2). We continued to focus on the determination of lifetime PWU and the genetic dissection of PWU and productivity traits, instead of the leaf‐level WUE parameters, δ13C and WUEi.
Our usual approach of a manual determination of PWU (Figure 1b) requires the weighing and watering of individual pots until the terminal flower has opened (Bechtold et al., 2010). The manual determination of PWU is challenging and time‐consuming (see Section 1); thus, to facilitate large‐scale manual screening of PWU of the mapping population, we first set out to identify an adequate proxy. We compared biomass production, flowering time, VWU, and PWU between the short‐dehydration and continuous moderate drought experiment carried out on the 12 Arabidopsis ecotypes (Figure 1). The continuous moderate drought experiment revealed that measured PWU (mPWU) was significantly correlated with both flowering (Figure 2a) and vegetative (rosette) biomass (Figure 2b and Tables S6 and S7). Based on these relationships, we developed the proxy parameter “calculated life time (plant) water‐use (cPWU),” as a product of VWU and flowering time:
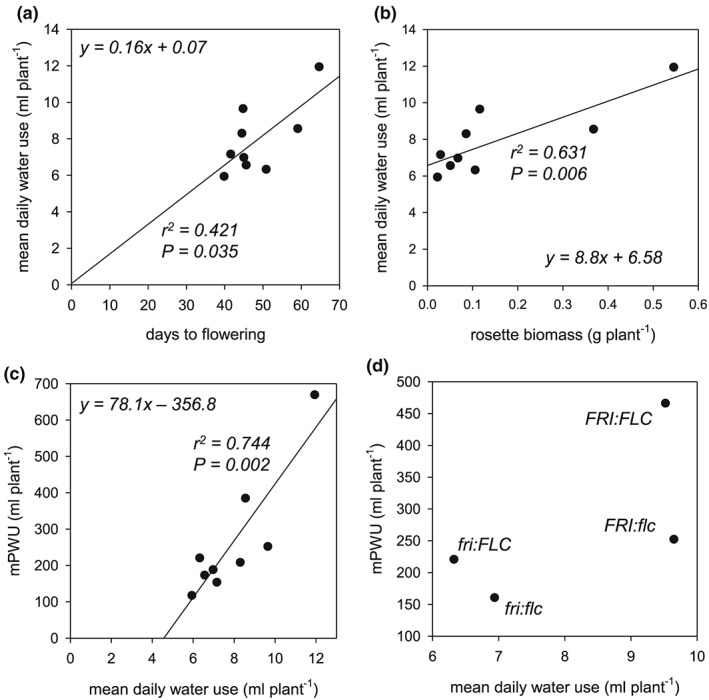
Figure 2.
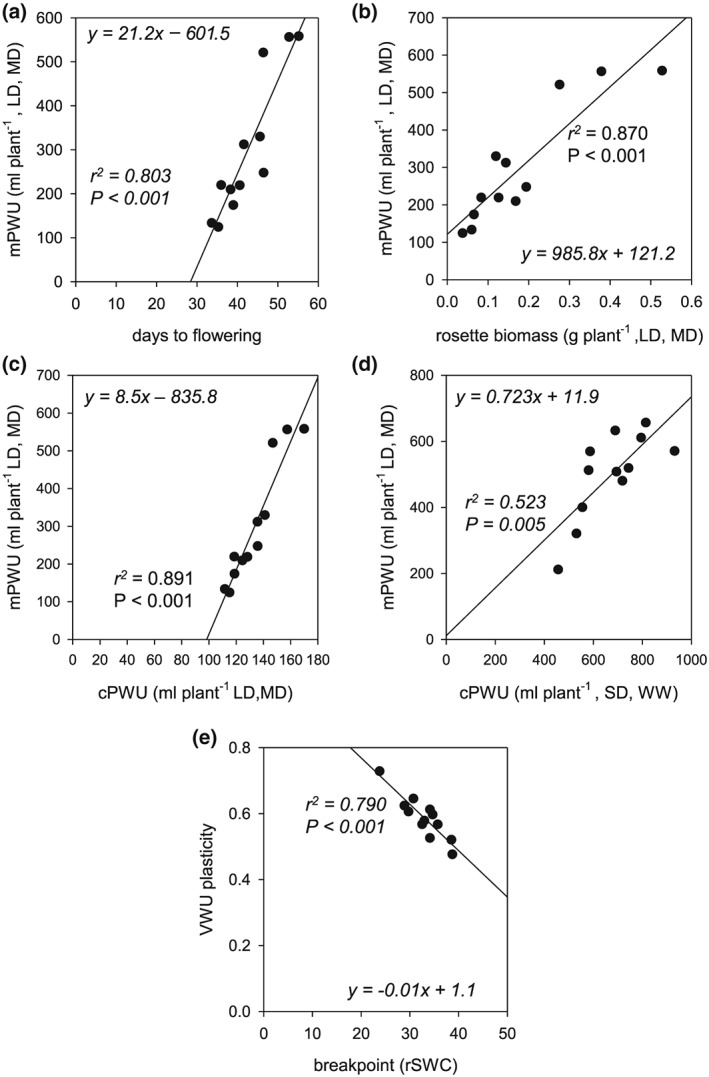
Lifetime water‐consumption and performance parameters in 12 selected ecotypes. (a) Relationship between days to flowering and measured plant water use (mPWU), (b) relationship between vegetative biomass and mPWU, (c) relationship between calculated lifetime plant water use (cPWU) and mPWU within the same experiment, and (d) relationship between cPWU and mPWU between two independent experiments: long‐day, moderate‐drought (LD, MD), and short‐day, well‐watered (SD, WW). The lines represent the equation of the linear regression model, and (e) relationship between the breakpoint in dehydration response and vegetative water use (VWU) plasticity. The P‐value of the slope parameter and adjusted r 2 value associated with the linear model are provided for each association
The continuous moderate drought experiment allowed us to directly relate mPWU with cPWU, which showed a highly significant positive correlation within the experiment (Figure 2c). In addition, the correlation between mPWU with cPWU was tighter than the correlations with rosette biomass and flowering time (Figures 2a,b). Importantly, a significant correlation between calculated and measured PWU was also observed when comparing mPWU from the continuous moderate drought experiment under LD conditions, with cPWU of a short‐dehydration experiment under SD conditions (Figure 2d). Therefore, we reasoned that PWU calculated from flowering time and VWU in a short‐dehydration experiment would provide a robust estimate of mPWU.
Furthermore, the short‐dehydration approach allowed us to quantify the drought responses of individual ecotypes by calculating the threshold at which plants enter drought stress (breakpoint) and the plasticity of the drought response (VWU plasticity; Ferguson et al., 2018). The breakpoint negatively correlated with the VWU plasticity, indicating that lines responding to drought stress at higher rSWC showed less absolute change in transpiration throughout the dehydration period and therefore exhibited reduced VWU plasticity (Figure 2e). Therefore, a short‐dehydration experiment allowed us to not only screen and dissect the genetic basis for the natural variation of cPWU and biomass but also assess drought response parameters at the same time.
3.2. The genetic dissection of cPWU, drought response, and biomass parameters
Short‐dehydration experiments (Figure 1a) were subsequently performed on 163 individuals of the Col‐0 × C24 RIL population (Table S2) including both parents. To control for experimental block effects, BLUPs were extracted and predicted means were calculated for all traits. The variation in predicted means for all traits was not significantly different from what would be expected of a normal distribution (P > 0.05; Kolmogorov–Smirnov normality test), and all traits demonstrated transgressive segregation (Figure S3). We calculated genetic variance (V G), total phenotypic variance (V P), and broad sense heritability (H 2), where all 13 traits assessed demonstrated variation that had a significant heritable basis within the RIL population (Table 2).
Table 2.
Genotypic and phenotypic variation of the 12 traits assessed as part of the QTL mapping
| Trait | Mean | SE | V G | V P | H 2 | Sig. |
|---|---|---|---|---|---|---|
| VWU | 8.6 | 0.02 | 0.49 | 0.84 | 0.58 | *** |
| Flowering time | 74.3 | 0.4 | 132.2 | 170.1 | 0.78 | *** |
| VWU plasticity | 0.55 | 0.03 | <0.00 | 0.01 | 0.17 | *** |
| Breakpoint (day) | 5.9 | 0.16 | 0.64 | 2.14 | 0.30 | *** |
| Breakpoint (rSWC) | 39.84 | 0.33 | 38.41 | 136.07 | 0.28 | *** |
| Rosette biomass | 0.32 | 0.01 | 0.02 | 0.04 | 0.63 | *** |
| Slope 1 | −11.28 | 0.30 | 0.56 | 2.59 | 0.22 | *** |
| Slope 2 | −5.16 | 0.27 | 1.09 | 2.47 | 0.44 | *** |
| Chaff biomass | 0.51 | 0.01 | 0.02 | 0.06 | 0.36 | *** |
| Seed biomass | 0.07 | 0.00 | 0.00 | 0.01 | 0.21 | *** |
| Total biomass | 0.88 | 0.0 | 0.03 | 0.11 | 0.29 | *** |
| Harvest index | 0.04 | 0.007 | 0.00 | 0.00 | 0.26 | *** |
| cPWU | 637.8 | 3.65 | 9454.7 | 13404.3 | 0.71 | *** |
The true (arithmetic) mean, standard error (SE), genetic variance (VG), phenotypic variance (VP), broad sense heritability (H 2), and significance of H 2 (Sig.) are provided for all traits. cPWU: calculated lifetime plant water use; n.s: not significant; rSWC: relative soil water content; VWU: vegetative water use.
Significant heritability at the P < 0.001 level.
Adjusted linkage maps were constructed based on the individuals used for mapping. Analyses indicated that 97.5% of the markers had been genotyped for all the RILs, and we observed a virtually even split in the allelic form of these markers, with 50.3% coming from the Col‐0 parental line and 49.7% from the C24 parental line. To identify the genetic variation that causes the observed phenotypic variation in VWU, cPWU, flowering time, productivity, and DS traits, MQM was performed (see Section 2) on a minimum of 163 selected individuals. No significant QTL models were identified for seed biomass (Figure S4a), dehydration response (VWU plasticity; Figure S4b), and the breakpoint (Figure S4c). For VWU, FT, cPWU, and slope 1, a total of 10 main effect QTLs were detected (Figures 3 and S4d and Table 3). The percentage of phenotypic variance explained for the cPWU QTLs ranged from 5.24% to 23.16%, for flowering time from 3.64% to 18.09%, and for VWU from 4.25% and 7.32% (Table 3). Because cPWU is calculated based partially on flowering time, there was colocalization between the two main effect cPWU (cPWU4:1 and cPWU5:1) and flowering time QTL (FT4:1 and FT5:1) on chromosomes 4 and 5 (Figure 3a,b, and Table 3). The strong positive correlation observed between flowering time and cPWU suggests that the colocalizing QTLs for these traits were likely to represent the same genes or linkage between causal genes. In general, this suggests that these two major effect cPWU QTLs are fundamentally flowering time QTLs whose effect on cPWU is not independent of flowering time. On the other hand, QTLs detected for VWU did not colocalize with flowering time QTLs (Table 3 and Figure 3). The additional QTL for cPWU (cPWU3:1) located on chromosome 3 is likely a result of allelic variation at the same genes that underlie the VWU3:1 QTL, because cPWU is also calculated based on VWU (Table 3).
Figure 3.
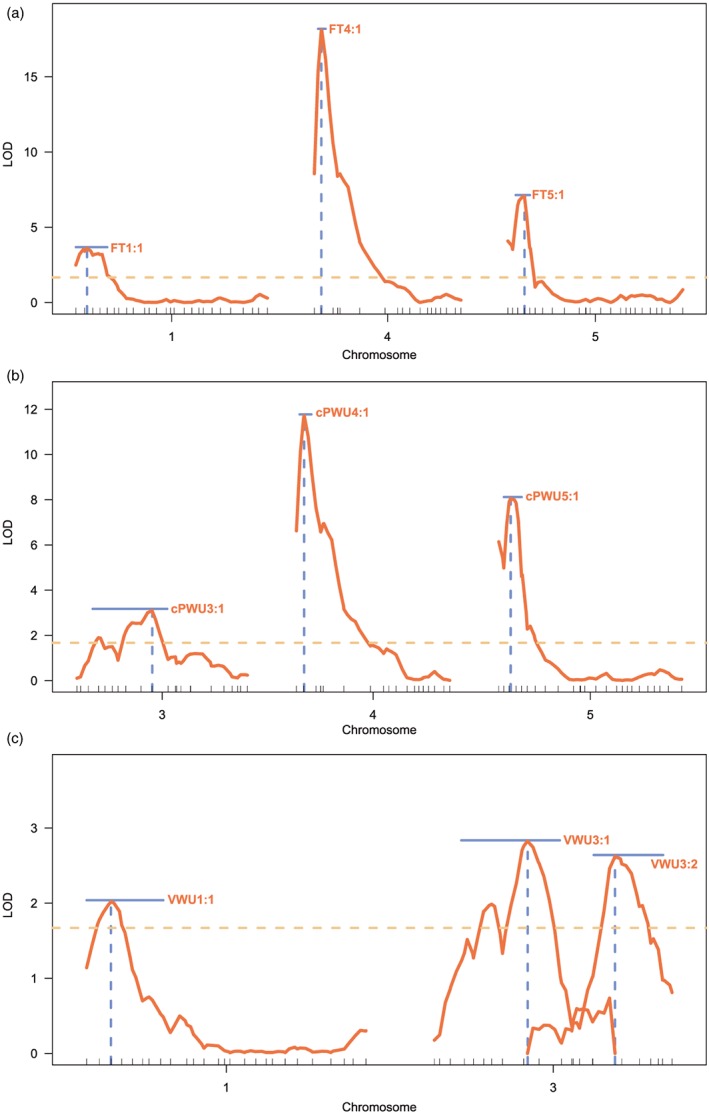
Quantitative trait loci (QTL) mapping. Logarithm of the odd (LOD) profiles for whole chromosomes were significant QTL are located according to multiple QTL mapping. (a) LOD profiles for three significant QTLs underlying variation for flowering time, (b) LOD profiles for three significant QTLs underlying variation for calculated lifetime plant water‐use (cPWU), and (c) LOD profiles for three significant QTL underlying variation for vegetative water use (VWU). The light brown dashed horizontal line indicates the 10% significance threshold for QTL identification. The solid horizontal blue lines indicate the 95% Bayesian confidence intervals of the QTLs. The dashed vertical blue lines indicate the QTL positions on the genetic map [Colour figure can be viewed at wileyonlinelibrary.com]
Table 3.
Locations and effect sizes for the significant QTL arising from the QTL mapping via a MQM for water use, harvest index, and flowering time
| QTL | Position (cM) | LOD score | Proportion of total genetic variation | 95% Bayesian credible interval (cM) | P‐value | Additive genetic effect (SE) |
|---|---|---|---|---|---|---|
| VWU1:1 | 9.00 | 1.88 | 4.25 | 0.00–28.00 | <0.001 | 0.14 (0.05) |
| VWU3:1 | 34.00 | 3.42 | 7.90 | 10.00–46.00 | <0.000 | −0.19 (0.05) |
| VWU3:2 | 68.40 | 2.51 | 5.72 | 58.00–83.37 | <0.000 | −0.17 (0.05 |
| FT1:1 | 6.00 | 3.64 | 5.51 | 0.00–16.00 | <0.000 | −2.74 (0.68) |
| FT4:1 | 3.70 | 18.09 | 34.93 | 2.00–6.00 | <0.000 | 6.75 (0.64) |
| FT5:1 | 8.00 | 7.11 | 11.39 | 4.00–11.60 | <0.000 | −3.84 (0.65) |
| cPWU3:1 | 38.24 | 3.04 | 5.24 | 8.00–44.00 | <0.000 | −20.99 (5.77) |
| cPWU4:1 | 11.62 | 11.45 | 23.16 | 2.00–8.00 | <0.000 | 47.05 (5.79) |
| cPWU5:1 | 7.93 | 7.04 | 14.85 | 2.55–11.60 | <0.000 | −34.80 (5.76) |
| Slope3:1 | 32.61 | 2.20 | 6.07 | 2.00–68.00 | <0.001 | 0.20 (0.06) |
The quantitative trait loci (QTL) names are given as the trait followed by the chromosome location. The position in cM, logarithm of the odd (LOD) score (LOD), proportion of total genetic variation, 95% Bayesian credible interval, P‐value, and additive genetic effect provided for all significant QTLs.
The three cPWU QTL did not act independently of the trait parameters, from which cPWU is calculated, as confirmed through QTL‐mapping with traits covariates (Figure S5). When performing single QTL‐mapping for cPWU while incorporating flowering time as a covariate in the analyses, the main effect QTL on chromosomes 4 and 5 are not detected; however, the QTL on chromosome 3 that is also detected when mapping for VWU becomes more significant (Figure S5c). Similarly, when incorporating vegetative biomass as a covariate, the effect of these QTL is reduced; however, they are still significant (Figure S5b). Incorporating VWU as covariate removes the importance of the QTL on chromosomes 3 and heightens the significance of the QTLs on chromosomes 4 and 5 (Figure S5d).
The two significant cPWU and flowering time QTLs on chromosomes 4 and 5 (Figure 3a,b) contained two well‐characterized flowering time genes, FRIGIDA (FRI, chromosome 4; AT4G00650) and FLOWERING LOCUS C (FLC, chromosome 5; AT5G10140). The ecotype Col‐0 possesses a nonfunctional allele of FRI (fri) and a functional allele of FLC (FLC), and the ecotype C24 contains a functional allele of FRI (FRI) and a weak allele of FLC (flc; (Johanson et al., 2000; Michaels, He, Scortecci, & Amasino, 2003). A significant epistatic interaction was detected between these QTLs when comparing the full model that incorporates both cPWU4:1 and cPWU5:1 to a single QTL model that only incorporates cPWU4:1 or cPWU5:1 (Figure S6). Transcriptional levels of FLC are positively regulated by FRI (Deng et al., 2011); thus, the epistatic interaction between these QTL further suggests that FRI and FLC are the causal genes. InDel markers were designed for both candidate genes and the RIL population was scored for the allelic variant of both genes (see Section 2). This information was incorporated into the genotypic data, and the genetic map was reestimated, which demonstrated that FRI and FLC were present between the markers that flanked the main effect QTLs on chromosomes 4 and 5, respectively (Figure S1b). The RIL population was subdivided according to the different allelic combination of FRI and FLC of each individual line (Table S4) to confirm the importance of the functionality of these genes on the traits of interest here.
3.3. The genetic action of nonfunctional and weak alleles of FRI and FLC reduces water use
We determined the allelic state of FRI and FLC in all RILs and divided the population into four groups: (a) fri: FLC (Col‐0), (b) FRI: FLC, (c) fri: flc, and (d) FRI: flc (C24). One‐way ANOVA comparisons of means and post‐hoc Tukey tests were performed to determine the effect of different allelic combinations on water use and plant development (Figure 4). There were significant and parallel differences in cPWU (Figure 4a) and flowering time (Figure 4b) between the four groups. Possessing nonfunctional and weak alleles of FRI and FLC, respectively, significantly reduced flowering time and cPWU (Figure 4).
Figure 4.
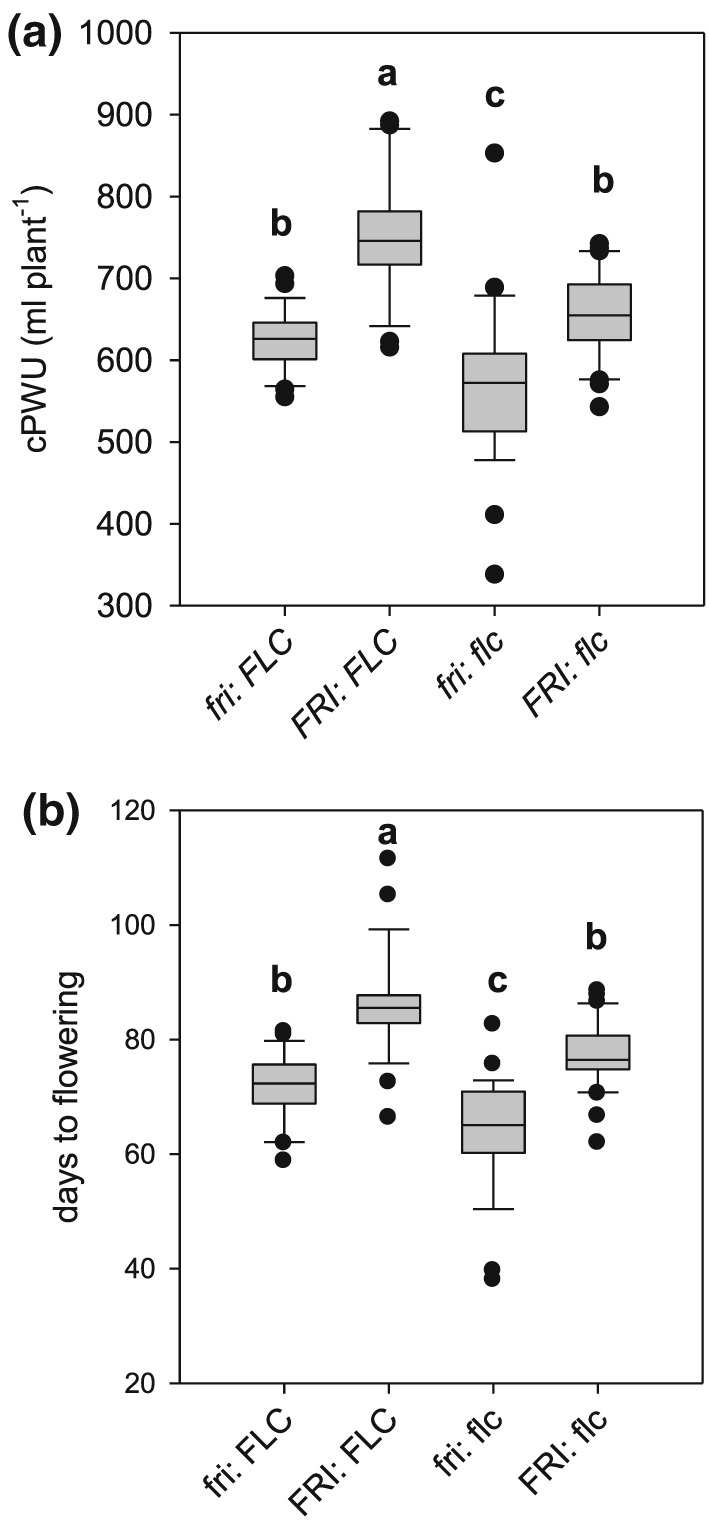
Trait performances of genotypes harbouring different allelic combinations of the FRIGIDA and FLOWERING LOCUS C genes in recombinant inbred lines. Boxplots describing the variation for traits assessed for the four groups based on allelic combination of both FRI and FLC: (a) cPWU and (b) days to flowering. The letters (a, b, and c) above the boxplot denote the post‐hoc Tukey groups, where allelic groups whose letters are different are significantly different from one another for that trait at P < 0.05. The bold line in the centre of the boxplots represents the median, the box edges represent the 25th (lower) and 75th (upper) percentiles, and the whiskers extend to the most extreme data points that are no more than 1.5x the length of the upper or lower segment. Outliers are data points that lie outside the 1.5x interquartile range both above the upper quartile and below the lower quartile
To further test the hypothesis that cPWU is a suitable proxy of mPWU and to confirm that increased life‐span through a combination of FRI and FLC is the main factor underlying PWU, we subsequently obtained NILs that harboured the Col‐0 allele of FRI and FLC separately in a homogenous C24 genomic background and vice versa (Table S5). Seven NILs and two parental lines were subjected to a continuous moderate drought experiment, where flowering time, mPWU, VWU, cPWU, productivity parameters, mean daily water use and δ13C and stomatal conductance were determined (Figure 1b). The hypotheses regarding cPWU that emerged from the RIL population were essentially confirmed. The combination of both nonfunctional and weak alleles of fri (Col‐0) and flc (C24) led to significantly reduced mPWU (Figure S7a) and flowering time (Figure S7b). Due to the significant relationship between flowering time and mPWU (Figure 2a), we assessed whether the different allelic combinations of FRI and FLC had pleiotropic effects on VWU. There was no significant difference in VWU in both the NILs and RILs under either SD (RILs) or LD (NILs) conditions (Figure S7c,d).
Interestingly, we observed a significant relationship between mean daily water use, days to flowering, and rosette biomass in the moderate drought experiments for the 12 ecotypes and the NILs (Figures S8a,b, and 5a,b), leading to high mPWU (Figures S8c and 5c). Therefore, late flowering ecotypes and NILs appear to sustain increased daily water use over a longer period, which was independent of the allelic combinations of FRI and FLC (Figure 5d).
Figure 5.
The contribution of mean daily water use in the near‐isogenic lines. (a) Relationship between flowering time and mean daily water use, (b) relationship between rosette biomass and mean daily water use, (c) relationship between mean daily water use and measured plant water use (mPWU), and (d) relationship between mean daily water use and mPWU divided into four FRI/FLC allelic groups tested in the near‐isogenic lines. The linear model of the relationship between mean long‐term water use and mean daily water use is provided. R 2 and P values are provided where a significant relationship was identified
δ13C, while significantly different between Col‐0 and C24, did not show a significant difference among the remaining allelic combinations of FRI and FLC (Figure S9a), which suggests that δ13C was independent of FRI and FLC. A significant negative correlation between δ13C and stomatal conductance indicated that low g s leads to increased instantaneous WUE (A/gs) (g s; Figure S9b; R 2 = 0.781 P < 0.01), which also coincided with the distinct rosette growth phenotype of C24 (Figure S9b,d). In addition, the lack of significant QTLs for VWU, VWU plasticity, and the breakpoint (Figure S4) suggests that leaf‐level drought responses were not genetically controlled in this mapping population and therefore independent of the detected genetic control of flowering time. This was confirmed by the nonsignificant differences in VWU, VWU plasticity, and breakpoint for the four allelic FRI/FLC groups (Figures S7c and S10a,b).
Importantly, the observation that a combination of fri (Col‐0) and flc (C24) in the NILs led to significantly reduced mPWU (Figure S7a), and significant variation in δ13C (Figure S9a) that did not match the variation for mPWU, supports our observations from the diverse suite of ecotypes. Taken together, this suggests that cPWU is a reliable proxy for mPWU.
3.4. Biomass variation and distribution is independent of the genetic action of FRI and FLC, and growth conditions
We also assessed whether the different allelic combinations of FRI and FLC resulting in significantly different PWU had pleiotropic impacts on biomass parameters. For example, the decrease in cPWU in the fri: flc group did not result in a significant reduction in above ground, seed, or vegetative biomass in the RILs (Figure 6a‐c) or the NILs (Figure S11a‐c), yet the combination of FRI:FLC significantly decreased seed and increased vegetative biomass (Figures 6b,c, and S11c). This suggests that the additionally acquired photosynthates acquired by later flowering plants are translocated primarily to vegetative as opposed to reproductive sinks.
Figure 6.
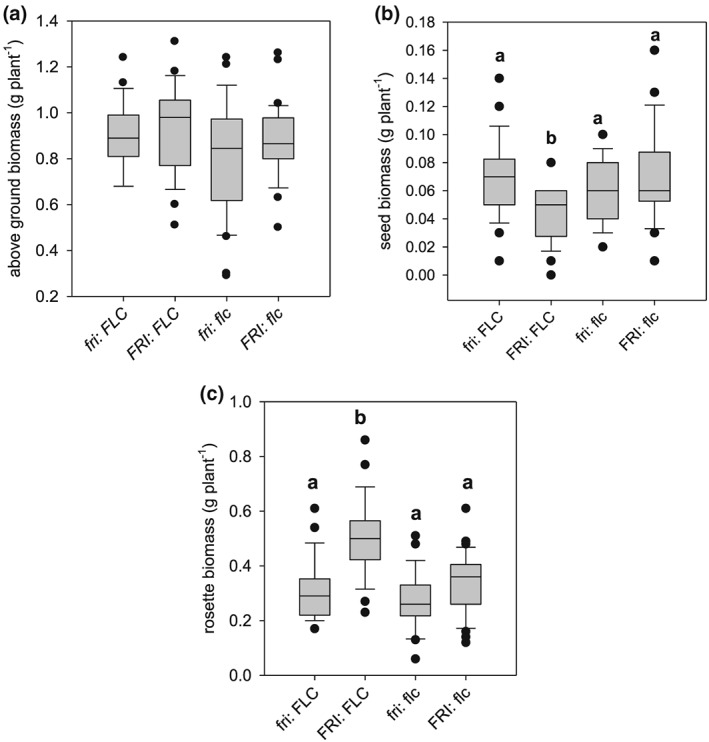
Boxplots of biomass parameters based on allelic combinations of FRI/FLC in the recombinant inbred lines: (a) above ground biomass, (b) seed biomass, and (c) rosette biomass. The letters (a, b, and c) above the boxplot denote the post‐hoc Tukey groups, where allelic groups whose letters are different are significantly different from one another for that trait at P < 0.05. The bold line in the centre of the boxplots represents the median, the box edges represent the 25th (lower) and 75th (upper) percentiles, and the whiskers extend to the most extreme data points that are no more than 1.5x the length of the upper or lower segment. Outliers are data points that lie outside the 1.5x interquartile range both above the upper quartile and below the lower quartile
Biomass allocation (harvest index [HI]) showed substantial variation amongst the NIL and the RIL populations (Figure S12a,b), due to different experimental conditions (SD vs LD, well‐watered vs moderate drought). Despite these experimental differences, relative proportions were highly correlated between the well‐watered and moderate drought experiments (Figure 7), suggesting allelic combinations with low HI in the short‐dehydration experiments (RILs) also showed low HI in the continuous moderate drought experiment (NILs; Figure 7a). Equally, cPWU significantly correlated across the distinct experiments for the different allelic groups (Figure 7b). A similar relationship for PWU and HI across different experiments was also observed in the 12 accessions (Figures 2d and 7c). This suggests that the distribution of biomass and PWU was independent of environmental growth conditions including watering status and day length in both the mapping population and the 12 accessions.
Figure 7.
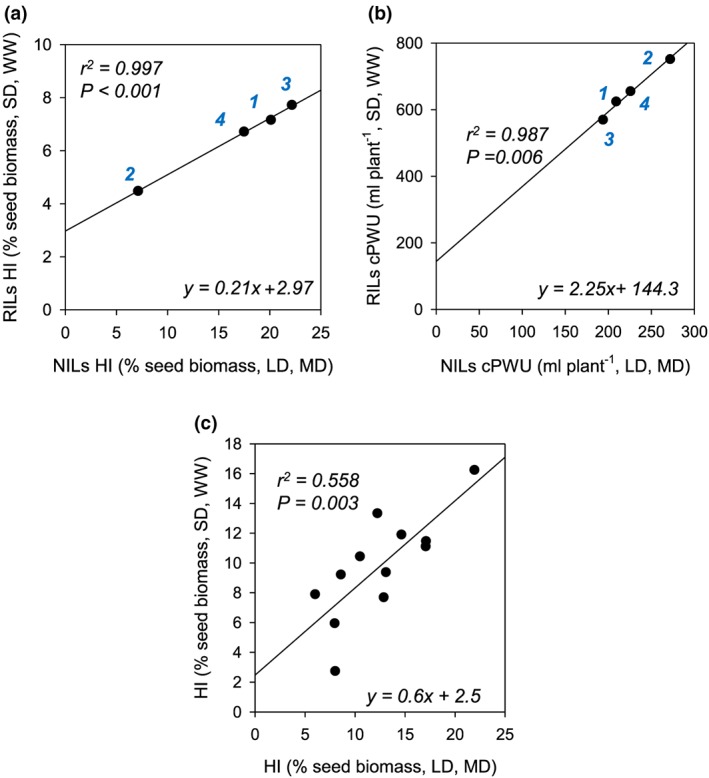
Comparison of water use parameters and harvest index (HI) parameters across different growth and watering regimes. (a) Correlation of HI of the four FRI/FLC allelic groups tested in recombinant inbred lines (RILs) and near‐isogenic lines (NILs). RILs were subjected to the growth regime shown in Figure 1A (SD, WW), and NILs were subjected to growth regime shown in Figure 1B (LD, MD). (b) Correlation between cPWU and cPWU of the four FRI/FLC allelic groups tested in RILs and NILs grown under two different day length and watering regimes (SD, WW and LD, MD). (c) Correlation of HI of 12 ecotypes subjected to the growth different growth regimes shown in Figure 1. The lines represent the equation of the linear regression model. The P‐value of the slope parameter and adjusted R 2 value associated with the linear model are provided for each association. SD: short day; LD: long day; WW: well watered; MD: moderate drought. Allelic combinations: 1: fri/FLC; 2: FRI/FLC; 3: fri/flc; and 4: FRI/flc [Colour figure can be viewed at wileyonlinelibrary.com]
3.5. Gene expression
The detected QTL regions contained many genes, as such we explored gene expression differences between the two parents within the mapping intervals for all three mapped traits. This was achieved using a publicly available microarray experiment comparing C24 and Col‐0 (Bechtold et al., 2010) and RNAseq data of both parental accessions (Xu et al., 2015). In total, 9906 protein coding genes were identified within the 95% Bayesian credible intervals (extended to nearest physical markers) on chromosomes 4 and 5 (Table 3), of which 304 showed differential expressions between Col‐0 and C24 (Tables S8 and S9). We randomly selected three to four differentially expressed genes (up and down) for each interval, while also including FRI, FLC, and FLOWERING LOCUS T (FT; chromosome 1) for analysis of gene expression in the NILs and both parental lines (Table S10) at 26‐ and 43‐day postgermination.
Early studies have shown that FRI up‐regulates FLC expression in ecotypes that have the active allele of FRI (Michaels & Amasino, 1999; Sheldon et al., 1999). NILs carrying the C24 FRI allele (Table S5) showed elevated FLC expression at 26‐ and 43‐day postgermination in plants grown under SD controlled environment conditions (Figures 1 and 8a). Variation in FLC and FRI expression at 43‐day postgermination showed a significant association with flowering time and mPWU (Table S10), which was independent of FT expression (Table S11). This is in line with QTL mapping results where a significant association of the allelic state of FRI and FLC with flowering time and PWU was observed under SD controlled environment conditions (Figures 3a,b; 4; and S9a,b). Other highly differentially expressed genes in the mapping intervals on chromosomes 4 and 5 showed no specific pattern that significantly correlated with the flowering time phenotype or mPWU observed in the NILs across the two developmental stages (Table S11).
Figure 8.
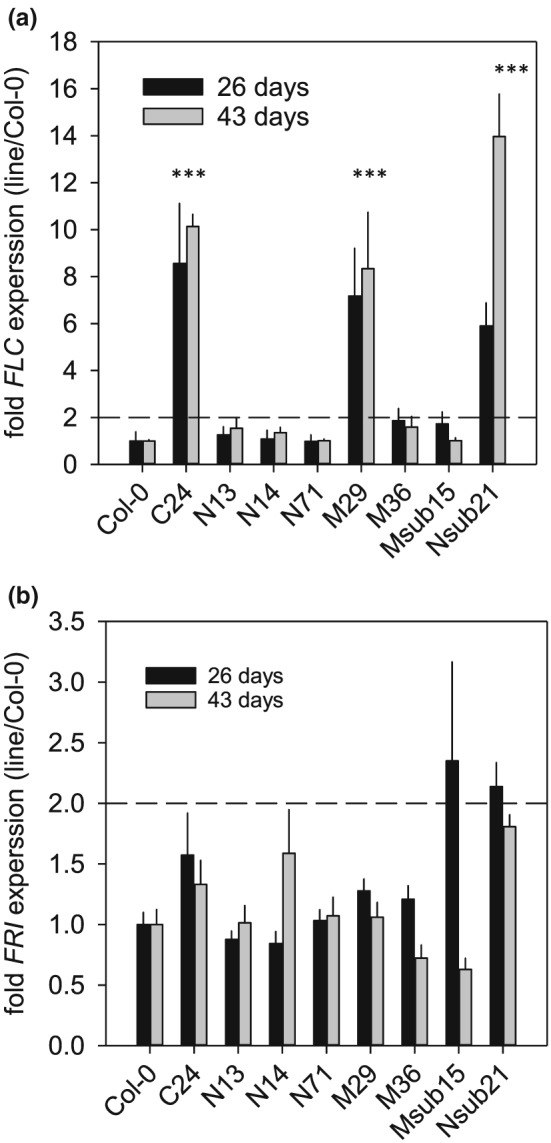
Expression of candidate genes in mapping interval. (a) Gene expression of FLC at 26 days after sowing (26 days) and 43 days after sowing (43 days). The stars above the columns denote significant different (P < 0.01) expression level compared to Col‐0 at both time points. (b) Gene expression of FRI at 26 days after sowing (26 days) and 43 days after sowing (43 days). No significant gene expression levels compared between either the NILs or C24 and Col‐0 were detected
4. DISCUSSION
The ecotype C24 has an unusually rare combination of traits resulting in increased drought resistance, reduced VWU, and increased WP (Bechtold et al., 2010; Ferguson et al., 2018), as well as resistance to a number of other abiotic and biotic stresses (Brosché et al., 2010; Lapin et al., 2012; Xu et al., 2015; Bechtold et al. 2018).
WUE i is considered to play a key role in PWU (Steduto, Hsiao, & Fereres, 2007) as it relates equally to water loss by transpiration and net carbon gain, thus impacting on biomass production (Steduto et al., 2007; Long et al., 2015). Because of the relationship between leaf and plant‐level WUE parameters, high leaf‐level WUE is seen as an important trait for minimizing water loss in many different plants species (Blum, 2009; Sinclair & Rufty, 2012; Vadez, Kholova, Medina, Kakkera, & Anderberg, 2014). In addition, WUE is often referred to as a drought adaptation trait (Comstock et al., 2005; Condon et al., 2004; McKay et al., 2008) because of the A/g s correlation, where WUE can increase during drought stress when stomata close, especially when A is not yet proportionally affected (Easlon et al., 2014; Gilbert, Holbrook, Zwieniecki, Sadok, & Sinclair, 2011; Meinzer, Goldstein, & Jaimes, 1984). However, WUE only evaluates how much water a plant needs to fix carbon, and in Arabidopsis, where within species variation in WUE is predominantly driven by variation in stomatal conductance (Easlon et al., 2014; Ferguson et al., 2018; Vialet‐Chabrand et al. 2016); overall, PWU will therefore be the main driver of TE.
4.1. The importance of flowering time for plant water‐use strategies
In natural populations, such as Arabidopsis, few studies have compared leaf‐level measurements with whole‐plant estimates of WUE (i.e., TE or WP; Bechtold et al., 2013, 2010; Easlon et al., 2014), and often leaf‐level WUE measurements have been exploited as a screening tool to identify genes that could optimize water requirements and yield (Hausmann et al., 2005; Juenger, Mckay, Hausmann, Keurentjes, & Sen, 2005; Masle et al., 2005; McKay et al., 2008; McKay, Richards, & Mitchell‐Olds, 2003). Natural genetic variation for δ13C has been demonstrated in Arabidopsis (Bouchabke‐Coussa et al., 2008; Easlon et al., 2014; Kenney, Mckay, Richards, & Juenger, 2014; Verslues & Juenger, 2011), and QTL mapping has successfully elucidated the genetic basis of δ13C (Ghandilyan et al., 2009; Hausmann et al., 2005; Juenger et al., 2005; Lovell et al., 2015; Masle et al., 2005; McKay et al., 2003; McKay et al., 2008). Interestingly, a positive genetic correlation between flowering time and δ13C has been reported (Easlon et al., 2014; McKay et al., 2003), whereas other studies found a negative genetic correlation between flowering time and water content (Loudet, Chaillou, Camilleri, Bouchez, & Daniel‐Vedele, 2002; Loudet, Chaillou, Krapp, & Daniel‐Vedele, 2003). Despite these differences, the link between flowering time and plant water status is undeniable. Furthermore, natural polymorphisms of FRI and FLC have been identified as key determinants of the natural variation in δ13C (Kenney et al., 2014; Lovell et al., 2015; McKay et al., 2003; McKay et al., 2008), and FLC is also known to control the circadian rhythm of leaf movement (Edwards et al., 2006). It was therefore suggested that FLC may also regulate stomatal transpiration (Edwards et al., 2006), because accessions with a nonfunctional allele of FLC showed reduced flowering time and increased water content (Loudet et al., 2002, 2003). Similarly, C24 possess a nonfunctional allele of FLC and exhibit a high relative water content and low stomatal conductance (Bechtold et al., 2010; Figure S9a,b). Our data suggest that flowering time achieved through different combinations of weak or nonfunctional alleles of FRI and FLC explained most of the variation in PWU (Figures 4a and S7a). Leaf‐level traits associated with the lowered stomatal conductance phenotype were independent of variation at these genes (Figure S9a,b). In addition, VWU, average daily water use, or the dehydration response were also not affected by the allelic combinations of FRI and FLC (Figures 5d; S7c,d; and S10). Accordingly, QTLs identified for VWU did not overlap with the two major intervals containing FRI and FLC (Figure 3c and Table 2). Importantly, plants with high mPWU also used more water daily, which suggests that lifetime PWU is not only driven by flowering time but also by short‐term water‐use strategies (Figures 5c and S8c).
In this study, cPWU and mPWU was clearly associated with increased flowering time (Figure 2a). Mapping identified three QTLs for cPWU located on chromosomes 3, 4. and 5, and given the observed relationships between lifespan and water use (Figure 2a), two also overlapped with flowering time QTLs (Figure 3 and Table 2). FRI and FLC were determined to be the causal genes underlying the overlapping QTLs on chromosomes 4 and 5, respectively (Figure S1), which reinforced the role of flowering time in determining lifetime PWU. This is perhaps unsurprising, because a plant that lives for a longer period is likely to use more water; however, this occurred without apparent gain of reproductive biomass (Figures 6b and S11b). Interestingly, other development associated genes such as ERECTA (Masle et al., 2005; Villagarcia, Morin, Shpak, & Khodakovskaya, 2012; Shen et al., 2015), SHORT VEGETATIVE PROTEIN (SVP or AGL22; Bechtold et al., 2016), and HEAT SHOCK TRANSCRIPTION FACTOR A1b (Bechtold et al., 2013; Albihlal et al., 2018) have been shown to affect stomatal function, stress tolerance, and plant development in Arabidopsis and other plant species.
Similarly, the lack of a significant positive correlation between δ13C and flowering time in the NILs suggested that the variation in δ13C was independent of FRI and FLC in this mapping population (Figure S9c). However, increased δ13C coincided with reduced stomatal conductance and the distinctive growth phenotype of the C24 rosette (Figure S9b,d). In Arabidopsis, δ13C is regulated by variation in stomatal conductance and photosynthetic capacity (Masle et al., 2005), which clearly corroborates the observed link between g s and δ13C in the NILs and the independence from FRI and FLC. C24 is also more drought tolerant compared to Col‐0 based on rosette wilting phenotypes after dehydration (Bechtold et al., 2010), and the drought response parameters were also independent of FRI and FLC in the RIL population (Figure S10).
4.2. The impact of day length on flowering time and water use
Col‐0 is a rapid cycling ecotype (Shindo et al., 2005) and the higher FLC expression levels in C24 would suggest a late‐flowering phenotype compared to Col‐0 (Figure 8a). However, early genetic studies have shown that C24 contains an allele of FLC that suppresses the late flowering phenotype caused by dominant alleles of FRI, whereas Col‐0 contains an allele of FLC that does not suppress the late‐flowering caused by dominant FRI alleles (Koornneef, Blankestijn‐de, Hanhart, Soppe, & Peeters, 1994; Lee, Michaels, Masshardt, & Amasino, 1994; Sanda & Amasino, 1996). Therefore, we do not see a significant difference in flowering time between Col‐0 and C24 in un‐vernalized plants (Figure 4b). The transition from SD to LD conditions as part of our growing regimes (Figure 1) mimics the natural progression in day length from spring to summer, which is commonly experienced by spring/summer annuals. Despite the difference in day length and watering regimes between the short‐dehydration and moderate drought treatments (Figure 1), PWU and biomass allocation were significantly correlated between experiments (Figure 7). This suggested that even though absolute values for HI and PWU were different the relative difference between lines remained the same (Figure 7), indicating that day length does not alter overall water use and developmental strategies in a genotype‐by‐environment specific manner.
With respect to the above, it is worth noting that subjecting summer or winter annual ecotypes to long photoperiods may result in outcomes that could be problematic especially when assessing mechanisms related to leaf‐level WUEi drought resistance strategies, because these are often closely linked to flowering time. For example, Riboni, Galbiati, Tonelli, and Conti (2013) and Riboni, Robustelli, Galbiati, Tonelli, and Conti (2014) demonstrated that the induced drought escape mechanisms in Arabidopsis are promoted by the drought mediated up‐regulation of florigens in an ABA‐ and photoperiod‐dependent manner, so that early flowering (drought escape) can only occur under LDs, independent of FT and CONSTANS. This is in line with our observation that flowering time and mPWU are associated with FRI and FLC expression but seemingly independent of FT expression (Figure 8 and Tables S10 and S11).
4.3. The role of FRI and FLC in determining water use and biomass allocation
FRI and FLC respond to seasonal variation in temperature, thus play a crucial role in floral transitioning (Koornneef et al., 1994; Lee et al., 1994; Michaels & Amasino, 2001). FLC is a MADS box transcription factor that inhibits the transition to flowering by repressing the expression of floral integrators, such as FT and SUPPRESSOR OF OVEREXPRESSION OF CONSTANS1 (SOC1; Hepworth, Valverde, Ravenscroft, Mouradov, & Coupland, 2002; Helliwell, Wood, Robertson, James Peacock, & Dennis, 2006; Deng et al., 2011). Most rapid‐cycling accessions of Arabidopsis contain naturally occurring loss‐of‐function mutations in FRI and therefore have low levels of FLC expression and are early flowering even in the absence of vernalization (Johanson et al., 2000).
Despite variation in cPWU mapping to FLC and FRI, we cannot explicitly rule out an indirect effect of flowering time differences on water use (Figure S5c). Especially since FLC expression remained high in C24 and two NILs throughout the experiment (Figure 8a), independent of the FLC allele present (Table S5). However, the reduction in mPWU attained via introgression of the nonfunctional Col‐0 allele of FLC or the functional C24 FRI allele into the C24 and Col‐0 genomic background, respectively, demonstrates that although flowering time ultimately impacts PWU, it does not confound the importance of these genes in determining PWU.
Interestingly, two major FLC haplogroups were associated with flowering time variation in Arabidopsis under field‐like conditions, but only in the presence of functional FRI alleles (Caicedo, Stinchcombe, Olsen, Schmitt, & Purugganan, 2004). This is in line with our finding that the functional C24 allele of FRI (FRI) was required for increased FLC expression, even though FRI expression was not significantly altered (Figure 8b and Tables S10 and S11). Furthermore, a study of ~150 accessions showed that the role of FLC in regulating flowering time is less important under SD conditions (Lempe et al., 2005), which suggests that the impact of FLC on PWU in our experiments may have been influenced by the environmental growth conditions such as photoperiod and potentially watering status (Figure 1).
However, because FLC also acts in conjunction with other MADS‐box proteins to regulate various aspects of plant development through a large variety of target genes (Deng et al., 2011), and rapid‐cycling accessions contain a number of other genes regulating FLC expression, collectively known as the autonomous floral‐promotion pathway (Michaels & Amasino, 1999; Sheldon et al., 1999), we cannot rule out that other genetic factors affecting flowering time may indirectly contribute to the variation in whole PWU. Especially, since, ~50% of the total genetic variation for flowering time was not dissected in this study (Table 3.)
The analysis of such putative relationships was beyond the scope of this study. Yet, the considerable number of FLC targets and their involvement in different developmental pathways may reflect an important strategy to integrate environmental signals and plant development to ensure reproductive success under many different conditions.
Short‐term stress‐mediated initiation of flowering pathways also involves the repression of FLC expression. Cold or saline stress‐dependent activation of miR169b was shown to repress the expression of the NF‐YA2 transcription factor, which in turn reduces FLC expression promoting early flowering (Xu et al., 2014). Here, stress treatments were shown to accelerate flowering (escape response) involving the above‐described signalling cascade. We have previously demonstrated that the experimental watering regimes employed in this study (Figure 1) do not initiate a similar escape response in the progenitors of the mapping population and several other rapid cycling ecotypes (Ferguson et al., 2018; Bechtold et al., 2010; 2013). Heat sensitivity has been associated with late flowering haplotypes in vernalized plants, and FLC haplotypes resulting in late flowering showed reduced silique length, suggesting a negative correlation between flowering time and seed productivity (Bac‐Molenaar et al., 2015). This negative correlation corroborates our findings, where late flowering RILs and NILs produced less seed biomass and vice versa independent of photoperiod and watering conditions (Figures 6b and S11b).
However, well‐known work from the previous decade has demonstrated a pleiotropic link between flowering time and δ13C (WUE; McKay et al., 2003, Juenger et al., 2005). Similarly, positive phenotypic associations between flowering time and δ13C have been reported (Easlon et al., 2014; Kenney et al., 2014). It has therefore been suggested that functional alleles of FRI and FLC indirectly increase δ13C, suggesting that late flowering genotypes have greater WUE (McKay et al., 2003). The other referenced studies here support this notion in terms of flowering time and WUE but not with respect to the allelic state of FRI and FLC. In this study we have identified FRI and FLC as underlying major QTLs for flowering time and cPWU. Because cPWU is a factor of flowering time, cPWU4:1 and cPWU5:1 cannot be considered independent of flowering time. Nevertheless, the demonstration of reduced mPWU without compromising reproductive fitness in NILs harbouring nonfunctional and weak alleles of FRI and FLC (Figure S7a) suggests that accelerating flowering time may be the most efficacious means to improve WUE. However, components of previous work essentially suggest that based on a leaf‐level WUE proxy trait, delaying flowering time will increase WUE (Easlon et al., 2014; Kenney et al., 2014; McKay et al., 2003). Thus, this present study illuminates the importance of assessing water use at the whole plant and life time level.
It is important to note that FRI has been identified as playing a major role in determining adaptations to water availability through trait correlations along an axis, where functional FRI facilitates dehydration avoidance through elevated WUE (measured as δ13C; Lovell et al., 2013). Conversely, Lovell et al. (2013) demonstrated that reduced expression of FRI facilitates a drought escape strategy owing to earlier flowering, which is linked to lower WUE. This finding of Lovell et al. (2013) is partly supported by our results in the sense that fri has the capacity to facilitate a drought escape response; however, the short‐dehydration experiment (Figure 1a) does not elicit early flowering in either Col‐0 or C24 (Ferguson et al., 2018). In addition, our results build upon these findings by also highlighting the importance of FLC, because possessing fri and flc reduces water use much more than just possessing one or the other (Figures 4a and S7a). Furthermore, our results demonstrate that this does not come at the cost of reducing reproductive output (Figure 8b), and as a consequence water productivity increases.
4.4. The relationship between leaf‐level and whole‐plant measures of water use
Leaf‐level measures of WUE, taken during vegetative growth, are not representative of whole plant measures such as TE or WP (Figure S2a–d). This suggests that plants with improved δ13C and/or WUE i are not necessarily diverting additionally acquired photosynthates toward reproductive growth. In addition, our estimation of TE is clearly biased towards the final above ground biomass, neglecting root architecture. It is well established that both root depth and density play a major role in optimizing water uptake depending on the hydrological conditions (Czyz & Dexter, 2012; Falik, Reides, Gersani, & Novoplansky, 2005), but variation here may have been limited due to their likely pot bound nature. However, the relative performance of NILs and ecotypes was highly correlated between different experiments (Figure 7), suggesting that the variation observed for TE even though biased may reflect actual genotypic differences.
Different drought resistance mechanisms, such as avoidance by maintaining high plant water status and/or drought escape through early flowering (Levitt, 1985), are critical from an ecological standpoint, facilitating population persistence in regions characterized by frequent and/or extended periods of reduced water availability (Araus, Slafer, Reynolds, & Royo, 2002; Gechev, Dinakar, Benina, Toneva, & Bartels, 2012; Kooyers, 2015; Kooyers, Greenlee, Colicchio, Oh, & Blackman, 2015). However, leaf‐level traits such as high WUE i/δ13C aimed at preserving water may not always ensure high productivity, and lifespan also determines water use but not necessarily biomass production (Figures 4, 6, and S11b), or allocation (Figure S12; Ferguson et al., 2018). In late flowering plants, photosynthates are not translocated to reproductive sinks, but instead to vegetative biomass (Figure S2), which either suggests poor resource allocation in late flowering ecotypes or a diversion of resources toward abiotic stress defence mechanisms associated with reduced water availability (Claeys, Inze, & Inzé, 2013). Recent studies on the perennial species Arabidopsis lyrata and 35 Arabidopsis thaliana accessions highlighted that populations increased their reproductive output while reducing vegetative growth (Ferguson et al., 2018; Remington, Leinonen, Leppälä, & Savolainen, 2013), which may be even more prevalent in annual plants that only have one opportunity at reproduction. Although recent reports have clearly shown that there is a selection on early flowering in Arabidopsis due to increased plant fitness (Ågren, Oakley, Lundemo, & Schemske, 2017; Austen, Rowe, Stinchcombe, & Forrest, 2017; Gnan, Marsh, & Kover, 2017), still little is known about the genotype‐to‐phenotype basis of this resource allocation trade‐off.
5. CONCLUSION
We conclude that flowering time is an important determinant of lifetime PWU strategies in Arabidopsis, as well as a critical life history trait important for seed production. Additional, absolute water use at the vegetative growth stage contributes to overall PWU, albeit to a much‐reduced degree. The causal genes that underlie VWU QTLs are ambiguous and will require further fine‐mapping. We have demonstrated that Arabidopsis PWU strategies can be independent of traditional leaf‐level measures of drought tolerance, WUE, and biomass traits, and consequently, genes identified based on these traditional performance traits may not lead to improved productivity under water limiting or water‐replete conditions.
Supporting information
Figure S1. The single nucleotide polymorphism (SNP) markers used and their position on the re‐estimated linkage map. a ‐ InDel markers for FRI and FLC, used to score the C24 x Col‐0 RIL population, and b ‐ Position in cMs of all markers on the re‐estimated genetic map.
Figure S2. Comparison of leaf level water use efficiency and biomass level water use efficiency parameters. a ‐ b Relationship between δ13C, and whole plant water use efficiency parameters biomass level WUE parameters: TE (transpiration efficiency) and WP (water productivity) and c – d Relationship between WUE i, and whole plant water use efficiency parameters biomass level WUE parameters, TE and WP. The associations are not significant in all cases.
Figure S3. Distribution of estimated means for all traits assessed as part of the QTL mapping. a ‐ vegetative water use (VWU), b ‐ days to flowering, c ‐ seed biomass, d ‐ calculated lifetime plant water use (cPWU), e ‐ dehydration plasticity (VWU plasticity), and f ‐breakpoint (rSWC) of the segmented regression. For all traits, a Shaprio‐Wilk test of normality was performed on the estimated means of all RILs, where all traits demonstrated variation that was not significantly different from a normal distribution (P > 0.05). Green arrows indicate the position of C24 and red arrows indicate the position of Col‐0. The estimated means for the parental lines are also provided (Red – Col‐0, Green – C24)
Figure S4: Additional QTL mapping results. a ‐ LOD profiles for seed biomass, with no significant QTL detected, b ‐ LOD profiles for dehydration plasticity, with no significant QTL detected, c ‐ LOD profiles for breakpoint (rSWC), with no significant QTL detected, and d – LOD profiles for slope 1, with one significant QTL detected. The dashed horizontal red line indicates the 0.05 genome‐wide significance threshold.
Figure S5: Single QTL mapping for calculated plant water use with and without traits as covariates. a – Without a trait covariate. b – With rosette biomass as a trait covariate. c – With flowering time as a trait covariate. d‐ With vegetative water use as a covariate.
Figure S6: LOD scores for a two‐dimensional genome scan for calculated plant water use. Values in the upper left triangle represent the full QTL model. Values on the lower right triangle represent the likelihood ratio comparing the full model with QTLs on all chromosomes with the single QTL model, thus indicating the presence of epistatic interactions.
Figure S7: Trait performances of genotypes harbouring different allelic combinations of the FRIGIDA (FRI) and FLOWERING LOCUS C (FLC) genes. Boxplots describing the variation for traits assessed for the 4 groups based on allelic combination of FRI and FLC, a – mPWU in the NILs, b ‐ days to flowering in the NILs, c ‐ VWU based on allelic combinations of FRI/FLC in the RILs, and d ‐ VWU based on allelic combinations of FRI/FLC in the NILs. The letters (a, b, and c) above the boxplot denote the post‐hoc Tukey groups, where allelic groups whose letters are different are significantly different from one another for that particular trait at P < 0.05. The bold line in the centre of the boxplots represents the median, the box edges represent the 25th (lower) and 75th (upper) percentiles, the whiskers extend to the most extreme data points that are no more than 1.5x the length of the upper or lower segment. Outliers are data points that lie outside the 1.5x interquartile range both above the upper quartile and below the lower quartile.
Figure S8: The contribution of mean daily water use in the 12 ecotypes. a ‐ relationship between flowering time and mean daily water use, b ‐ relationship between rosette biomass and mean daily water use, and c ‐ relationship between mean daily water use and mPWU. The linear model of the relationship between mean long‐term water use and mean daily water use is provided. R2 and P values are provided where a significant relationship was identified.
Figure S9: Phenotype of NILs and parental lines. a ‐ boxplots of leaf level WUE (δ13C) for the 4 groups based on allelic combination of both FRI and FLC in the NILs and both parents. The letters (a, b) denote the post‐hoc Games‐Howell groups, where allelic groups whose letters are different are significantly different from one another for that trait at P < 0.05. The bold line in the centre of the boxplots represents the median, the box edges represent the 25th (lower) and 75th (upper) percentiles, the whiskers extend to the most extreme data points that are no more than 1.5x the length of the upper or lower segment. Outliers are data points that lie outside the 1.5x interquartile range both above the upper quartile and below the lower quartile, b ‐ phenotype scoring based on rosette growth (panel C), stomatal conductance (gs) and δ13C measurements. There was a significant negative correlation between gs and δ13C. r2 = 0.781, P < 0.001, c ‐ relationship between δ13C and flowering time, and d ‐ rosette growth at 25 days post sowing.
Figure S10: Boxplots of drought response parameters derived from segmented regression analysis based on allelic combinations of FRI/FLC. a ‐ dehydration plasticity (see Table 1), and b ‐ breakpoint (rSWC) between segment 1 and 2. Both parameters were calculated using predicted means of the short dehydration experiment performed on the RIL population. No significant differences were detected between the four allelic combinations. The bold line in the centre of the boxplots represents the median, the box edges represent the 25th (lower) and 75th (upper) percentiles, the whiskers extend to the most extreme data points that are no more than 1.5x the length of the upper or lower segment. Outliers are data points that lie outside the 1.5x interquartile range both above the upper quartile and below the lower quartile.
Figure S11: Boxplots of biomass parameters based on allelic combinations of FRI/FLC in the NILs a – above ground biomass, b – seed biomass, and c – rosette biomass. The letters (a, b, and c) above the boxplot denote the post‐hoc Tukey groups, where allelic groups whose letters are different are significantly different from one another for that trait at P < 0.05. The bold line in the centre of the boxplots represents the median, the box edges represent the 25th (lower) and 75th (upper) percentiles, the whiskers extend to the most extreme data points that are no more than 1.5x the length of the upper or lower segment. Outliers are data points that lie outside the 1.5x interquartile range both above the upper quartile and below the lower quartile.
Figure S12: Above ground biomass allocation. a ‐ biomass distribution in the NILs of moderate drought stressed plants. b ‐ biomass distribution in 164 RILs including both parents.
Table S1: Ecotypes used in benchmarking experiment
Table S2: RIL genotypes according to Tjörék et al. (2006)
Table S3: Primers used in genotyping and qPCR
Table S4: Genotyping of FRI and FLC alleles in RIL population using InDel markers, scored by qPCR and high‐resolution melt (HRM) curve.
Table S5: Genotypes of near isogenic lines (NILs)
Table S6: Correlation matrix of traits analysed for the 12 ecotypes population
Table S7: Correlation matrix of traits analysed for the RIL population
Table S8: Number of differentially expressed protein coding genes in mapping intervals
Table S9: IDs of differentially expressed genes in mapping intervals
Table S10: Fold expression and error (Line/Col‐0) of selected DE genes in three mapping intervals at 26‐ and 43 days post germination (n = 3).
Table S11: Association between gene expression and mPWU and flowering time (Flowering). Genes FLOWERING LOCUS T (FT), FRI, FLC and At4g00960.
ACKNOWLEDGEMENTS
We thank Susan Corbett and Philip M Mullineaux for help with the continuous moderate drought experiments. J. N. F was funded by a BBSRC CASE award (BB/J012564/1). U. B. is supported by the University of Essex. J. N. F. and U. B. performed and analysed all experiments. O. B and R. M provided and analysed plant material, including the RIL and NIL populations. U. B., J. N. F., and M. H. planned and designed the experiments. U. B. and J. N. F wrote the manuscript with the input from all authors. Isotopic measurements were performed by C. Hossann at the Plateforme Technique d'Ecologie Fonctionnelle (PTEF) (OC 081, INRA Nancy, France).
Ferguson JN, Meyer RC, Edwards KD, Humphry M, Brendel O, Bechtold U. Accelerated flowering time reduces lifetime water use without penalizing reproductive performance in Arabidopsis. Plant Cell Environ. 2019;42:1847–1867. 10.1111/pce.13527
REFERENCES
- Ågren, J. , Oakley, C. G. , Lundemo, S. , & Schemske, D. W. (2017). Adaptive divergence in flowering time among natural populations of Arabidopsis thaliana: Estimates of selection and QTL mapping. Evolution, 71, 550–564. 10.1111/evo.13126 [DOI] [PubMed] [Google Scholar]
- Albihlal, W. S. , Chernukhin, I. , Blein, T. , Persad, R. , Obomighie, I. Crespi, M. , … Mullineaux, P. M. (2018). Arabidopsis Heat Shock Transcription Factor A1b regulates multiple developmental genes under growth and stress conditions. Journal of Experimental Botany, 69, 2847–2862. [DOI] [PMC free article] [PubMed] [Google Scholar]
- Anderson, J. T. (2016). Plant fitness in a rapidly changing world. New Phytologist, 210, 81–87. 10.1111/nph.13693 [DOI] [PubMed] [Google Scholar]
- Araus, J. L. , Slafer, G. A. , Reynolds, M. P. , & Royo, C. (2002). Plant breeding and drought in C3 cereals: What should we breed for? Annals of Botany, 89, 925–940. 10.1093/aob/mcf049 [DOI] [PMC free article] [PubMed] [Google Scholar]
- Austen, E. J. , Rowe, L. , Stinchcombe, J. R. , & Forrest, J. R. K. (2017). Explaining the apparent paradox of persistent selection for early flowering. New Phytologist, 215, 929–934. 10.1111/nph.14580 [DOI] [PubMed] [Google Scholar]
- Bac‐Molenaar, J. A. , Fradin, E. F. , Becker, F. F. M. , Rienstra, J. A. , van der Schoot, J. , Vreugdenhil, D. , & Keurentjes, J. J. B. (2015). Genome‐wide association mapping of fertility reduction upon heat stress reveals developmental stage‐specific QTLs in Arabidopsis thaliana . The Plant Cell, 27, 1857–1874. 10.1105/tpc.15.00248 [DOI] [PMC free article] [PubMed] [Google Scholar]
- Bechtold, U. , Albihlal, W. S. , Lawson, T. , Fryer, M. J. , Sparrow, P. A. C. , Richard, F. F. , … Mullineaux, P. M. (2013). Arabidopsis HEAT SHOCK TRANSCRIPTION FACTORA1b overexpression enhances water productivity, resistance to drought, and infection. Journal of Experimental Botany, 64, 3467–3481. 10.1093/jxb/ert185 [DOI] [PMC free article] [PubMed] [Google Scholar]
- Bechtold, U. , Ferguson, J. N. , & Mullineaux, P. M. (2018). To defend or to grow: Lessons from Arabidopsis C24. Journal of Experimental Botany, 69, 2809–2821. [DOI] [PubMed] [Google Scholar]
- Bechtold, U. , Lawson, T. , Mejia‐Carranza, J. , Meyer, R. C. , Brown, I. R. , Altmann, T. , … Mullineaux, P. M. (2010). Constitutive salicylic acid defences do not compromise seed yield, drought tolerance and water productivity in the Arabidopsis accession C24. Plant, Cell and Environment, 33, 1959–1973. 10.1111/j.1365-3040.2010.02198.x [DOI] [PubMed] [Google Scholar]
- Bechtold, U. , Penfold, C. A. , Jenkins, D. J. , Legaie, R. , Moore, J. D. , Lawson, T. , … Mullineaux, P. M. (2016). Time‐series transcriptomics reveals that AGAMOUS‐LIKE22 affects primary metabolism and developmental processes in drought‐stressed Arabidopsis. The Plant Cell, 28, 345–366. 10.1105/tpc.15.00910 [DOI] [PMC free article] [PubMed] [Google Scholar]
- Bechtold, U. , Richard, O. , Zamboni, A. , Gapper, C. , Geisler, M. , Pogson, B. , … Mullineaux, P. M. (2008). Impact of chloroplastic‐ and extracellular‐sourced ROS on high light‐responsive gene expression in Arabidopsis. Journal of Experimental Botany, 59, 121–133. 10.1093/jxb/erm289 [DOI] [PubMed] [Google Scholar]
- Blum, A. (2005). Drought resistance, water‐use efficiency, and yield potential—Are they compatible, dissonant, or mutually exclusive? Australian Journal of Agricultural Research, 56, 1159–1168. 10.1071/AR05069 [DOI] [Google Scholar]
- Blum, A. (2009). Effective use of water (EUW) and not water‐use efficiency (WUE) is the target of crop yield improvement under drought stress. Field Crops Research, 112, 119–123. 10.1016/j.fcr.2009.03.009 [DOI] [Google Scholar]
- Bouchabke‐Coussa, O. , Quashie, M.‐L. , Seoane‐Redondo, J. , Fortabat, M.‐N. , Gery, C. , Yu, A. , … Durand‐Tardif, M. (2008). ESKIMO1 is a key gene involved in water economy as well as cold acclimation and salt tolerance. BMC Plant Biology, 8, 125 10.1186/1471-2229-8-125 [DOI] [PMC free article] [PubMed] [Google Scholar]
- Boyes, D. C. , Zayed, A. M. , Ascenzi, R. , Mccaskill, A. J. , Hoffman, N. E. , Davis, K. R. , & Görlach, J. (2001). Growth stage–based phenotypic analysis of Arabidopsis: A model for high throughput functional genomics in plants. The Plant Cell, 13(7), 1499–1510. [DOI] [PMC free article] [PubMed] [Google Scholar]
- Brendel, O. , Le Thiec, D. , Scotti‐Saintagne, C. , Bodns, C. , Kremer, A. , & Guehl, J. M. (2008). Quantitative trait loci controlling water use efficiency and related traits in Quercus robur L. Trees Genetics & Genomes, 4, 263–278. 10.1007/s11295-007-0107-z [DOI] [Google Scholar]
- Broman, K. W. , & Sen, Ś. (2009). A Guide to QTL Mapping with R/qtl. New York: Springer. [Google Scholar]
- Broman, K. W. , Wu, H. , Sen, Ś. , & Churchill, G. A. (2003). R/qtl: QTL mapping in experimental crosses. Bioinformatics, 19, 889–890. 10.1093/bioinformatics/btg112 [DOI] [PubMed] [Google Scholar]
- Brosché, M. , Merilo, E. , Mayer, F. , Pechter, P. , Puzõrjova, I. , Brader, G. , … Kollist, H. (2010). Natural variation in ozone sensitivity among Arabidopsis thaliana accessions and its relation to stomatal conductance. Plant, Cell and Environment, 33, 914–925. 10.1111/j.1365-3040.2010.02116.x [DOI] [PubMed] [Google Scholar]
- Caicedo, A. L. , Stinchcombe, J. R. , Olsen, K. M. , Schmitt, J. , & Purugganan, M. D. (2004). Epistatic interaction between Arabidopsis FRI and FLC flowering time genes generates a latitudinal cline in a life history trait. Proceedings of the National Academy of Sciences., 101, 15670–15675. 10.1073/pnas.0406232101 [DOI] [PMC free article] [PubMed] [Google Scholar]
- Cernusak, L. A. , Ubierna, N. , Winter, K. , Holtum, J. A. M. , Marshall, J. D. , & Farquhar, G. D. (2013). Environmental and physiological determinants of carbon isotope discrimination in terrestrial plants. New Phytologist, 200, 950–965. 10.1111/nph.12423 [DOI] [PubMed] [Google Scholar]
- Cernusak, L. A. , Winter, K. , & Turner, B. L. (2009). Physiological and isotopic (delta(13)C and delta(18)O) responses of three tropical tree species to water and nutrient availability. Plant, Cell and Environment, 32, 1441–1455. 10.1111/j.1365-3040.2009.02010.x [DOI] [PubMed] [Google Scholar]
- Claeys, H. , Inze, D. , & Inzé, D. (2013). The agony of choice: How plants balance growth and survival under water‐limiting conditions. Plant Physiology, 162, 1768–1779. 10.1104/pp.113.220921 [DOI] [PMC free article] [PubMed] [Google Scholar]
- Comstock, J. P. , McCouch, S. R. , Martin, B. C. , Tauer, C. G. , Vision, T. J. , Xu, Y. , & Pausch, R. C. (2005). The effects of resource availability and environmental conditions on genetic rankings for carbon isotope discrimination during growth in tomato and rice. Functional Plant Biology, 32, 1089–1105. 10.1071/FP05117 [DOI] [PubMed] [Google Scholar]
- Condon, A. G. , Richards, R. A. , Rebetzke, G. J. , & Farquhar, G. D. (2004). Breeding for high water‐use efficiency. Journal of Experimental Botany, 55, 2447–2460. 10.1093/jxb/erh277 [DOI] [PubMed] [Google Scholar]
- Craig, H. (1957). Isotopic standards for carbon and oxygen and correction factors for mass‐spectrometric analysis of carbon dioxide. Geochimica et Cosmochimica Acta, 12, 133–149. 10.1016/0016-7037(57)90024-8 [DOI] [Google Scholar]
- Czyz, E. A. , & Dexter, A. R. (2012). Plant wilting can be caused either by the plant or by the soil. Soil Research, 50, 708–713. 10.1071/SR12189 [DOI] [Google Scholar]
- Davies, R. B. (2002). Hypothesis testing when a nuisance parameter is present only under the alternative: Linear model case. Biometrika, 89, 484–489. [Google Scholar]
- Deng, W. , Ying, H. , Helliwell, C. A. , Taylor, J. M. , Peacock, W. J. , & Dennis, E. S. (2011). FLOWERING LOCUS C (FLC) regulates development pathways throughout the life cycle of Arabidopsis. Proceedings of the National Academy of Sciences., 108, 6680–6685. 10.1073/pnas.1103175108 [DOI] [PMC free article] [PubMed] [Google Scholar]
- Donovan, L. A. , Dudley, S. A. , Rosenthal, D. M. , & Ludwig, F. (2007). Phenotypic selection on leaf water use efficiency and related ecophysiological traits for natural populations of desert sunflowers. Oecologia, 152, 13–25. 10.1007/s00442-006-0627-5 [DOI] [PubMed] [Google Scholar]
- Easlon, H. M. , Nemali, K. S. , Richards, J. H. , Hanson, D. T. , Juenger, T. E. , & McKay, J. K. (2014). The physiological basis for genetic variation in water use efficiency and carbon isotope composition in Arabidopsis thaliana. Photosynthesis Research, 119, 119–129. 10.1007/s11120-013-9891-5 [DOI] [PMC free article] [PubMed] [Google Scholar]
- Edwards, K. D. , Anderson, P. E. , Hall, A. , Salathia, N. S. , Locke, J. C. W. Lynn, J. R. , … Millar, A. J. (2006). FLOWERING LOCUS C mediates natural variation in the high‐temperature response of the Arabidopsis circadian clock. The Plant cell, 18, 639–650. [DOI] [PMC free article] [PubMed] [Google Scholar]
- Falik, O. , Reides, P. , Gersani, M. , & Novoplansky, A. (2005). Root navigation by self inhibition. Plant, Cell and Environment, 28, 562–569. 10.1111/j.1365-3040.2005.01304.x [DOI] [Google Scholar]
- Farquhar, G. D. , Ehleringer, J. R. , & Hubick, K. T. (1989). Carbon isotope discrimination and photosynthesis. Annual Review of Plant Physiology and Plant Molecular Biology, 40, 503–537. 10.1146/annurev.pp.40.060189.002443 [DOI] [Google Scholar]
- Farquhar, G. D. , & Von Caemmerer, S. (1982). Modelling of photosynthetic response to environmental conditions In Encyclopedia of Plant Physiology (pp. 549–587). Berlin, Heidelberg: Springer. [Google Scholar]
- Ferguson, J. N. , Humphry, M. , Lawson, T. , Brendel, O. , & Bechtold, U. (2018). Natural variation of life‐history traits, water use, and drought responses in Arabidopsis. Plant Direct, 2, e00035 10.1002/pld3.35 [DOI] [PMC free article] [PubMed] [Google Scholar]
- Gazzani, S. , Gendall, A. R. , Lister, C. , & Dean, C. (2003). Analysis of the molecular basis of flowering time variation in Arabidopsis accessions. Plant Physiology, 132, 1107–1114. 10.1104/pp.103.021212 [DOI] [PMC free article] [PubMed] [Google Scholar]
- Gechev, T. S. , Dinakar, C. , Benina, M. , Toneva, V. , & Bartels, D. (2012). Molecular mechanisms of desiccation tolerance in resurrection plants. Cellular and Molecular Life Sciences, 69, 3175–3186. 10.1007/s00018-012-1088-0 [DOI] [PMC free article] [PubMed] [Google Scholar]
- Ghandilyan, A. , Ilk, N. , Hanhart, C. , Mbengue, M. , Barboza, L. , Schat, H. , … Aarts, M. G. M. (2009). A strong effect of growth medium and organ type on the identification of QTLs for phytate and mineral concentrations in three arabidopsis thaliana RIL populations. Journal of Experimental Botany, 60, 1409–1425. 10.1093/jxb/erp084 [DOI] [PubMed] [Google Scholar]
- Gilbert, M. E. , Holbrook, N. M. , Zwieniecki, M. A. , Sadok, W. , & Sinclair, T. R. (2011). Field confirmation of genetic variation in soybean transpiration response to vapor pressure deficit and photosynthetic compensation. Field Crops Research, 124, 85–92. 10.1016/j.fcr.2011.06.011 [DOI] [Google Scholar]
- Gnan, S. , Marsh, T. , & Kover, P. X. (2017). Inflorescence photosynthetic contribution to fitness releases Arabidopsis thaliana plants from trade‐off constraints on early flowering. PLoS ONE, 12, e0185835 10.1371/journal.pone.0185835 [DOI] [PMC free article] [PubMed] [Google Scholar]
- Granier, C. , & Tardieu, F. (2009). Multi‐scale phenotyping of leaf expansion in response to environmental changes: The whole is more than the sum of parts. Plant, Cell and Environment, 32, 1175–1184. 10.1111/j.1365-3040.2009.01955.x [DOI] [PubMed] [Google Scholar]
- Gruber, F. , Falkner, F. G. , Dorner, F. , & Hämmerle, T. (2001). Quantitation of viral DNA by real‐time PCR applying duplex amplification, internal standardization, and two‐color fluorescence detection. Applied and Environmental Microbiology, 67, 2837–2839. 10.1128/AEM.67.6.2837-2839.2001 [DOI] [PMC free article] [PubMed] [Google Scholar]
- Halperin, O. , Gebremedhin, A. , Wallach, R. , & Moshelion, M. (2017). High‐throughput physiological phenotyping and screening system for the characterization of plant‐environment interactions. Plant Journal, 89, 839–850. 10.1111/tpj.13425 [DOI] [PubMed] [Google Scholar]
- Hausmann, N. J. , Juenger, T. E. , Sen, S. , Stowe, K. A. , Dawson, T. E. , & Simms, E. L. (2005). Quantitative trait loci affecting δ13C and response to differential water availibility in Arabidopsis thaliana . Evolution, 59, 81–96. [PubMed] [Google Scholar]
- Helliwell, C. A. , Wood, C. C. , Robertson, M. , James Peacock, W. , & Dennis, E. S. (2006). The Arabidopsis FLC protein interacts directly in vivo with SOC1 and FT chromatin and is part of a high‐molecular‐weight protein complex. Plant Journal, 46, 183–192. 10.1111/j.1365-313X.2006.02686.x [DOI] [PubMed] [Google Scholar]
- Hepworth, S. R. , Valverde, F. , Ravenscroft, D. , Mouradov, A. , & Coupland, G. (2002). Antagonistic regulation of flowering‐time gene SOC1 by CONSTANS and FLC via separate promoter motifs. EMBO Journal, 21, 4327–4337. 10.1093/emboj/cdf432 [DOI] [PMC free article] [PubMed] [Google Scholar]
- Johanson, U. , West, J. , Lister, C. , Michaels, S. , Amasino, R. , & Dean, C. (2000). Molecular analysis of FRÍGIDA, a major determinant of natural variation in Arabidopsis flowering time. Science, 290, 344–348. 10.1126/science.290.5490.344 [DOI] [PubMed] [Google Scholar]
- Juenger, T. E. , Mckay, J. K. , Hausmann, N. , Keurentjes, J. J. B. , & Sen, S. (2005). Identification and characterization of QTL underlying whole‐plant physiology in Arabidopsis thaliana: d 13 C, stomatal conductance and transpiration efficiency. Plant Cell and Environment, 28, 697–708. 10.1111/j.1365-3040.2004.01313.x [DOI] [Google Scholar]
- Kenney, A. M. , Mckay, J. K. , Richards, J. H. , & Juenger, T. E. (2014). Direct and indirect selection on flowering time, water‐use efficiency (WUE, ??13C), and WUE plasticity to drought in Arabidopsis thaliana . Ecology and Evolution, 4, 4505–4521. 10.1002/ece3.1270 [DOI] [PMC free article] [PubMed] [Google Scholar]
- Koornneef, M. , Blankestijn‐de, V. H. , Hanhart, C. , Soppe, W. , & Peeters, T. (1994). The phenotype of some late‐flowering mutants is enhanced by a locus on chromosome 5 that is not effective in the Landsberg erecta wild‐type. The Plant Journal, 6, 911–919. 10.1046/j.1365-313X.1994.6060911.x [DOI] [Google Scholar]
- Kooyers, N. J. (2015). The evolution of drought escape and avoidance in natural herbaceous populations. Plant Science, 234, 155–162. 10.1016/j.plantsci.2015.02.012 [DOI] [PubMed] [Google Scholar]
- Kooyers, N. J. , Greenlee, A. B. , Colicchio, J. M. , Oh, M. , & Blackman, B. K. (2015). Replicate altitudinal clines reveal that evolutionary flexibility underlies adaptation to drought stress in annual Mimulus guttatus. New Phytologist, 206, 152–165. 10.1111/nph.13153 [DOI] [PubMed] [Google Scholar]
- Lander, E. S. , & Green, P. (1991). Counting algorithms for linkage: correction to Morton and Collins. Annals of Human Genetics, 55, 33–38. 10.1111/j.1469-1809.1991.tb00395.x [DOI] [PubMed] [Google Scholar]
- Lapin, D. , Meyer, R. C. , Takahashi, H. , Bechtold, U. , & Van den Ackerveken, G. (2012). Broad‐spectrum resistance of Arabidopsis C24 to downy mildew is mediated by different combinations of isolate‐specific loci. New Phytologist, 196, 1171–1181. 10.1111/j.1469-8137.2012.04344.x [DOI] [PubMed] [Google Scholar]
- Lee, I. , Michaels, S. D. , Masshardt, A. S. , & Amasino, R. M. (1994). The late‐flowering phenotype of FRIGIDA and mutations in LUMINIDEPENDENS is suppressed in the Landsberg erecta strain of Arabidopsis. The Plant Journal, 6, 903–909. 10.1046/j.1365-313X.1994.6060903.x [DOI] [Google Scholar]
- Lempe, J. , Balasubramanian, S. , Sureshkumar, S. , Singh, A. , Schmid, M. , & Weigel, D. (2005). Diversity of flowering responses in wild Arabidopsis thaliana strains. PLoS Genetics, 1, 0109–0118. [DOI] [PMC free article] [PubMed] [Google Scholar]
- Levitt, J. (1985). Relationship of dehydration rate to drought avoidance, dehydration tolerance and dehydration avoidance of cabbage leaves, and to their acclimation during drought‐induced water stress. Plant, Cell and Environment, 8, 287–296. [Google Scholar]
- Long, S. P. , Marshall‐Colon, A. , & Zhu, X. G. (2015). Meeting the global food demand of the future by engineering crop photosynthesis and yield potential. Cell, 161, 56–66. 10.1016/j.cell.2015.03.019 [DOI] [PubMed] [Google Scholar]
- Loudet, O. , Chaillou, S. , Camilleri, C. , Bouchez, D. , & Daniel‐Vedele, F. (2002). Bay‐0 x Shahdara recombinant inbred line population: A powerful tool forthe genetic dissection of complex traits in Arabidopsis. Theoretical and Applied Genetics, 104, 1173–1184. [DOI] [PubMed] [Google Scholar]
- Loudet, O. , Chaillou, S. , Krapp, A. , & Daniel‐Vedele, F. (2003). Quantitative trait loci analysis of water and anion contents in interaction with nitrogen availability in Arabidopsis thaliana. Genetics, 163, 711–722. [DOI] [PMC free article] [PubMed] [Google Scholar]
- Lovell, J. T. , Juenger, T. E. , Michaels, S. D. , Lasky, J. R. , Platt, A. , Richards, J. H. , … Mckay, J. K. (2013). Pleiotropy of FRIGIDA enhances the potential for multivariate adaptation. Proceedings of the Royal Society B: Biological Sciences, 280 20131043. 10.1098/rspb.2013.1043 [DOI] [PMC free article] [PubMed] [Google Scholar]
- Lovell, J. T. , Mullen, J. L. , Lowry, D. B. , Awole, K. , Richards, J. H. , Sen, S. , … McKay, J. K. (2015). Exploiting differential gene expression and epistasis to discover candidate genes for drought‐associated QTLs in Arabidopsis thaliana . The Plant Cell, 27, 969–983. 10.1105/tpc.15.00122 [DOI] [PMC free article] [PubMed] [Google Scholar]
- Ludlow, M. M. (1989). Strategies of response to water stress In Kreeb K. H., Richter H., & Hinckley T. M. (Eds.), Structural and functional responses to environmental Stresses: Water shortage (pp. 269–281). Hague: SPB Academic Publishing. [Google Scholar]
- Lynch, M. , & Walsh, B. (1998). Genetics and analysis of quantitative traits (p. 980). Sunderland: Sinauer Associates. [Google Scholar]
- Manichaikul, A. , Moon, J. Y. , Sen, S. , Yandell, B. S. , & Broman, K. W. (2009). A model selection approach for the identification of quantitative trait loci in experimental crosses, allowing epistasis. Genetics, 181, 1077–1086. 10.1534/genetics.108.094565 [DOI] [PMC free article] [PubMed] [Google Scholar]
- Marguerit, E. , Bouffier, L. , Chancerel, E. , Costa, P. , Lagane, F. , Guehl, J. M. , … Brendel, O. (2014). The genetics of water‐use efficiency and its relation to growth in maritime pine. Journal of Experimental Botany, 65, 4757–4768. 10.1093/jxb/eru226 [DOI] [PMC free article] [PubMed] [Google Scholar]
- Masle, J. , Gilmore, S. R. , & Farquhar, G. D. (2005). The ERECTA gene regulates plant transpiration efficiency in Arabidopsis. Nature, 436, 866–870. 10.1038/nature03835 [DOI] [PubMed] [Google Scholar]
- McKay, J. K. , Richards, J. H. , & Mitchell‐Olds, T. (2003). Genetics of drought adaptation in Arabidopsis thaliana: I. Pleiotropy contributes to genetic correlations among ecological traits. Molecular Ecology, 12, 1137–1151. 10.1046/j.1365-294X.2003.01833.x [DOI] [PubMed] [Google Scholar]
- McKay, J. K. , Richards, J. H. , Nemali, K. S. , Sen, S. , Mitchell‐Olds, T. , Boles, S. , … Juenger, T. E. (2008). Genetics of drought adaptation in Arabidopsis thaliana II. QTL analysis of a new mapping population, Kas‐1 x Tsu‐1. Evolution, 62, 3014–3026. 10.1111/j.1558-5646.2008.00474.x [DOI] [PubMed] [Google Scholar]
- Medrano, H. , Tomás, M. , Martorell, S. , Flexas, J. , Hernández, E. , Rosselló, J. , … Bota, J. (2015). From leaf to whole‐plant water use efficiency (WUE) in complex canopies: Limitations of leaf WUE as a selection target. Crop Journal, 3, 220–228. 10.1016/j.cj.2015.04.002 [DOI] [Google Scholar]
- Meinzer, F. , Goldstein, G. , & Jaimes, M. (1984). The effect of atmospheric humidity on stomatal control of gas exchange in two tropical coniferous species. Canadian Journal of Botany, 62, 591–595. 10.1139/b84-089 [DOI] [Google Scholar]
- Michaels, S. D. , & Amasino, R. M. (1999). FLOWERING LOCUS C encodes a novel MADS domain protein that acts as a repressor of flowering. The Plant Cell, 11, 949–956. 10.1105/tpc.11.5.949 [DOI] [PMC free article] [PubMed] [Google Scholar]
- Michaels, S. D. , & Amasino, R. M. (2001). Loss of FLOWERING LOCUS C activity eliminates the late‐flowering phenotype of FRIGIDA and autonomous pathway mutations but not responsiveness to vernalization. The Plant Cell, 13, 935–941. 10.1105/tpc.13.4.935 [DOI] [PMC free article] [PubMed] [Google Scholar]
- Michaels, S. D. , He, Y. , Scortecci, K. C. , & Amasino, R. M. (2003). Attenuation of FLOWERING LOCUS C activity as a mechanism for the evolution of summer‐annual flowering behavior in Arabidopsis. Proceedings of the National Academy of Sciences of the United States of America, 100, 10102–10107. 10.1073/pnas.1531467100 [DOI] [PMC free article] [PubMed] [Google Scholar]
- Monclus, R. , Dreyer, E. , Villar, M. , Delmotte, F. M. , Delay, D. , Petit, J. M. , … Brignolas, F. (2006). Impact of drought on productivity and water use efficiency in 29 genotypes of Populus deltoids × Populus nigra. New Phytologist, 169, 765–777. 10.1111/j.1469-8137.2005.01630.x [DOI] [PubMed] [Google Scholar]
- Monneveux, P. , Sánchez, C. , Beck, D. , & Edmeades, G. O. (2006). Drought tolerance improvement in tropical maize source populations: Evidence of progress. Crop Science, 46, 180–191. 10.2135/cropsci2005.04-0034 [DOI] [Google Scholar]
- Morison, J. I. L. , Baker, N. R. , Mullineaux, P. M. , & Davies, W. J. (2008). Improving water use in crop production. Philosophical Transactions of the Royal Society of London. Series B, Biological Sciences, 363, 639–658. 10.1098/rstb.2007.2175 [DOI] [PMC free article] [PubMed] [Google Scholar]
- Muggeo, M. V. M. R. (2017). Package ‘segmented’. Biometrika, 58, 525–534. [Google Scholar]
- Oliveros J.C. (2007) VENNY. An interactive tool for comparing lists with Venn diagrams. BioinfoGP of CNB‐CSIC, http://bioinfogp.cnnb.csic.es/tools/venny/index.ht.
- Parry, M. A. J. , Flexas, J. , & Medrano, H. (2005). Prospects for crop production under drought: Research priorities and future directions. Annals of Applied Biology, 147, 211–226. 10.1111/j.1744-7348.2005.00032.x [DOI] [Google Scholar]
- Parsons, R. , Weyers, J. D. B. , Lawson, T. , & Godber, I. M. (1997). Rapid and straightforward estimates of photosynthetic characteristics using a portable gas exchange system. Photosynthetica, 34, 265–279. 10.1023/A:1006800909651 [DOI] [Google Scholar]
- Passioura, J. (2007). The drought environment: Physical, biological and agricultural perspectives. Journal of Experimental Botany, 58, 113–117. 10.1093/jxb/erl212 [DOI] [PubMed] [Google Scholar]
- R Core Team (2015). R Development Core Team. R: A Language and Environment for Statistical Computing, 55, 275–286. [Google Scholar]
- Remington, D. L. , Leinonen, P. H. , Leppälä, J. , & Savolainen, O. (2013). Complex genetic effects on early vegetative development shape resource allocation differences between Arabidopsis lyrata populations. Genetics, 195, 1087–1102. 10.1534/genetics.113.151803 [DOI] [PMC free article] [PubMed] [Google Scholar]
- Riboni, M. , Galbiati, M. , Tonelli, C. , & Conti, L. (2013). GIGANTEA enables drought escape response via abscisic acid‐dependent activation of the florigens and SUPPRESSOR OF OVEREXPRESSION OF CONSTANS1. Plant Physiology, 162, 1706–1719. 10.1104/pp.113.217729 [DOI] [PMC free article] [PubMed] [Google Scholar]
- Riboni, M. , Robustelli, T. A. , Galbiati, M. , Tonelli, C. , & Conti, L. (2014). Environmental stress and flowering time: The photoperiodic connection. Plant Signaling & Behavior, 9, e29036 10.4161/psb.29036 [DOI] [PMC free article] [PubMed] [Google Scholar]
- Roussel, M. , Dreyer, E. , Montpied, P. , Le‐Provost, G. , Guehl, J. M. , & Brendel, O. (2009). The diversity of 13C isotope discrimination in a Quercus robur full‐sib family is associated with differences in intrinsic water use efficiency, transpiration efficiency, and stomatal conductance. Journal of Experimental Botany, 60, 2419–2431. 10.1093/jxb/erp100 [DOI] [PubMed] [Google Scholar]
- Sanda, S. L. , & Amasino, R. M. (1996). Ecotype‐specific expression of a flowering mutant phenotype in Arabidopsis thaliana . Plant Physiology, 111, 641–644. 10.1104/pp.111.2.641 [DOI] [PMC free article] [PubMed] [Google Scholar]
- Seibt, U. , Rajabi, A. , Griffiths, H. , & Berry, J. A. (2008). Carbon isotopes and water use efficiency: Sense and sensitivity. Oecologia, 155, 441–454. 10.1007/s00442-007-0932-7 [DOI] [PubMed] [Google Scholar]
- Shen, H. , Zhong, X. , Zhao, F. , Wang, Y. , Yan, B. Li, Q. , … He, Z. (2015). Overexpression of receptor-like kinase ERECTA improves thermotolerance in rice and tomato. Nature Biotechnology, 33, 996–1003. [DOI] [PubMed] [Google Scholar]
- Sheldon, C. C. , Burn, J. E. , Perez, P. P. , Metzger, J. , Edwards, J. , Peacock, W. J. , & Dennis, E. S. (1999). The FLF MADS Box Gene: A repressor of flowering in Arabidopsis regulated by vernalization and methylation. The Plant Cell, 11, 445–458. 10.1105/tpc.11.3.445 [DOI] [PMC free article] [PubMed] [Google Scholar]
- Shindo, C. , Aranzana, M. J. , Lister, C. , Baxter, C. , Nicholls, C. , Nordborg, M. , & Dean, C. (2005). Role of FRIGIDA and FLOWERING LOCUS C in determining variation in flowering time of Arabidopsis. Plant Physiology, 138, 1163–1173. 10.1104/pp.105.061309 [DOI] [PMC free article] [PubMed] [Google Scholar]
- Sinclair, T. R. , & Rufty, T. W. (2012). Nitrogen and water resources commonly limit crop yield increases, not necessarily plant genetics. Global Food Security, 1, 94–98. 10.1016/j.gfs.2012.07.001 [DOI] [Google Scholar]
- Sletvold, N. , & Ågren, J. (2015). Climate‐dependent costs of reproduction: Survival and fecundity costs decline with length of the growing season and summer temperature. Ecology Letters, 18, 357–364. 10.1111/ele.12417 [DOI] [PubMed] [Google Scholar]
- Steduto, P. , Hsiao, T. C. , & Fereres, E. (2007). On the conservative behavior of biomass water productivity. Irrigation Science, 25, 189–207. [Google Scholar]
- Tisné, S. , Serrand, Y. , Bach, L. , Gilbault, E. , Ben Ameur, R. , Balasse, H. , … Loudet, O. (2013). Phenoscope: An automated large‐scale phenotyping platform offering high spatial homogeneity. Plant Journal, 74, 534–544. 10.1111/tpj.12131 [DOI] [PubMed] [Google Scholar]
- Törjék, O. , Meyer, R. C. , Zehnsdorf, M. , Teltow, M. , Strompen, G. , Witucka‐Wall, H. , … Altmann, T. (2008). Construction and analysis of 2 reciprocal arabidopsis introgression line populations. Journal of Heredity, 99, 396–406. 10.1093/jhered/esn014 [DOI] [PubMed] [Google Scholar]
- Törjék, O. , Witucka‐Wall, H. , Meyer, R. C. , Von Korff, M. , Kusterer, B. , Rautengarten, C. , & Altmann, T. (2006). Segregation distortion in Arabidopsis C24/Col‐0 and Col‐0/C24 recombinant inbred line populations is due to reduced fertility caused by epistatic interaction of two loci. Theoretical and Applied Genetics, 113, 1551–1561. 10.1007/s00122-006-0402-3 [DOI] [PubMed] [Google Scholar]
- Vadez, V. , Kholova, J. , Medina, S. , Kakkera, A. , & Anderberg, H. (2014). Transpiration efficiency: New insights into an old story. Journal of Experimental Botany, 65, 6141–6153. 10.1093/jxb/eru040 [DOI] [PubMed] [Google Scholar]
- Van Aken, O. , De Clercq, I. , Ivanova, A. , Law, S. R. , Van Breusegem, F. , Millar, A. H. , & Whelan, J. (2016). Mitochondrial and chloroplast stress responses are modulated in distinct touch and chemical inhibition phases. Plant Physiology, 171, 2150–2165. 10.1104/pp.16.00273 [DOI] [PMC free article] [PubMed] [Google Scholar]
- Villagarcia, H. , Morin, A. C. , Shpak, E. D. , & Khodakovskaya, M. V. (2012). Modification of tomato growth by expression of truncated ERECTA protein from Arabidopsis thaliana. Journal of Experimental Botany, 63, 6493–6504. [DOI] [PubMed] [Google Scholar]
- Verslues, P. E. , & Juenger, T. E. (2011). Drought, metabolites, and Arabidopsis natural variation: A promising combination for understanding adaptation to water‐limited environments. Current Opinion in Plant Biology, 14, 240–245. 10.1016/j.pbi.2011.04.006 [DOI] [PubMed] [Google Scholar]
- Vialet‐Chabrand, S. , Matthews, J. S. A. , Brendel, O. , Blatt, M. R. , Wang, Y. Hills, A. , … Lawson, T. (2016). Modelling water use efficiency in a dynamic environment: An example using Arabidopsis thaliana. Plant Science, 251, 65–74. [DOI] [PMC free article] [PubMed] [Google Scholar]
- Von Euler, T. , Ågren, J. , & Ehrlén, J. (2014). Environmental context influences both the intensity of seed predation and plant demographic sensitivity to attack. Ecology, 95, 495–504. 10.1890/13-0528.1 [DOI] [PubMed] [Google Scholar]
- Xu, E. , Vaahtera, L. , Hõrak, H. , Hincha, D. K. , Heyer, A. G. , & Brosché, M. (2015). Quantitative trait loci mapping and transcriptome analysis reveal candidate genes regulating the response to ozone in Arabidopsis thaliana. Plant, Cell and Environment, 38, 1418–1433. 10.1111/pce.12499 [DOI] [PubMed] [Google Scholar]
- Xu, M. Y. , Zhang, L. , Li, W. W. , Hu, X. L. , Wang, M. B. , Fan, Y. L. , … Wang, L. (2014). Stress‐induced early flowering is mediated by miR169 in Arabidopsis thaliana. Journal of Experimental Botany., 65, 89–101. 10.1093/jxb/ert353 [DOI] [PubMed] [Google Scholar]
Associated Data
This section collects any data citations, data availability statements, or supplementary materials included in this article.
Supplementary Materials
Figure S1. The single nucleotide polymorphism (SNP) markers used and their position on the re‐estimated linkage map. a ‐ InDel markers for FRI and FLC, used to score the C24 x Col‐0 RIL population, and b ‐ Position in cMs of all markers on the re‐estimated genetic map.
Figure S2. Comparison of leaf level water use efficiency and biomass level water use efficiency parameters. a ‐ b Relationship between δ13C, and whole plant water use efficiency parameters biomass level WUE parameters: TE (transpiration efficiency) and WP (water productivity) and c – d Relationship between WUE i, and whole plant water use efficiency parameters biomass level WUE parameters, TE and WP. The associations are not significant in all cases.
Figure S3. Distribution of estimated means for all traits assessed as part of the QTL mapping. a ‐ vegetative water use (VWU), b ‐ days to flowering, c ‐ seed biomass, d ‐ calculated lifetime plant water use (cPWU), e ‐ dehydration plasticity (VWU plasticity), and f ‐breakpoint (rSWC) of the segmented regression. For all traits, a Shaprio‐Wilk test of normality was performed on the estimated means of all RILs, where all traits demonstrated variation that was not significantly different from a normal distribution (P > 0.05). Green arrows indicate the position of C24 and red arrows indicate the position of Col‐0. The estimated means for the parental lines are also provided (Red – Col‐0, Green – C24)
Figure S4: Additional QTL mapping results. a ‐ LOD profiles for seed biomass, with no significant QTL detected, b ‐ LOD profiles for dehydration plasticity, with no significant QTL detected, c ‐ LOD profiles for breakpoint (rSWC), with no significant QTL detected, and d – LOD profiles for slope 1, with one significant QTL detected. The dashed horizontal red line indicates the 0.05 genome‐wide significance threshold.
Figure S5: Single QTL mapping for calculated plant water use with and without traits as covariates. a – Without a trait covariate. b – With rosette biomass as a trait covariate. c – With flowering time as a trait covariate. d‐ With vegetative water use as a covariate.
Figure S6: LOD scores for a two‐dimensional genome scan for calculated plant water use. Values in the upper left triangle represent the full QTL model. Values on the lower right triangle represent the likelihood ratio comparing the full model with QTLs on all chromosomes with the single QTL model, thus indicating the presence of epistatic interactions.
Figure S7: Trait performances of genotypes harbouring different allelic combinations of the FRIGIDA (FRI) and FLOWERING LOCUS C (FLC) genes. Boxplots describing the variation for traits assessed for the 4 groups based on allelic combination of FRI and FLC, a – mPWU in the NILs, b ‐ days to flowering in the NILs, c ‐ VWU based on allelic combinations of FRI/FLC in the RILs, and d ‐ VWU based on allelic combinations of FRI/FLC in the NILs. The letters (a, b, and c) above the boxplot denote the post‐hoc Tukey groups, where allelic groups whose letters are different are significantly different from one another for that particular trait at P < 0.05. The bold line in the centre of the boxplots represents the median, the box edges represent the 25th (lower) and 75th (upper) percentiles, the whiskers extend to the most extreme data points that are no more than 1.5x the length of the upper or lower segment. Outliers are data points that lie outside the 1.5x interquartile range both above the upper quartile and below the lower quartile.
Figure S8: The contribution of mean daily water use in the 12 ecotypes. a ‐ relationship between flowering time and mean daily water use, b ‐ relationship between rosette biomass and mean daily water use, and c ‐ relationship between mean daily water use and mPWU. The linear model of the relationship between mean long‐term water use and mean daily water use is provided. R2 and P values are provided where a significant relationship was identified.
Figure S9: Phenotype of NILs and parental lines. a ‐ boxplots of leaf level WUE (δ13C) for the 4 groups based on allelic combination of both FRI and FLC in the NILs and both parents. The letters (a, b) denote the post‐hoc Games‐Howell groups, where allelic groups whose letters are different are significantly different from one another for that trait at P < 0.05. The bold line in the centre of the boxplots represents the median, the box edges represent the 25th (lower) and 75th (upper) percentiles, the whiskers extend to the most extreme data points that are no more than 1.5x the length of the upper or lower segment. Outliers are data points that lie outside the 1.5x interquartile range both above the upper quartile and below the lower quartile, b ‐ phenotype scoring based on rosette growth (panel C), stomatal conductance (gs) and δ13C measurements. There was a significant negative correlation between gs and δ13C. r2 = 0.781, P < 0.001, c ‐ relationship between δ13C and flowering time, and d ‐ rosette growth at 25 days post sowing.
Figure S10: Boxplots of drought response parameters derived from segmented regression analysis based on allelic combinations of FRI/FLC. a ‐ dehydration plasticity (see Table 1), and b ‐ breakpoint (rSWC) between segment 1 and 2. Both parameters were calculated using predicted means of the short dehydration experiment performed on the RIL population. No significant differences were detected between the four allelic combinations. The bold line in the centre of the boxplots represents the median, the box edges represent the 25th (lower) and 75th (upper) percentiles, the whiskers extend to the most extreme data points that are no more than 1.5x the length of the upper or lower segment. Outliers are data points that lie outside the 1.5x interquartile range both above the upper quartile and below the lower quartile.
Figure S11: Boxplots of biomass parameters based on allelic combinations of FRI/FLC in the NILs a – above ground biomass, b – seed biomass, and c – rosette biomass. The letters (a, b, and c) above the boxplot denote the post‐hoc Tukey groups, where allelic groups whose letters are different are significantly different from one another for that trait at P < 0.05. The bold line in the centre of the boxplots represents the median, the box edges represent the 25th (lower) and 75th (upper) percentiles, the whiskers extend to the most extreme data points that are no more than 1.5x the length of the upper or lower segment. Outliers are data points that lie outside the 1.5x interquartile range both above the upper quartile and below the lower quartile.
Figure S12: Above ground biomass allocation. a ‐ biomass distribution in the NILs of moderate drought stressed plants. b ‐ biomass distribution in 164 RILs including both parents.
Table S1: Ecotypes used in benchmarking experiment
Table S2: RIL genotypes according to Tjörék et al. (2006)
Table S3: Primers used in genotyping and qPCR
Table S4: Genotyping of FRI and FLC alleles in RIL population using InDel markers, scored by qPCR and high‐resolution melt (HRM) curve.
Table S5: Genotypes of near isogenic lines (NILs)
Table S6: Correlation matrix of traits analysed for the 12 ecotypes population
Table S7: Correlation matrix of traits analysed for the RIL population
Table S8: Number of differentially expressed protein coding genes in mapping intervals
Table S9: IDs of differentially expressed genes in mapping intervals
Table S10: Fold expression and error (Line/Col‐0) of selected DE genes in three mapping intervals at 26‐ and 43 days post germination (n = 3).
Table S11: Association between gene expression and mPWU and flowering time (Flowering). Genes FLOWERING LOCUS T (FT), FRI, FLC and At4g00960.