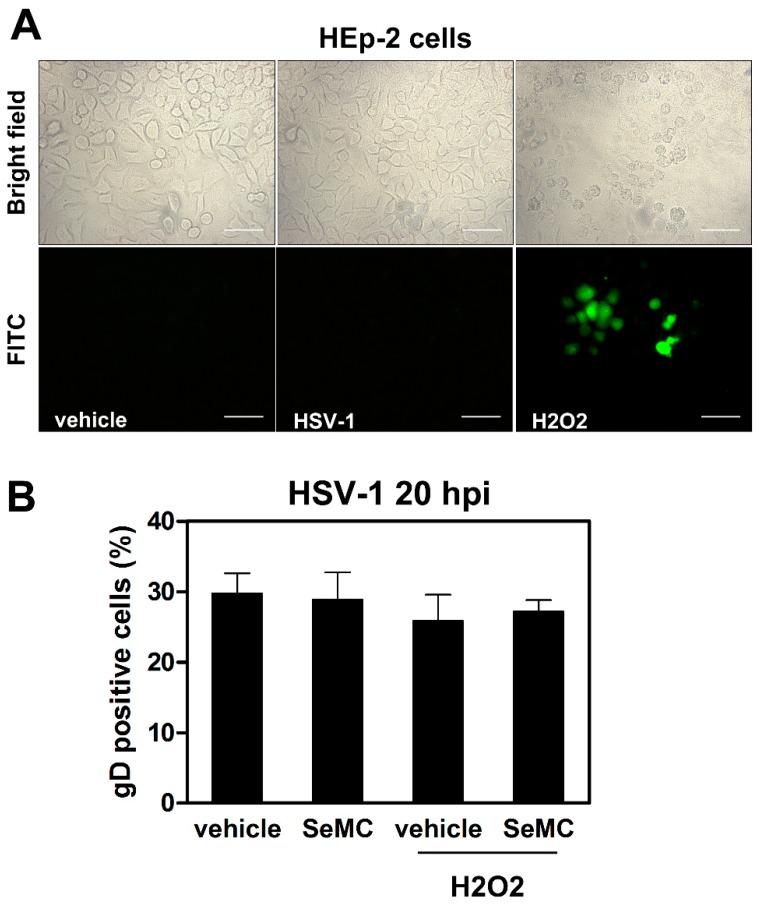
Figure 10.
ROS modulation in HEp-2 cells infected by HSV-1. (A) Fluorescence microscopic analysis of cells preloaded with DCFH-DA before exposure to HSV-1 (MOI = 10 PFU/cell) for 2 h or treatment with 5 µM of H2O2 for 30 min. Objective: 40×. Scale bar = 50 μm. (B) Evaluation of gD-HSV-1 expressing cells by immunofluorescence microscopy analysis of cells cultured with vehicle or SeMC (20 µM) for 48 h and then treated or not with H2O2 (5 µM) for 30 min before infection with HSV-1 (MOI = 0.5 PFU/cell). Cells were collected at 20 h post infection. Analysis by IFA is expressed as % positive cells (mean + S.D.) calculated from 10 different fields per conditions of two independent experiments. No statistically significant differences were found between different conditions.

