

Abstract
In vivo multicolor imaging is important for monitoring multiple biomolecular or cellular processes in biology. 19F magnetic resonance imaging (MRI) is an emerging in vivo imaging technique because it can non‐invasively visualize 19F nuclei without endogenous background signals. Therefore, 19F MRI probes capable of multicolor imaging are in high demand. Herein, we report five types of perfluorocarbon‐encapsulated silica nanoparticles that show 19F NMR peaks with different chemical shifts. Three of the nanoprobes, which show spectrally distinct 19F NMR peaks with sufficient sensitivity, were selected for in vivo multicolor 19F MRI. The nanoprobes exhibited 19F MRI signals with three colors in a living mouse. Our in vivo multicolor system could be utilized for evaluating the effect of surface functional groups on the hepatic uptake in a mouse. This novel multicolor imaging technology will be a practical tool for elucidating in vivo biomolecular networks by 19F MRI.
Keywords: fluorine, imaging agents, magnetic resonance imaging, multicolor imaging, nanoparticles
Molecular imaging provides valuable insights into localizations and activities of targeted biomolecules. Especially, multicolor imaging methods are of great importance for revealing molecular interactions in living cells or animals. The most common multicolor imaging techniques, that is, fluorescence imaging utilizing spectrally distinct reporters such as fluorescent proteins or fluorescent dyes, have offered ways to visualize protein–protein or intercellular interactions.1 However, owing to the limited light penetration, it is difficult to non‐invasively visualize tissues at a depth below the submillimeter range by fluorescence‐based techniques. On the other hand, multicolor magnetic resonance imaging (MRI) probes have been developed because MRI non‐invasively provides images of deep tissues with excellent soft‐tissue contrast and superior spatial resolution.2 Especially, 19F MRI has received considerable attentions as a promising imaging modality that provides no endogenous background signal in animal bodies and a broad chemical shift range (>350 ppm) in 19F NMR spectroscopy.3 Efforts to develop small‐molecule or polymer‐based 19F MRI probes that show different 19F chemical shift peaks have resulted in the multicolor 19F MRI images of phantoms.4 However, in vivo application of such multicolor 19F MRI probes has not been achieved owing to the low sensitivities of the probes. In the past decade, perfluorocarbon (PFC)‐encapsulated nano‐emulsions have been utilized as 19F MRI contrast agents for in vivo imaging.5 19F chemical shift‐selective imaging using two different PFC‐encapsulated nano‐emulsions enabled imaging of stem cells and neuroinflammation in living mice.6 A key limitation for future development of multicolor PFC‐encapsulated nano‐emulsions is the difficulty of introducing functional groups to nano‐emulsion surface because nano‐emulsions are unstable in organic solvents. Therefore, multicolor 19F MRI techniques based on nano‐emulsions lack the practical methods to provide functions such as an on/off‐switch or a specific cell‐targeting ability to the probes. In addition, multicolor 19F MRI detection in living mice has been limited to dual colors.
Recently, we developed a multifunctional PFC‐based silica nanoparticle, termed FLAME (fluorine accumulated silica nanoparticle for MRI contrast enhancement) as a 19F MRI contrast agent.7 FLAME is made up of a liquid PFC core and a stable silica shell, which can be modified with various functional groups such as small molecules or peptides in organic solvents. Various biomedical applications such as detection of enzyme activities,8 cancer imaging,7 and drug delivery9 were achieved by using surface‐functionalized FLAMEs. Therefore, development of spectrally distinct PFC‐based silica nanoparticles was expected to give rise to new methods for monitoring multiple cell types in deep tissues and elucidating molecular interactions in living animals. Herein, we report five types of PFC‐encapsulated silica nanoparticles that show 19F NMR peaks with different chemical shifts. A series of multicolor PFC‐encapsulated silica nanoparticles enabled the 19F MR imaging with triple colors in vivo.
For achieving in vivo multicolor 19F MRI based on FLAMEs, fluorine compounds should fulfill the following requirements: 1) The 19F NMR peaks of fluorine compounds do not overlap each other, 2) PFCs exist in the liquid state at the measurement temperature because the T 2 values of liquid state substances are much longer than those of solid‐state substances, 3) PFCs are not volatile or hydrophilic for the formulation of emulsions. In addition, the following properties are important for the ideal system: 4) PFCs exhibit a single 19F NMR peak for discrimination from the peaks of other fluorine compounds and 5) PFCs have long transverse relaxation time (T 2) for sensitive imaging. In this study, we prepared the following fluorine compounds: perfluoro‐[15] crown‐5 ether (PFCE), perfluorooctylbromide (PFOB), perfluorodichlorooctane (PFDCO), perfluorotributylamine (PFTBA), perfluorononane (PFN), and 1,1,1‐tris(perfluoro‐tert‐butoxymethyl)ethane (TPFBME). TPFBME was synthesized according to the Supporting Information, Scheme S1, and the other fluorine compounds were commercially available.
First, we checked whether PFOB, PFDCO, PFTBA, PFN, or TPFBME can be encapsulated in a silica nanoparticle. All of the PFC‐encapsulated silica nanoparticles (PFC@SiO2) were prepared according to the synthetic method of FLAME.7 After the preparation, transmission electron microscopy (TEM) images of PFC@SiO2 were acquired to confirm whether PFC@SiO2 formed the core–shell nanoparticle structures. The core–shell nanoparticle structures of all PFC@SiO2 were observed from TEM images except for PFN@SiO2 (Figure S1 a). The silica coating of PFC‐encapsulated nano‐emulsions was also confirmed by dynamic light scattering (DLS) measurements (Table S1). The results show that the hydrodynamic diameters increased in the PFC@SiO2 after the addition of tetraethyl orthosilicate. The ζ‐potentials were shifted from the positive charges of the nano‐emulsions to the negative charges of the silica nanoparticles (Table S2). We also investigated the particle size distributions and measured the average diameters of PFC@SiO2 from the TEM images (Figure S1 b and Table S3). Next, 19F NMR spectra of PFC@SiO2 were measured (Figure 1). The 19F NMR spectra of all fluorine compounds were referred to sodium trifluoroacetate (0 ppm) as the internal standard. The NMR spectra of PFCE@SiO2, TPFBME@SiO2, PFOB@SiO2, PFDCO@SiO2, and PFTBA@SiO2 corresponded with those of liquid‐state PFCs (Figure S2).
Figure 1.
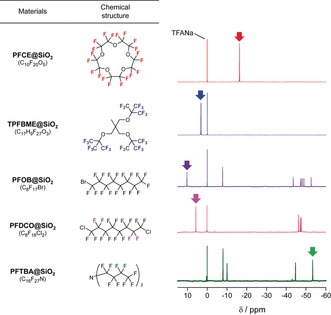
Chemical structures of PFCs and 19F NMR spectra of PFC@SiO2. The peaks of colored fluorine atoms in the chemical structures are indicated by arrows in each spectrum.
Next, we selected the candidates for multicolor 19F MR imaging by analyzing the 19F NMR spectra in Figure 1. PFCE@SiO2 was chosen as the first color because PFCE exhibits the single 19F NMR peak of the 20 equivalent fluorine atoms (δ=−16.4 ppm, red spectrum). Previously, we also confirmed that PFCE@SiO2 shows the 19F MRI signals in vivo.7 As the second fluorine compound, we focused on TPFBME, PFOB, and PFDCO, which exhibited the peaks in the region above 0 ppm. TPFBME showed a single 19F NMR peak for the 27 equivalent fluorine atoms (δ=3.3 ppm, blue spectrum). In contrast, the excitable peaks of PFOB@SiO2 and PFDCO@SiO2 were only two (δ=10.4 ppm, purple spectrum) out of 17 fluorine atoms and four (δ=5.8 ppm, magenta spectrum) out of 16 fluorine atoms, respectively. Additionally, these PFCs presented multiple peaks in the range from −43.2 to −52.5 ppm (purple spectrum for PFOB) and from −45.9 to −47.7 ppm (magenta spectrum for PFDCO). These wide ranges of multiple peaks can induce chemical shift artifacts, which causes the inaccuracy of MRI signal position.10 Therefore, TPFBME@SiO2 is a suitable candidate for the second probe, compared with PFOB@SiO2 and PFDCO@SiO2. Finally, we sought to determine the peaks that can be excited in a high magnetic field region. PFTBA@SiO2 was selected as the third color probe because PFTBA@SiO2 shows a single peak at −53.0 ppm for 6 fluorine atoms. Considering the above properties, we determined PFCE@SiO2, TPFBME@SiO2, and PFTBA@SiO2 as the nanoprobes for multicolor imaging (Figure 2). The longitudinal relaxation time (T 1) and T 2 of liquid‐state PFCs and PFC@SiO2 were measured using an 11 T 19F MRI scanner (Tables S4 and S5).
Figure 2.
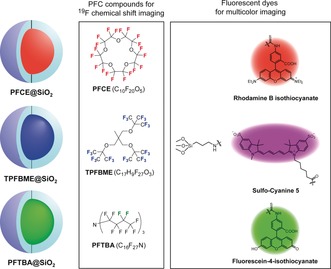
Diagram of PFCE@SiO2, TPFBME@SiO2, and PFTBA@SiO2 for multicolor 19F MRI and fluorescence imaging.
After the selection of the multicolor nanoprobe candidates, we conducted the multicolor 19F MR imaging using PFCE@SiO2, TPFBME@SiO2, and PFTBA@SiO2. These three types of nanoprobes were added to a 384‐well microplate at the concentrations of 0.25, 0.50, 1.0, 2.0, and 4.0 mm. For multicolor 19F MR imaging, the center frequencies of the TPFBME peak (at approximately δ=3.3 ppm), PFTBA peak (at approximately δ=−53.0 ppm), and PFCE peak (at approximately δ=−16.4 ppm) were chosen as the frequencies for radiofrequency (RF) output. Then, we acquired the three 19F MR images of PFCE@SiO2, TPFBME@SiO2, and PFTBA@SiO2 by exciting the peaks at the above three chemical shift values and assigned three pseudocolors to each nanoprobe. The 19F MRI signals of PFCE@SiO2, TPFBME@SiO2, and PFTBA@SiO2 were clearly imaged in a multiplexed manner (Figure 3 a). From the quantification of each 19F MRI signals, three PFC@SiO2 exhibited the linear detection ranges of the above concentrations (Figure 3 b).
Figure 3.
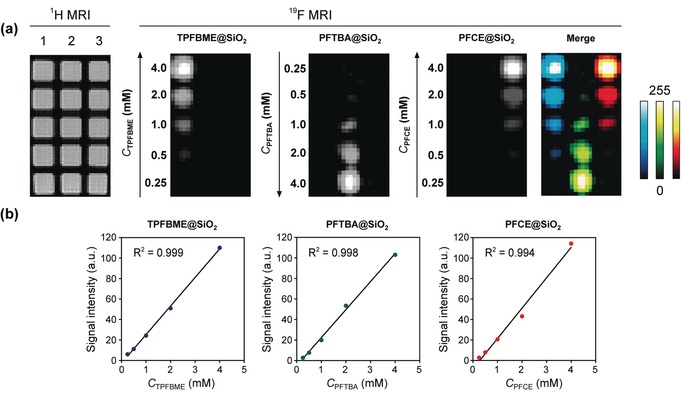
Multicolor 19F MRI of TPFBME@SiO2, PFTBA@SiO2, and PFCE@SiO2. a) 19F MRI phantom images of TPFBME@SiO2, PFTBA@SiO2, and PFCE@SiO2. The nanoprobes were placed in vertical lanes 1 (TPFBME@SiO2), 2 (PFTBA@SiO2), and 3 (PFCE@SiO2) on 1H MRI, respectively. The center frequencies of the TPFBME peak (at approximately δ=3.3 ppm), PFTBA peak (at approximately δ=−53.0 ppm), and PFCE peak (at approximately δ=−16.4 ppm) were chosen as the frequencies for radiofrequency (RF) output. 19F MRI RARE method: The image matrix was 128×64, field of view was 8×4 cm, and slice thickness was 30 mm. T R=1000 ms. T E=13 ms. The number of averages was 32. The acquisition time was 34 min 21 s. The highest pixel intensity of the 19F MRI signal was normalized to 255 (8 bit) in each image. b) Plot of 19F MRI signal intensity versus C PFC (mm). C PFC denotes the concentration of perfluorocarbons in the nanoparticles dispersed in water (detailed calculations are given in the Supporting Information).
Moreover, to render multicolor fluorescence imaging capabilities, rhodamine B isothiocyanate (RITC), sulfo‐cyanine 5 (sulfo‐Cy5), and fluorescein‐4‐isothiocyanate (FITC) were covalently modified to silica shells of PFCE@SiO2, TPFBME@SiO2, and PFTBA@SiO2, respectively (Figure 2). The fluorescence spectra show that the nanoprobes with FITC, RITC, or sulfo‐Cy5 emit fluorescence at 516 nm, 580 nm, or 664 nm, respectively (Figure S3). To investigate the capability of multicolor fluorescence detection, we conducted the fluorescence imaging of RAW264.7 cells treated with each nanoprobe (Figure S4). The fluorescence images show that the FITC, RITC, and sulfo‐Cy5 conjugated to each nanoparticle surface were spectrally separated in living cells, which showed that PFC@SiO2 could be detected by multicolor fluorescence.
To test the multicolor 19F MRI in vivo, we subcutaneously injected the carboxylated PFCE@SiO2, TPFBME@SiO2, and PFTBA@SiO2 (C PFC=10 mm, 25 μL) to indicated sites in a living mouse (Figure 4 a). Then, sequential 19F MR images were acquired using the same frequencies for RF output as those used for the imaging of the phantoms. The clear multiplexed 19F MRI signals of PFCE@SiO2, TPFBME@SiO2, and PFTBA@SiO2 were observed at each injected site on sagittal and coronal MR scans, respectively (Figure 4 b). This result demonstrates the feasibility of in vivo multicolor 19F MRI using spectrally distinct PFC‐encapsulated nanoprobes.
Figure 4.
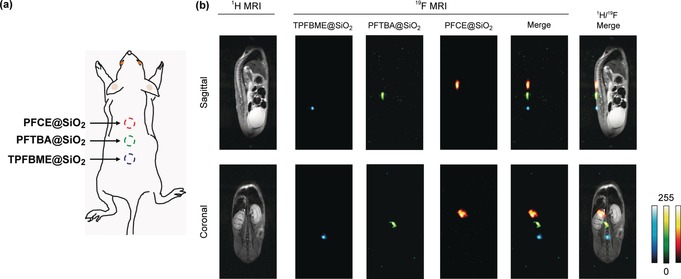
In vivo multicolor 19F MRI. a) Diagram of an in vivo experiment in a living mouse. PFCE@SiO2, TPFBME@SiO2, and PFTBA@SiO2 (C PFC=10 mm, 25 μL) were subcutaneously injected at the indicated site. b) 19F MRI images of PFCE@SiO2, TPFBME@SiO2, and PFTBA@SiO2 in a living mouse. 19F MRI RARE method: [Sagittal and Coronal] the image matrix was 256×128, field of view was 6×3 cm, and slice thickness was 40 mm. T R=1000 ms. T E=16 ms. The number of averages was 128. The acquisition time was 17 min 4 s.
Finally, to confirm the effectiveness of our in vivo multicolor system, we evaluated the effect of surface functional groups on the hepatic uptake of the nanoprobes in a living mouse. In general, most of nanomaterials were taken up by liver macrophages after intravenous administration, which prevent their delivery to target tissues.11 To reduce the hepatic uptake of nanomaterials, various functional groups have been introduced on nanoparticle surfaces, and their in vivo characteristics have been investigated.12 To compare the performance of these functional groups in vivo, experimental methods using several mice are required. However, this approach has a limitation; the results depend on the individual differences and mouse conditions. Therefore, establishing a system to evaluate the hepatic uptake of nanoparticles with different surface modifications in a single mouse enables comparative analysis of their in vivo characteristics without the above factors. We prepared three types of nanoprobes with different PFCs and surface functional groups, namely, PFCE@SiO2‐PEG, TPFBME@SiO2‐COOH, and PFTBA@SiO2‐OH (Figure 5 a) and compared the hepatic uptake. Polyethylene glycol (PEG) is known as the gold standard to reduce the hepatic uptake of nanoparticles.13 In our previous study, the modification of PEG suppressed the hepatic uptake of PFCE@SiO2.7 These nanoprobes were intravenously injected into a mouse, and we monitored the hepatic uptake of the nanoprobes by 19F MRI. The 19F MRI signals were observed from the liver in all nanoprobes 3 h after injection (Figure 5 b). Next, the S/N ratios of the 19F MRI signal intensity in the liver were quantified at all time points (Figure 5 c). To determine the in vitro standard of 19F MRI signal intensity because each PFC@SiO2 shows different 19F MRI sensitivity owing to excitable 19F spin number, we also quantified the S/N ratios of the nanoprobes in the tube at the same C PFC as the injected one. The S/N ratios in the liver at 3 h of TPFBME@SiO2‐COOH and PFTBA@SiO2‐OH were 49 % and 59 % of those in the tube, respectively. In contrast, the S/N ratio in the liver at 3 h of PFCE@SiO2‐PEG was 23 % of that in the tube. This result suggests that the hepatic uptake of PFCE@SiO2‐PEG was suppressed compared to those TPFBME@SiO2‐COOH and PFTBA@SiO2‐OH. Our results demonstrate that the novel multicolor system can be utilized simultaneously evaluate the effect of surface functional groups on hepatic uptake in a single mouse.
Figure 5.
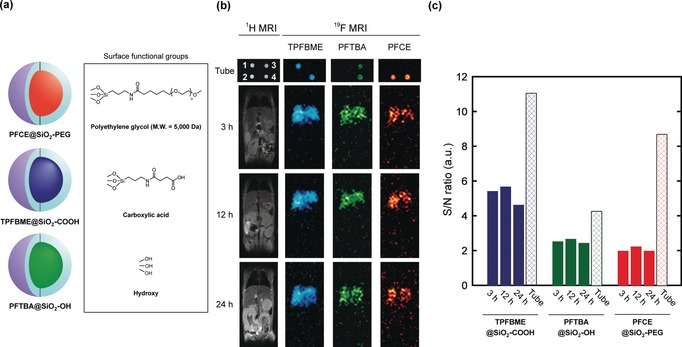
Evaluation of hepatic uptake using multicolor 19F MRI nanoprobes with different surface modifications. a) Nanoprobe design and the chemical structures of surface functional groups. b) 19F MRI images of PFCE@SiO2‐PEG, TPFBME@SiO2‐COOH, and PFTBA@SiO2‐OH (C PFC=3.3 mm) in tube (1, TPFBME@SiO2‐COOH; 2, PFCE@SiO2‐PEG; 3, PFTBA@SiO2‐OH; and 4, mixture of all nanoprobes) and a living mouse at 3, 12, and 24 h after injection. 19F MRI RARE method: [Tube] T R=1000 ms, and T E=84 ms. The number of averages was 16 (PFCE@SiO2‐PEG and TPFBME@SiO2‐COOH) or 32 (PFTBA@SiO2‐OH). The acquisition time was 2 min 8 s (PFCE@SiO2‐PEG and TPFBME@SiO2‐COOH) or 4 min 16 s (PFTBA@SiO2‐OH). [Mouse] T R=1000 ms. T E=12 ms. The number of averages was 128 (PFCE@SiO2‐PEG and TPFBME@SiO2‐COOH) or 256 (PFTBA@SiO2‐OH). The acquisition time was 17 min 4 s. c) The S/N ratios in the tube and the liver.
In summary, we developed four types of PFC‐encapsulated silica nanoparticles with different chemical shifts in addition to previously reported PFCE@SiO2. We selected three nanoprobes (PFCE@SiO2, TPFBME@SiO2, and PFTBA@SiO2) by analyzing the 19F NMR spectra and the number of fluorine atoms that can be selectively excited. These nanoprobes enabled the triple‐color 19F MR imaging in vivo for the first time (Figure 4 b). The T 2 values of our probes were relatively longer than those of polymer‐based or inorganic 19F MRI nanoprobes (Tables S5 and S6).4a,4b, 14 This relative long T 2 is the advantage of liquid PFCs, which allowed PFC‐encapsulated silica nanoparticles to detect the 19F MRI signals with a reasonable amount of PFCs (250 nmol) in a living mouse. The PFC‐encapsulated silica nanoparticles developed in this study offer two key advantages compared to the conventional PFC‐encapsulated nano‐emulsions. First, the surface modifiability through a silane‐coupling reaction and subsequent functionalization in organic solvent. Second, the biodistribution of the nanoprobes through intravenous administration may be easily controlled by attaching targeting ligands to the surface of the nanoparticle. It was reported that the nano‐emulsions with different PFCs showed the different tissue uptake in vivo likely depending on the chemical properties of inner PFCs.6b, 15 On the other hand, in the case of our nanoprobes, the chemical structures and the properties of the PFC core do not affect the chemical properties of the nanoprobes because the surfaces of all nanoprobes are coated with silica gel and the core PFCs do not interact with any molecules including solvent. These advantages allowed the in vivo evaluation of the hepatic uptake of the nanoprobes with different surface functional groups (Figure 5). Our multicolor nanoprobes could be applied to investigate the delivery of nanoparticles with various functional groups not only to liver but also to other organs. In future studies, we will address the development of multicolor PFC‐encapsulated silica nanoparticles with on/off‐switching ability in response to various stimuli such as enzyme activity, hypoxia, or pH variation. This is expected to be helpful for analyzing the dynamics of multiple enzymes or relationships of enzymes to diverse biological phenomena. Moreover, our multicolor nanoprobes can be useful for establishing in vivo ratiometric sensing systems. These novel multicolor 19F MRI nanoprobes will facilitate the elucidation of biomolecular networks in vivo.
Conflict of interest
The authors declare no conflict of interest.
Supporting information
As a service to our authors and readers, this journal provides supporting information supplied by the authors. Such materials are peer reviewed and may be re‐organized for online delivery, but are not copy‐edited or typeset. Technical support issues arising from supporting information (other than missing files) should be addressed to the authors.
Supplementary
Acknowledgements
We thank Dr. Takao Sakata (the Research Center for Ultra‐High Voltage Electron Microscopy, Osaka University) for his support in TEM measurements. We are also grateful to Prof. Masaru Ishii, Dr. Junichi Kikuta, and Dr. Hiroki Mizuno (Graduate School of Medicine, Osaka University) for providing the RAW264.7 cells. This research was supported by the Grant‐in‐Aid for Scientific Research (Grant No. 25220207, 18H03935, and 16K01933), and Innovative Areas “Frontier Research on Chemical Communications” (No. 17H06409) of MEXT, Japan; JSPS A3 Foresight Program; JSPS Asian CORE Program, “Asian Chemical Biology Initiative”; and the Magnetic Health Science Foundation.
K. Akazawa, F. Sugihara, T. Nakamura, H. Matsushita, H. Mukai, R. Akimoto, M. Minoshima, S. Mizukami, K. Kikuchi, Angew. Chem. Int. Ed. 2018, 57, 16742.
References
- 1.
- 1a. Shcherbakova D. M., Verkhusha V. V., Nat. Methods 2013, 10, 751–754; [DOI] [PMC free article] [PubMed] [Google Scholar]
- 1b. Livet J., Weissman T. A., Kang H. N., Draft R. W., Lu J., Bennis R. A., Sanes J. R., Lichtman J. W., Nature 2007, 450, 56–62; [DOI] [PubMed] [Google Scholar]
- 1c. Sato R., Kozuka J., Ueda M., Mishima R., Kumagai Y., Yoshimura A., Minoshima M., Mizukami S., Kikuchi K., J. Am. Chem. Soc. 2017, 139, 17397–17404. [DOI] [PubMed] [Google Scholar]
- 2.
- 2a. McMahon M. T., Gilad A. A., DeLiso M. A., Berman S. D. C., Bulte J. W. M., van Zijl P. C. M., Magn. Reson. Med. 2008, 60, 803–812; [DOI] [PMC free article] [PubMed] [Google Scholar]
- 2b. Liu G. S., Moake M., Har-el Y. E., Long C. M., Chan K. W. Y., Cardona A., Jamil M., Walczak P., Gilad A. A., Sgouros G., van Zijl P. C. M., Bulte J. W. M., McMahon M. T., Magn. Reson. Med. 2012, 67, 1106–1113; [DOI] [PMC free article] [PubMed] [Google Scholar]
- 2c. Lu G. J., Farhadi A., Szablowski J. O., Lee-Gosselin A., Barnes S. R., Lakshmanan A., Bourdeau R. W., Shapiro M. G., Nat. Mater. 2018, 17, 456–463. [DOI] [PMC free article] [PubMed] [Google Scholar]
- 3. Tirotta I., Dichiarante V., Pigliacelli C., Cavallo G., Terraneo G., Bombelli F. B., Metrangolo P., Resnati G., Chem. Rev. 2015, 115, 1106–1129. [DOI] [PubMed] [Google Scholar]
- 4.
- 4a. Huang X. N., Huang G., Zhang S. R., Sagiyama K., Togao O., Ma X. P., Wang Y. G., Li Y., Soesbe T. C., Sumer B. D., Takahashi M., Sherry A. D., Gao J. M., Angew. Chem. Int. Ed. 2013, 52, 8074–8078; [DOI] [PMC free article] [PubMed] [Google Scholar]; Angew. Chem. 2013, 125, 8232–8236; [Google Scholar]
- 4b. Ashur I., Allouche-Arnon H., Bar-Shir A., Angew. Chem. Int. Ed. 2018, 57, 7478–7482; [DOI] [PubMed] [Google Scholar]; Angew. Chem. 2018, 130, 7600–7604; [Google Scholar]
- 4c. Bar-Shir A., Yadav N. N., Gilad A. A., van Zijl P. C. M., McMahon M. T., Bulte J. W. M., J. Am. Chem. Soc. 2015, 137, 78–81. [DOI] [PMC free article] [PubMed] [Google Scholar]
- 5.
- 5a. Ahrens E. T., Flores R., Xu H. Y., Morel P. A., Nat. Biotechnol. 2005, 23, 983–987; [DOI] [PubMed] [Google Scholar]
- 5b. Kislukhin A. A., Xu H. Y., Adams S. R., Narsinh K. H., Tsien R. Y., Ahrens E. T., Nat. Mater. 2016, 15, 662–668; [DOI] [PMC free article] [PubMed] [Google Scholar]
- 5c. Tirotta I., Mastropietro A., Cordiglieri C., Gazzera L., Baggi F., Baselli G., Bruzzone M. G., Zucca I., Cavallo G., Terraneo G., Bombelli F. B., Metrangolo P., Resnati G., J. Am. Chem. Soc. 2014, 136, 8524–8527; [DOI] [PubMed] [Google Scholar]
- 5d. Srinivas M., Cruz L. J., Bonetto F., Heerschap A., Figdor C. G., de Vries I. J. M., Biomaterials 2010, 31, 7070–7077. [DOI] [PubMed] [Google Scholar]
- 6.
- 6a. Partlow K. C., Chen J. J., Brant J. A., Neubauer A. M., Meyerrose T. E., Creer M. H., Nolta J. A., Caruthers S. D., Lanza G. M., Wickline S. A., FASEB J. 2007, 21, 1647–1654; [DOI] [PubMed] [Google Scholar]
- 6b. Weise G., Basse-Lusebrink T. C., Kleinschnitz C., Kampf T., Jakob P. M., Stoll G., PLoS One 2011, 6, e28143; [DOI] [PMC free article] [PubMed] [Google Scholar]
- 6c. Lim Y. T., Noh Y. W., Cho J. H., Han J. H., Choi B. S., Kwon J., Hong K. S., Gokarna A., Cho Y. H., Chung B. H., J. Am. Chem. Soc. 2009, 131, 17145–17154. [DOI] [PubMed] [Google Scholar]
- 7. Matsushita H., Mizukami S., Sugihara F., Nakanishi Y., Yoshioka Y., Kikuchi K., Angew. Chem. Int. Ed. 2014, 53, 1008–1011; [DOI] [PubMed] [Google Scholar]; Angew. Chem. 2014, 126, 1026–1029. [Google Scholar]
- 8.
- 8a. Akazawa K., Sugihara F., Nakamura T., Mizukami S., Kikuchi K., Bioconjugate Chem. 2018, 29, 1720–1728; [DOI] [PubMed] [Google Scholar]
- 8b. Akazawa K., Sugihara F., Minoshima M., Mizukami S., Kikuchi K., Chem. Commun. 2018, 54, 11785–11788. [DOI] [PubMed] [Google Scholar]
- 9. Nakamura T., Sugihara F., Matsushita H., Yoshioka Y., Mizukami S., Kikuchi K., Chem. Sci. 2015, 6, 1986–1990. [DOI] [PMC free article] [PubMed] [Google Scholar]
- 10. Giraudeau C., Flament J., Marty B., Boumezbeur F., Meriaux S., Robic C., Port M., Tsapis N., Fattal E., Giacomini E., Lethimonnier F., Le Bihan D., Valette J., Magn. Reson. Med. 2010, 63, 1119–1124. [DOI] [PubMed] [Google Scholar]
- 11. Tsoi K. M., MacParland S. A., Ma X. Z., Spetzler V. N., Echeverri J., Ouyang B., Fadel S. M., Sykes E. A., Goldaracena N., Kaths J. M., Conneely J. B., Alman B. A., Selzner M., Ostrowski M. A., Adeyi O. A., Zilman A., McGilvray I. D., Chan W. C. W., Nat. Mater. 2016, 15, 1212–1221. [DOI] [PMC free article] [PubMed] [Google Scholar]
- 12. Blanco E., Shen H., Ferrari M., Nat. Biotechnol. 2015, 33, 941–951. [DOI] [PMC free article] [PubMed] [Google Scholar]
- 13. Jokerst J. V., Lobovkina T., Zare R. N., Gambhir S. S., Nanomedicine 2011, 6, 715–728. [DOI] [PMC free article] [PubMed] [Google Scholar]
- 14.
- 14a. Moonshi S. S., Zhang C., Peng H., Puttick S., Rose S., Fisk N. M., Bhakoo K., Stringer B. W., Qiao G. G., Gurr P. A., Whittaker A. K., Nanoscale 2018, 10, 8226–8239; [DOI] [PubMed] [Google Scholar]
- 14b. Bo S. W., Yuan Y. P., Chen Y. P., Yang Z. G., Chen S. Z., Zhou X., Jiang Z. X., Chem. Commun. 2018, 54, 3875–3878. [DOI] [PubMed] [Google Scholar]
- 15. Amir N., Green D., Kent J., Xiang Y., Gorelikov I., Seo M., Blacker M., Janzen N., Czomy S., Valliant J. F., Matsuura N., Nucl. Med. Biol. 2017, 54, 27–33. [DOI] [PubMed] [Google Scholar]
Associated Data
This section collects any data citations, data availability statements, or supplementary materials included in this article.
Supplementary Materials
As a service to our authors and readers, this journal provides supporting information supplied by the authors. Such materials are peer reviewed and may be re‐organized for online delivery, but are not copy‐edited or typeset. Technical support issues arising from supporting information (other than missing files) should be addressed to the authors.
Supplementary