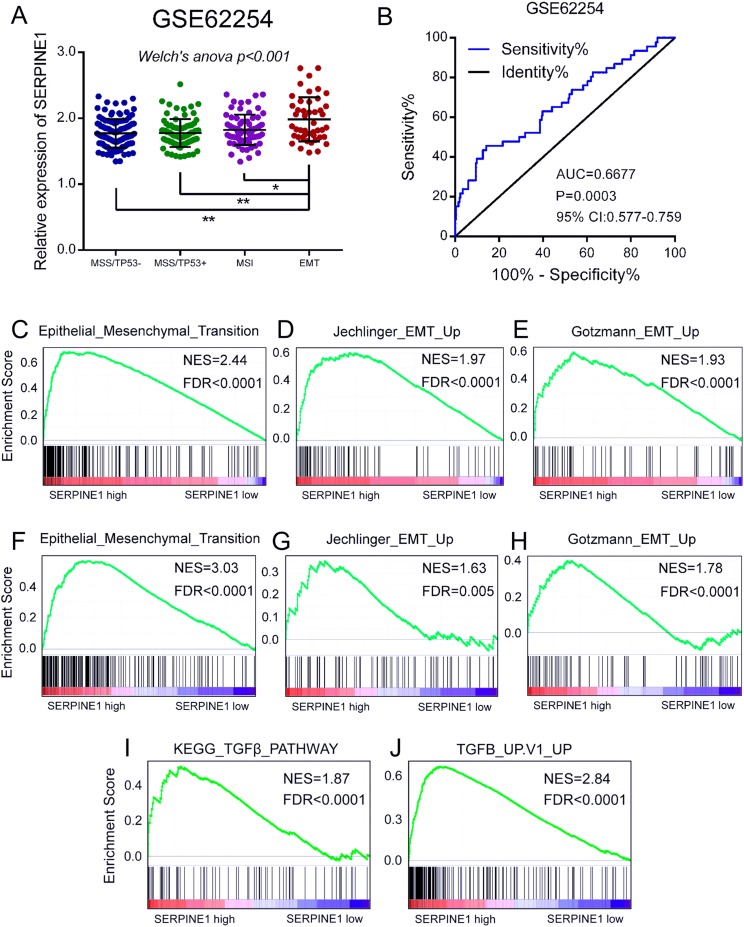
Figure 4. Overexpression of SERPINE1 is correlated with EMT in gastric cancer.
(A) The mRNA level of SERPINE1 among the molecular subtypes of MSS/TP53−, MSS/TP53+, MSI, and EMT in the GSE62254 dataset was analyzed using the Welch’s ANOVA. MSS, microsatellite stability; MSI, microsatellite instability; EMT, epithelial to mesenchymal transition. (B) The ROC curve of SERPINE1 in discriminating EMT and non-EMT molecular subtypes of GSE62254 dataset. The GSEA validation of (C–E) GSE63089 dataset and (F–H) TCGA STAD dataset using the EMT-related gene sets. (I and J) The GSEA analysis of the TCGA STAD dataset using the gene sets of TGFβ signaling pathway. NES, normalized enrichment score. FDR, false discovery rate.

