

Abstract
Each of the pathological stages (I-IIIa) in which surgically resected non-small cell lung cancer patients are classified conceals hidden biological heterogeneity, manifested in heterogeneous outcomes within each stage. Thus, the finding of robust and precise molecular classifiers to assess individual patient risk is an unmet medical need. Here we identified and validated the clinical utility of a new prognostic signature based on three proteins (BRCA1, QKI and SLC2A1) to stratify early lung adenocarcinoma patients according to their risk of recurrence or death. Patients were staged following the new International Association for the Study of Lung Cancer (IASLC) staging criteria (8th edition, 2018). A test cohort (n=239) was used to assess the value of this new prognostic index (PI) based on the three proteins. The prognostic signature was developed by Cox regression following stringent statistical criteria (TRIPOD: Transparent reporting of a multivariable prediction model for individual prognosis or diagnosis). The model resulted in a highly significant predictor of five-year outcome for disease-free survival (P<0.001) and overall survival (P<0.001). The prognostic ability of the model was externally validated in an independent multi-institutional cohort of patients (n=114, P=0.021). We also demonstrated that this molecular classifier adds relevant information to the gold standard TNM-based pathological staging with a highly significant improvement of likelihood ratio. We subsequently developed a combined prognostic index (CPI) including both the molecular and the pathological data which improved the risk stratification in both cohorts (P≤0.001). Moreover, the signature may help to select stage I-IIA patients who might benefit from adjuvant chemotherapy. In summary, this protein-based signature accurately identifies those patients with high risk of recurrence and death, and adds further prognostic information to the TNM-based clinical staging, even applying the new IASLC 8th edition staging criteria. More importantly, it may be a valuable tool for selecting patients for adjuvant therapy.
Keywords: signature, immunohistochemistry, adenocarcinoma, disease-free survival, overall survival, clinical utility
INTRODUCTION
Lung cancer is the leading cause of cancer-related death worldwide [1]. Usually, two out of three lung cancer patients are diagnosed at an advanced stage of the disease, when the curative options and survival rates are poor. Even among early stage patients, the mortality risk remains high, with 30–45% relapse rates within 5 years of diagnosis [2]. According to results from randomized clinical trials, adjuvant chemotherapy is recommended for stage II-III patients. However, the indication of chemotherapy for stage I patients is still a matter of debate [3]. Early identification of patients with high risk of recurrence after surgery is crucial to design tailored management strategies to reduce lung cancer mortality. Moreover, lung cancer screening by low-dose computed tomography (LDCT) has been introduced into the routine clinical practice and it is entering in reimbursement schemes [4] to reduce lung cancer mortality [5]. Implementation of lung cancer screening will reasonably increase the number of surgically amenable lung cancer patients diagnosed in early stages within the next few years.
The tumor-node-metastasis staging system (TNM) is the current gold standard to estimate prognosis in non-small cell lung cancer (NSCLC) patients. However, it is not sufficient for accurate survival prediction as heterogeneous clinical outcomes with identical TNM staging are commonly observed. Despite the efforts over the last decade, to date none of the many proposed biological features has been incorporated to the routine clinical practice [6,7]. In recent years, attention has shifted to high- throughput genomic tools; particularly microarray technology has been used to identify prognostic RNA-based profiles in NSCLC. More recently several PCR-based signatures have been developed and validated to define the risk of death although they have not yet been prospectively proved [8–11]. Of note, the requirement for good quality RNA samples may limit the outcome of these signatures in routine daily practice. Alternatively, the identification and quantitation of protein expression in tissue sections is a very well mastered technique, available in every hospital. Specifically, immunohistochemistry (IHC) has been used as an approved companion biomarker for several novel therapeutic strategies [12,13].
In the present study, we develop and validate a new molecular prognostic signature for lung adenocarcinoma (ADC). Specifically, we use immunodetection-based techniques to assess the expression of three prognostic proteins in our cohorts of patients. Using this signature, we are able to identify a subset of stage I-II patients with higher risk of recurrence and survival who may be in need of a more aggressive therapy or closer follow up. We clearly show that our classifier offers additional information to the TNM staging system. More importantly, our model gives insights into which patients may benefit from adjuvant therapy.
MATERIAL AND METHODS
Patients
Primary ADC tumor samples were collected from consecutive population cohorts from University of Texas MD Anderson Cancer Center (Houston, TX) (MDA), the CIBERES multi-institutional Pulmonary Biobank Platform (Spain) [14] and Clínica Universidad de Navarra (Pamplona, Spain) (CUN). The MDA cohort was composed of 239 ADC patients diagnosed from 1999 to 2008 at the MD Anderson Cancer Center (Houston, TX). A second cohort of 114 ADC patients was analyzed. These lung ADC patients were diagnosed from 2000 to 2013. Inclusion criteria were as follows: patients with lung ADC, complete resection of the primary tumor, absence of cancer within the previous five years and absence of chemo or radio-therapy treatment prior to surgery. Tumors were classified according to the WHO 2004 classification [15] and 8th TNM edition was used for tumor stratification [16]. Tissue microarrays (TMAs) were constructed by obtaining three cores from each tumor at three different areas using a manual tissue arrayer. REMARK guidelines were strictly followed throughout the study [17]. For survival analysis, the follow-up period was restricted to 60 months in all cohorts. Disease-free survival (DFS) and overall survival (OS) were calculated from the date of surgery to the date of recurrence or death, respectively. The study was conducted according to the Declaration of Helsinki, and was approved by the Institutional Review Board and Ethical committee of MDA, CUN and CIBERES. Written informed consent was obtained from each patient. Characteristics of the cohorts are specified in supplementary material, Table S1.
In silico analysis
Data from nine lung cancer microarray experiments (http://www.ncbi.nlm.nih.gov/geo) were downloaded and analyzed. The GEO accession numbers were: GSE3141 [18]; GSE8894 [19]; GSE68465 [20]; GSE31210 [21]; GSE13213 [22]; GSE26939 [23]; GSE5828 [24]; GSE4573 [25]; GSE17710 [26]. Survival analysis was conducted by Kaplan-Meier curves (log rank test). Patients were divided according to mRNA expression levels using the median or tertiles as cut-off.
Cell culture
Human NSCLC cell lines (NCI-H1395, NCI-H23, NCI-H441, A549, NCI-H358, NCI-H1299, NCI-H460, Calu-1, NCI-H1869, NCI-H520 and HCC15) were obtained from the American Type Culture Collection (ATCC, Manasas, VA, USA) and the German Collection of Microorganisms and Cell Cultures (DSMZ, Braunschweig, Germany). All the cell lines were grown in RPMI with 2 mM L-glutamine, 10% Fetalclone (Thermo Scientific, Waltham, MA, USA), 100 U/ml of penicillin and 100 mg/ml of streptomycin (Invitrogen, Barcelona, Spain). Cell lines were authenticated by analysis of their genetic alterations.
Antibody specificity validation
Specificity of the antibodies was assessed using western blotting (WB), IHC and siRNA knock-down technology in NSCLC cells. Nuclear and cytoplasmic protein fractions of different cell lines were isolated, and formalin-fixed paraffin-embedded (FFPE) blocks of the same cells were prepared. For each antibody, the fact that only specific molecular-weight bands of the expected size appeared in the WB was confirmed. In most cases, one band corresponding to the canonical isoform appeared. When two or more bands were detected, we checked whether they corresponded to gene splice isoforms. Antibodies recognizing non-specific bands were discarded. Also, the expression of the protein was studied by IHC in the cell line FFPE blocks and the correlation of the expression detected by WB and IHC was analyzed. Additionally, the proper localization in the subcellular compartment was checked using both methods. In case of inconclusive results, antibody specificity was evaluated by siRNA knock-down. A pipeline with the steps followed in this point is shown in Figure 1.
Figure 1. Flowchart showing the main steps followed in the study.
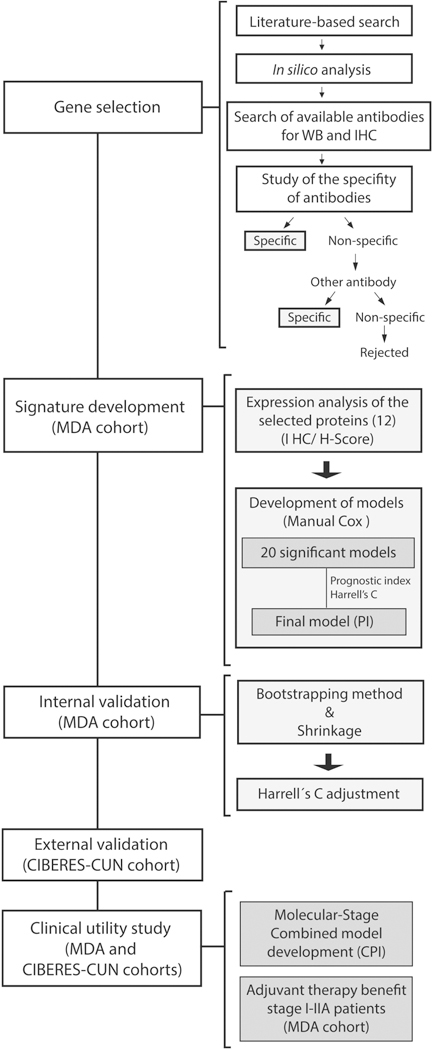
We first selected a source of genes previously related with lung cancer prognosis. We analyzed the prognostic value at the mRNA level for each gene individually. After validation of commercial antibodies, we carefully chose those genes with specific antibodies that met the above requirements. We studied the expression of 12 selected proteins and developed the prognostic model by Cox regression in the training cohort (MDA cohort). The model was internally validated by bootstrapping & shrinkage methods in the training cohort and it was externally validated in an independent cohort of early lung ADC patients (CIBERES-CUN cohort).
Immunohistochemistry (IHC)
Immunohistochemical staining foPr BRCA1, CDC6, LIG1, QKI, RAD51, RAE1, RRM2, SIRT2, SLC2A1, SNRPE, SRSF1 and STC1 was performed on sections of FFPE tissues and cell blocks. After dewaxing, sections were hydrated through a graded series of ethanol. Endogenous peroxidase activity was quenched with 3% H2O2 for 10 min. Heat-mediated antigen retrieval was conducted in a Lab Vision PT module at 95 °C for 20 min either with citrate buffer (pH 6) (Thermo Scientific) or Tris-EDTA (pH 9) (Thermo Scientific) as indicated. Sections were incubated with primary antibodies diluted in a special buffer (Antibody diluent, Dako, Glostrup, Denmark) overnight at 4 °C in a humidity chamber. After a rinse with TBS, sections were incubated for 30 min with mouse or rabbit EnVision complex (Dako) or Streptavidin HRP complexes (1:200) after incubation with biotinylated anti-goat Ig. A color was developed with liquid diaminobenzidine (Dako) under microscopic control. Finally, tissue samples were counterstained with hematoxylin, and mounted with DPX. Antibodies characteristics and conditions for detection by IHC in FFPE samples are summarized in supplementary material, Table S2.
Evaluation of immunostaining
Tumors were evaluated by two experienced observers (E.M.T and M.J.P). The expression of the proteins was scored as the percentage of positive cells (0% to 100%), and the intensity of staining (1, weak; 2, moderate; and 3, strong). The final H-score was calculated by adding the products of the percentage of cells stained at a given intensity (0–100) and the staining intensity (0–3), as previously described [20]. Staining at different subcellular compartments (N, nuclear; C, cytoplasmic; MB, membrane) was evaluated independently for each marker. The agreement between the two observers was verified by Gwet’s AC1. Discordant independent readings were resolved by simultaneous review by the two observers.
Western blotting
Proteins were denatured in SDS sample buffer (Bio-Rad) at 95 °C for 5 min, separated by SDS-PAGE on NuPAGE Novex 10%, 12% or 4–12% Bis-Tris gels (Invitrogen) in MOPS or MES buffer and transferred to nitrocellulose membranes (0.45 μm pore size; Bio-Rad). Membranes were blocked in 5% non-fat milk for 1 h and incubated overnight at 4 °C with the primary antibodies at 1:500 for anti-SIRT2 and anti-SNRPE, 1:1000 for anti-BRCA1, anti-SLC2A1, anti-RRM2, anti-CDC6, anti-RAE1, and anti-STC1, 1:2000 for anti-QKI and anti-LIG1, 1:4000 for anti-β-actin, 1:5000 for anti-lamin A/C, 1:8000 for anti RAD51 and 1:10000 for anti-GAPDH and anti-SRSF1. Secondary antibodies (anti-rabbit IgG NA934 or anti-mouse IgG NA931; 1:2000; GE Healthcare) were applied for 1 h at room temperature and chemiluminescent detection was performed using Lumi-Light PLUS (Roche, Manhein, Germany).
Statistics
TRIPOD criteria were followed in our study [21] and statistical analyses were performed using SPSS 22.0 (IBM Corp, Armonk, NY, USA) and STATA/IC 12.1 (StataCorp, College Station, TX, USA). Generation of the prognostic signatures was performed in the MDA cohort using regression Cox analysis [22]. Discriminative ability of the PI was assessed by Harrell’s Concordance coefficient (C-index) and log-rank test for the PI dichotomized at the median [30]. The prognostic model was internally validated to quantify any optimism in the predictive performance through a shrinkage penalization strategy [31]. Univariate and multivariate Cox proportional hazards analyses including clinical and pathological variables were used to assess the prognostic role of the molecular model (PI). Only variables with P<0.25 in the univariate analysis were included in the multivariate analysis. The external validation of the prognostic models was performed in the second cohort (CIBERES-CUN). We calculated the C-index and the survival curves with the Kaplan-Meier method, which differences were compared using log-rank test as previously described. Clinical utility of the model was tested by comparing the likelihood ratio of the stage alone to that after the addition of the molecular model (PI) through a bivariable Cox analysis in the MDA cohort. The combined prognostic model (CPI) was also developed by Cox regression. Also, the discriminative ability of the CPI was assessed as described above (Harrell’s C and the log-rank test for the CPI dichotomized at the median). Statistical methods are detailed in supplementary material, Supplementary materials and methods.
RESULTS
Gene selection to develop the prognostic signature
With the aim of generating a protein-based signature to predict disease outcome, we firstly identified in the literature genes whose expression was associated with clinical outcome. A flowchart with all the steps followed in this work is shown in Figure 1. We selected those genes significantly associated with prognosis in at least two previously published gene expression signatures (20 genes out of 967). Moreover, based in our previous publications, nine additional biomarkers were added to the list. In the next step of the gene-selection process, we conducted an in silico survival analysis to validate the prognostic value of these genes at the RNA level using different NSCLC databases. Twenty one genes showing prognostic value in at least 2 databases were selected (supplementary material, Table S3). Subsequently, those genes (n=5) that lacked reliable commercial antibodies in the antibodypedia database (www.antibodypedia.com) were discarded. In the last step, the antibody specificity for the 16 remaining genes was evaluated by IHC, WB and siRNA technology (supplementary material, Figures S1–S12). Finally we selected 12 cancer-related genes (BRCA1, CDC6, LIG1, QKI, RAD51, RAE1, RRM2, SIRT2, SLC2A1, SNRPE, SRSF1 and STC1) for which specific antibodies met our requirements and developed the prognostic model. The strategy conducted for the gene selection is described in more detail in supplementary material, Supplementary materials and methods and Table S4.
Development of a protein-based signature for risk stratification in lung adenocarcinoma
First, we analyzed the expression of the 12 selected proteins by IHC in patients from the MDA cohort. We studied each subcellular localization (N, nuclear; C, cytoplasmic; MB, membrane) as independent variables (supplementary material, Table S5). Figure 2 shows representative images of the immunostained tumors. Next, we performed Cox regression analysis to generate 20 statistically significant prognostic models. We calculated the Prognostic Index (PI) for each patient and subsequently Harrell’s concordance coefficient (C-index) to evaluate the quality of each model. Finally, the best model was selected as the model that yields high C-index and high parsimony. The selected model was composed by three proteins (BRCA1, QKI and SLC2A1) divided in four variables (BRCA1N, QKIN, QKIC and SLC2A1MB). The algorithm was: PI= −0.004 × QKIN H Score + 0.006 × QKIC H-Score + 0.005 × SLC2A1MB H-Score + 0.006 × BRCA1N H-Score. The model showed a good discrimination [C-index=0.63 for DFS and 0.66 for overall survival (OS)]. To avoid a potential overfitting effect we performed a bootstrapping-based internal validation and obtained the adjusted C-indexes (0.62 for DFS and 0.65 for OS) (supplementary material, Table S6-S7).The model satisfied the proportional hazards assumption (P=0.532).
Figure 2. Representative immunostaining for the proteins included in the prognostic signature.
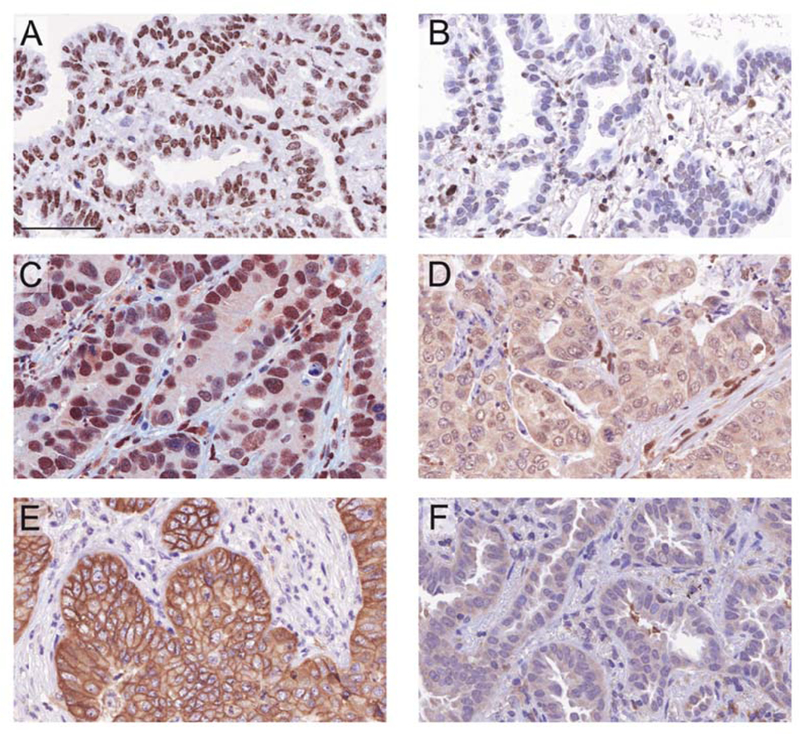
Representative images of primary tumors with high (A, C, D) or low (B, D, F) expression of BRCA1 (A, B), QKI (C, D) and SLC2A1 (E, F). BRCA1 was found predominantly in the nucleus; QKI appeared in both nuclear and cytoplasmic compartments; whereas SLC2A1 was located in the cell membrane and cytoplasm of tumor cells. Scale bar: 60 μm.
The predicted low-risk group had a significantly longer DFS (P=0.004) and OS (P<0.001) than the high-risk group in the training cohort (Figure 3A). Univariate Cox regression analysis showed that the molecular PI was significantly associated with both DFS (P<0.001, HR=2.89 (95% CI, 1.82–4.57) and OS (P<0.001 HR=3.95 (95% CI, 2.32–6.72) for OS). As expected, the prognostic significant of stage was very high for both DFS (P<0.001) and OS (P=0.001). After a multivariate adjustment (stage, gender and adjuvant treatment), the molecular PI remained a significant predictor of five-year outcome: P<0.001, HR=2.56 (95% CI, 1.56–4.20) for DFS and P<0.001, HR=3.69 (95% CI, 2.10–6.50) for OS. All the results from the Cox proportional hazards analysis are summarized in Table 1.
Figure 3. Identification and validation of the prognostic model.
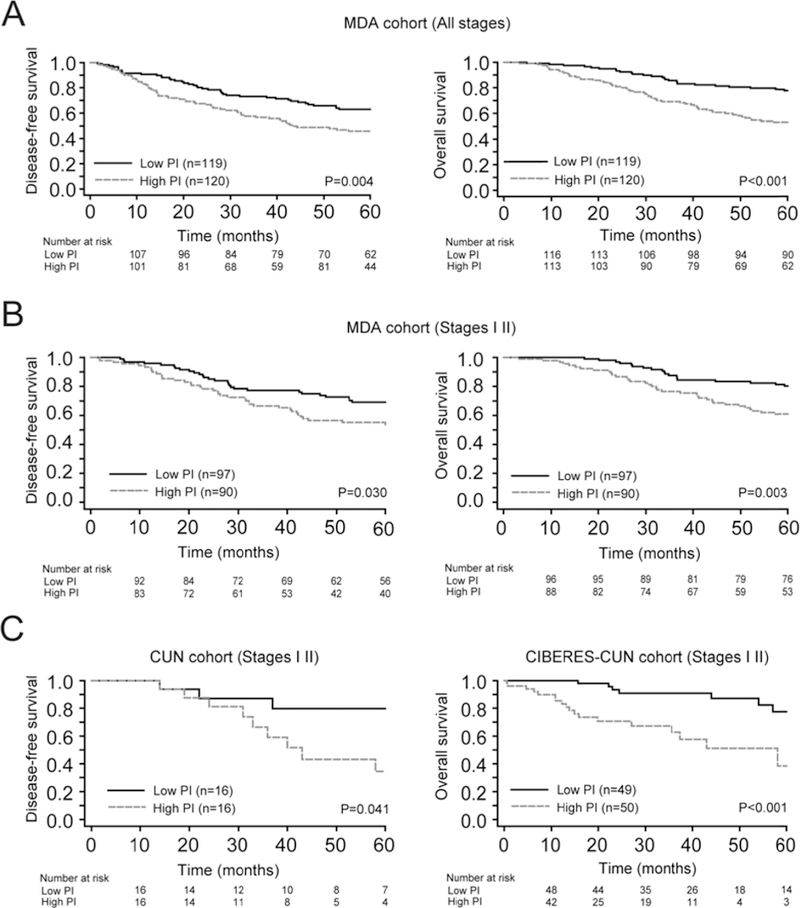
(A-B). Kaplan Meier survival curves for high and low prognostic index (PI) groups in MDA patients for DFS (left panel) and OS (right panel), respectively. Each set of patients was stratified into two risk groups according to the median of the PI. Differences between groups were evaluated using the log-rank test. (A). Entire MDA cohort. (B). Early stage (I-II) patients of MDA cohort. (C). DFS plots in CUN series (left panel) and OS in CIBERES-CUN cohort (right panel) for stage I-II patients. The low PI group defines a subgroup of patients with higher survival in all cases.
Table 1.
Univariate and multivariate Cox proportional hazards analysis of PI score and clinicopathological parameters for DFS and OS in MDA cohort.
| DFS* |
OS† |
||||||||
|---|---|---|---|---|---|---|---|---|---|
| MDA Cohort | n (%) | Univariate analysis | Multivariate analysis | Univariate analysis | Multivariate analysis | ||||
| HR (95% CI) | P value | HR (95% CI) | P value | HR (95% CI) | P value | HR (95% CI) | P value | ||
| PI‡ | 2.89 (1.82–4.57) | <0.001 | 2.56 (1.56–4.20) | <0.001 | 3.95 (2.32–6.72) | <0.001 | 3.69 (2.10–6.50) | <0.001 | |
| Stage | <0.001 | <0.001 | 0.001 | <0.001 | |||||
| I | 132 (55.2%) | 1 | 1 | 1 | 1 | ||||
| II | 55 (23.0%) | 2.50 (1.54–4.07) | <0.001 | 2.53 (1.537–4.19) | <0.001 | 2.21 (1.29–3.79) | 0.004 | 2.29 (1.32–3.99) | 0.003 |
| III | 45 (18.8%) | 4.19 (2.59–6.78) | <0.001 | 4.05 (2.23–7.36) | <0.001 | 3.49 (2.05–5.94) | <0.001 | 3.86 (2.02–7.40) | <0.001 |
| IV | 7 (2.9%) | 7.14 (3.16–16.16) | <0.001 | 5.57 (2.41–12.88) | <0.001 | 2.14 (0.65–7.01) | 0.209 | 1.56 (0.47–5.17) | 0.463 |
| Gender | 0.073 | 0.867 | 0.001 | 0.068 | |||||
| Male | 99 (41.4%) | 1 | 1 | 1 | 1 | ||||
| Female | 140 (58.6%) | 0.70 (0.48–1.03) | 0.97 (0.64–1.45) | 0.49 (0.32–0.76) | 0.66 (0.42–1.03) | ||||
| Age (years) | 0.995 | 0.370 | |||||||
| <65 | 33 (13.8%) | 1 | 1 | ||||||
| >65 | 206 (86.2%) | 1.00 (0.58–1.73) | 1.37 (0.69–2.74) | ||||||
| Adjuvant treatment | 0.095 | 0.657 | 0.213 | 0.056 | |||||
| No | 137 (57.3%) | 1 | 1 | 1 | 1 | ||||
| Yes | 87 (36.4%) | 1.41 (0.94–2.11) | 0.89 (0.55–1.46) | 1.02 (0.64–1.63) | 0.920 | 0.58 (0.34–1.01) | |||
| Unknown | 15 (6.3%) | ||||||||
| Tobacco | 0.691 | 0.664 | |||||||
| Never | 42 (17.6%) | 1 | 1 | ||||||
| Former | 110 (46.0%) | 1.09 (0.62–1.92) | 0.765 | 0.82 (0.45–1.49) | 0.521 | ||||
| Current | 87 (36.4%) | 1.25 (0.70–2.24) | 0.443 | 1.01 (0.56–1.85) | 0.968 | ||||
Events/n = 104/239 in univariate and multivariate analysis (DFS).
Events/n = 82/239 in univariate and multivariate analysis (OS).
PI: prognostic index.
Usefulness of the 3-protein prognostic signature to stratify risk in early lung ADC patients
In order to evaluate the potential utility of the PI for estimation prognosis in early stage lung ADC, we conducted a specific analysis of our signature on samples from stage I-II patients (n=187) of the MDA series (n=239). Kaplan-Meier survival curves and log-rank tests showed statistical differences between the two groups on both DFS (P=0.030) and OS (P=0.003) (Figure 3B).
We next tested the independent prognostic ability of the PI from other parameters with prognostic value in this subgroup of patients. The molecular PI remained an independent risk factor, after adjusting for stage, for both DFS [P=0.024, HR=1.99 (95% CI, 1.10–3.62)] and OS [P=0.007, HR=2.54 (95% CI, 1.29–5.01)]. The results of the univariate and multivariate Cox proportional hazards analysis are summarized in Table 2.
Table 2.
Univariate and multivariate Cox proportional hazards analysis of PI score and clinicopathological parameters for DFS and OS in MDA cohort (early stages I and II).
| DFS* | OS† | ||||||||
|---|---|---|---|---|---|---|---|---|---|
| MDA Cohort | n (%) | Univariate analysis | Multivariate analysis | Univariate analysis | Multivariate analysis | ||||
| HR (95% CI) | P value | HR (95% CI) | P value | HR (95% CI) | P value | HR (95% CI) | P value | ||
| PI‡ | 2.17 (1.22–3.85) | 0.008 | 1.99 (1.10–3.62) | 0.024 | 3.02 (1.57–5.79) | 0.001 | 2.54 (1.29–5.01) | 0.007 | |
| Stage | <0.001 | 0.003 | 0.019 | 0.036 | |||||
| IA | 73 (30.5%) | 1 | 1 | 1 | 1 | ||||
| IB | 59 (31.6%) | 1.84 (0.54–2.93) | 0.184 | 1.53 (0.81–2.90) | 0.192 | 1.21 (0.59–2.48) | 0.600 | 1.21 (0.59–2.8) | 0.601 |
| IIA | 14 (7.5%) | 3.22 (1.27–8.19) | 0.014 | 2.85 (1.12–7.28) | 0.028 | 3.29 (1.34–8.08) | 0.009 | 2.83 (1.15–6.96) | 0.024 |
| IIB | 41 (21.9%) | 3.22 (1.72–6.05) | <0.001 | 3.06 (1.63–5.73) | 0.001 | 2.23 (1.11–4.47) | 0.023 | 2.25 (0.40–1.22) | 0.023 |
| Gender | 0.263 | 0.025 | 0.205 | ||||||
| Male | 71 (38.0%) | 1 | 1 | 1 | |||||
| Female | 116 (62.0%) | 0.76 (0.47–1.023) | 0.54 (0.32–0.93) | 0.70 (0.40–1.22) | |||||
| Age (years) | 0.258 | 0.215 | 0.191 | ||||||
| <65 | 23 (12.3%) | 1 | 1 | 1 | |||||
| >65 | 164 (87.7%) | 1.62 (0.70–3.75) | 1.90 (0.69–5.27) | 2.00 (0.71–5.63) | |||||
| Adjuvant treatment | 0.377 | 0.363 | |||||||
| No | 125 (66.8%) | 1 | 1 | ||||||
| Yes | 55 (29.5%) | 1.15 (0.68–1.94) | 0.17 (0.33–1.21) | ||||||
| Unknown | 7 (3.7%) | ||||||||
| Tobacco | 0.709 | 0.634 | |||||||
| Never | 32 (17.1%) | 1 | 1 | ||||||
| Former | 90 (48.1%) | 1.30 (0.62–2.72) | 0.484 | 0.73 (0.36–1.50) | 0.388 | ||||
| Current | 65 (34.8%) | 1.38 (0.64–2.94) | 0.412 | 0.91 (0.43–1.89) | 0.792 | ||||
Events/n = 67/187 in univariate and multivariate analysis (DFS).
Events/n = 54/187 in univariate and multivariate analysis (OS).
PI: prognostic index.
Validation of the protein-based prognostic score
We performed a further analysis to validate this promising prognostic model in an independent set of lung ADC patients (CIBERES-CUN cohort; supplementary material, Table S1). We analyzed by IHC 99 stage I-II patients with available paraffin embedded surgery specimens and clinical information (DFS data only were available for the CUN cohort). The model was applied and the patients were stratified into two risk groups as above (P=0.041 for DFS and P<0.001 for OS, log-rank test; Figure 3C). In a Cox multivariate analysis, PI remained a significant independent risk factor [P=0.015, HR=3.25 (95% CI, 1.26–8.41) for DFS, and (P=0.021, HR=2.10 (95% CI, 1.12–3.93) for OS (supplementary material, Table S8).
Clinical utility of the prognostic signature
To study the clinical relevance of the proposed molecular model, we analyzed the benefit of combining the pathological stage with the molecular prognostic model (PI) in the MDA cohort, employing a bivariable Cox model. As expected, stage alone was a highly significant prognostic factor for both DFS and OS (P<0.001) (supplementary material, Table S9). Moreover, the likelihood ratio significantly increased after adding the molecular information based on the three proteins (PI) (P<0.001 both for DFS and OS). This improvement showed that the molecular model complements the stage, enriching the prognostic information.
We next performed a Cox regression analysis to develop a new prognostic model combining stage and the molecular model which we named “combined prognostic index” (CPI). The formula to calculate it was CPI = 1.019 × PI + B, where B is a coefficient that changes for each stage (IA, B=0; IB, B=0.421; IIA, B=0.937; IIB, B=1.063 and IIIA, B=1.598). The model performance was significantly improved (C-indexCPI=0.71 vs C-indexPI=0.62 for DFS; C-indexCPI=0.70 vs C-indexPI=0.65 for OS). The five-year survival differences between two groups according to the CPI median were significant in both DFS and OS (P<0.001) (Figure 4A). Moreover, CPI was independent of clinicopathological parameters [P<0.001 HR=2.95 (95% CI, 2.13–4.08) for DFS, and P<0.001 HR=2.56 (95% CI, 1.88–3.49) for OS] (supplementary material, Table S10). We further extended this combined model to the CIBERES-CUN cohort to validate the prognostic value of the CPI. As expected, the OS risk stratification was significantly increased when PI was combined with stage (P<0.001, Figure 4B; C-indexCPI=0.70 vs C-indexPI=0.67). We additionally studied recurrence in the CUN independent cohort. Noticeably, the outcome differences between low and high CPI segmentation were also significant (P=0.001, Figure 4B; C-indexCPI=0.71 vs C-indexPI=0.59). After multivariate analysis, CPI was an independent risk factor for OS [P<0.001 HR=2.36 (95% CI, 1.58–3.51)]; supplementary material, Table S11] and DFS [P=0.011 HR=2.17 (95% CI 1.20–3.92); supplementary material, Table S11].
Figure 4. Assessment of the clinical utility of the prognostic signature.
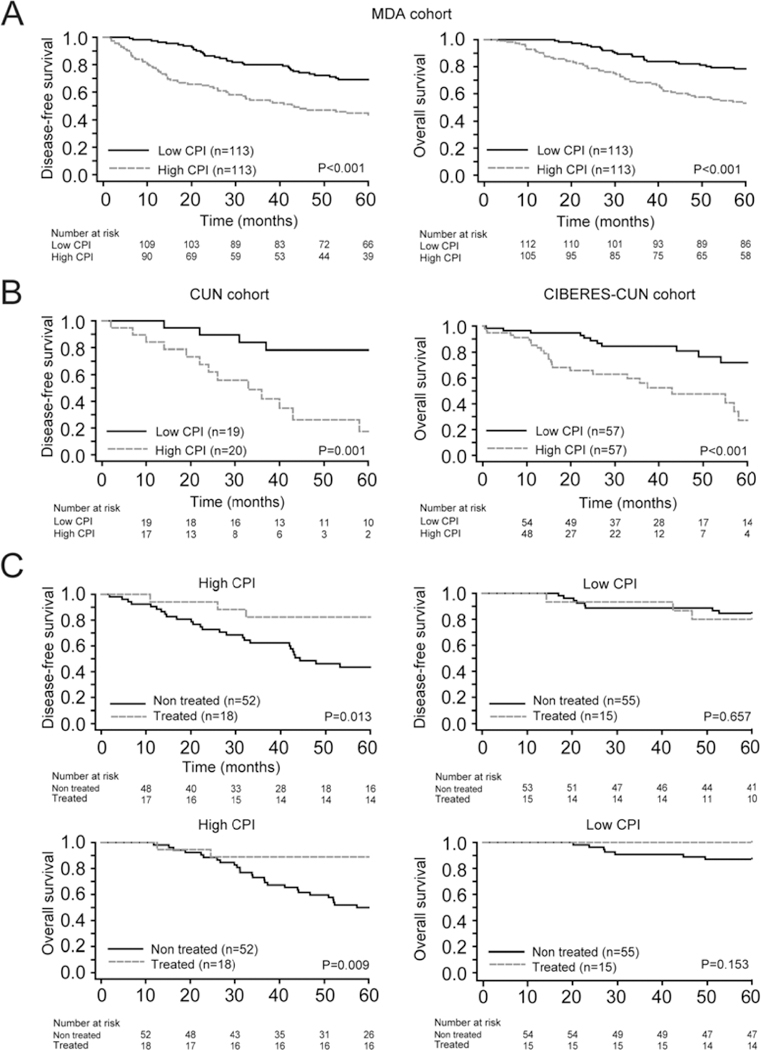
(A) Association between the combined prognostic index (CPI) and survival in patients from MDA cohort. Kaplan-Meier survival plots of DFS (left panel) and OS (right panel) stratifying patients into two risk groups according to the median of the CPI are shown. (B) Validation of CPI model. Kaplan-Meier curves for DFS (left panel) and OS (right panel) in CUN and CIBERES-CUN patients, respectively. Patients were stratified into two risk groups according to the median of the CPI.(C) Study of the predictive value of the prognostic signature in MDA cohort (stage I-IIA patients). Kaplan-Meier curves for high and low CPI groups comparing differences between patients treated or not treated with adjuvant chemotherapy for DFS (top panels) and OS (below panels). Patients were stratified into two groups according to the median of the CPI. Differences between groups were evaluated using the log-rank test.
Finally, we analyzed the potential ability of our prognostic model to go beyond the mere prognostic information. We interrogated our data in order to infer whether the model was able to predict which stage I-IIA patients would benefit of adjuvant therapy following surgical resection. We stratified the MDA cohort by CPI median into two groups (high/low). Then we analyzed the clinical outcome in both groups according to post-surgical treatment. This analysis revealed that patients with a high CPI who received platinum-based adjuvant chemotherapy had better survival (P=0.013 for DFS and P=0.009 for OS, Figure 4C), whereas no differences were observed in patients with a low CPI (P=0.657 for DSF and P=0.153 for OS). These findings suggest that the CPI may be useful for selecting stage I-IIA patients with poor prognosis who may benefit from adjuvant therapy.
To assess the utility of the signature in stage I patients, we conducted a sub-analysis in this subgroup and demonstrated that the classifier is able to separate the patients according their risk of recurrence and/or death in both the test and the training cohorts (supplementary material, Figure S13). Moreover, in this subgroup of stage I patients we observed a benefit in high CPI patients who received adjuvant chemotherapy (P=0.044 for DFS and P=0.011 for OS), whereas no benefit was observed in the low CPI patients (P=0.440 for DFS and P=0.180 for OS) (supplementary material, Figure S14).
DISCUSSION
Optimal lung cancer management in surgically resected patients requires the refinement of individualized treatment decisions. The development of biological discrimination criteria to select early stage patients based on their risk of relapse will help to determine the best treatment options. In this study we identify and validate a protein-based signature as a reliable prognostic tool for the classification of early lung ADC patients. Our signature presents some remarkable novelties in comparison to previously reported prognostic signatures: 1) it is based on the expression of proteins, which are the functionally relevant end-products in the gene expression process; 2) the technology uses simple and affordable immunodetection techniques on FFPE tissue samples; 3) multiple quality controls have been applied to test the specificity of the commercially available antibodies used; 4) stringent and robust statistical methods guarantee the validity of the results; 5) concordant results are found in different independent cohorts of patients; 6) the clinical utility of our model for risk stratification in early stage ADC patients and the subsequent demonstration of the added value of the signature to the staging information provided by the TNM staging system is clearly shown; and 7) the suggestion of the potential clinical utility of our signature to select patients who could benefit from platinum-based adjuvant chemotherapy.
Through a series of filters and strict selection criteria we chose a group of genes previously associated with lung cancer prognosis alone or in combination with others [8,9,20,22,25,32–41]. After applying a thorough method based on Cox regression we have developed a robust prognostic algorithm for early lung ADC prognostication. Several published signatures for ADC comprise dozens to hundreds of genes. By contrast, our parsimonious classifier is formed of just three proteins. The model stratifies the patients into two risk groups according to recurrence or death and clearly provides additional information to the staging prognostic tool. Moreover, we have also developed a combined prognostic index (CPI), including the molecular PI and the pathological stage. Our CPI is able to stratify the risk of recurrence or death better than stage or PI separately. A similar analysis was conducted by Grinberg et al., combining a four-protein model and clinicopathological data (stage, age and performance status). In that study the protein markers fail to outperform the clinical parameters [42], although the addition of the protein markers to the clinicopathological features increased the prognostic power of the signature. Using a different statistical approach, bivariable Cox analysis, we were able to demonstrate that our CPI not only improves the performance of the PI (higher C-indexes) but also complements the prognostic information provided by the stage (better likelihood ratio).
Several studies have proposed mRNA signatures to characterize prognosis in lung ADC [43]. Two of the most developed ones were proposed by Kratz et al. and Wistuba et al, which use microdissected mRNA from FFPE lung cancer tissues [8,9]. By contrast, our classifier uses the protein expression, which is the functionally relevant end product. Moreover, detection of protein expression levels was carried out by IHC, a well mastered microscopy-based method that allows the assessment of the protein expression in a specific subcellular compartment. This issue has been proved to be relevant, as two (SLC2A1 and QKI) of the three proteins included in the signature are present in two different subcellular locations. In the case of SLC2A1 (also known as GLUT1), a glucose transporter that is located in the cytoplasm and the membrane of the cells, but herein only the membrane expression is relevant to predict the prognosis of the ADC patients. The expression and subcellular distribution of SLC2A1 is regulated by different signaling molecules, such as components of the PI3K-AKT pathway, HIF1, Ras, c-Myc and p53. Moreover, SLC2A1 has been previously reported as a predictor of poor survival in lung cancer [44]. On the other hand, QKI, a RNA-binding protein that has been shown to be a master regulator of splicing in lung cancer [34], is present in the nucleus and/or the cytoplasm of the cell. We have observed that both expression levels are related to prognosis but in a different way, with high levels of nuclear QKI being associated with good prognosis, whereas high levels of cytoplasmic QKI being related with worse outcome. We hypothesize that the opposite prognostic role that we have observed in the nuclear and the cytoplasmic levels of QKI in lung tumors could be related with the presence of different isoforms recognized by the antibody in both subcellular compartments [45]. BRCA1 is a nuclear protein involved in essential cellular processes, including DNA repair and cell cycle regulation. It has been described as a tumor suppressor in different malignant neoplasias [46]. However, in lung cancer, several studies have shown that BRCA1 is strongly associated with poor survival and sensitivity to chemotherapy NSCLC [47].
In the emerging era of personalized medicine, well-established IHC assays might be the optimal method to introduce molecular markers in the routine clinical practice [48,49]. Nonetheless, a potential caveat for our study is the interpretation of the IHC staining. The semi-quantitative method used here was performed by two experienced readers independently, and this makes it significantly time-consuming. Quantitative automated image analysis tools could solve this inconvenience, also reducing inter-observer variability between facilities, an important issue for implementing these signatures in routine clinical practice.
The benefit of adjuvant treatment in stage I-IIA patients remains controversial. Some PCR-based predictive signatures have been proposed to date [7,50], but so far none has been incorporated into clinical practice. We demonstrated that our classifier is able to discriminate those stage I-IIA patients at high risk of recurrence and/or death who may benefit from platinum-based adjuvant therapy. Moreover, the signature also identifies those good-prognosis patients that could be spared adjuvant treatment. Further validations in independent cohorts and prospective studies are required to fully confirm these findings.
In summary, our study identifies and validates a three protein-based signature for early lung ADC patients. Moreover, the CPI, a combination of both molecular and clinical criteria, shows potential clinical utility and exerts a great feasibility to be translated to clinical practice. Finally, the use of the protein-based prognostic signature proposed in this study could help clinicians to select the optimal treatment for early stage patients, improving their clinical outcomes.
Supplementary Material
Acknowledgments
The authors thank Ana Remírez and Amaya Lavín for technical assistance, Dr. Marta García-Granero for statistical support and all patients of the centers included in this study. We also thanks the CIBERES multi-institutional Pulmonary Biobank Platform Network (Spain) for providing the material to validate the signatures, especially: Ana Blanco (Hospital Virgen del Rocío, Sevilla), Leoonardo de Esteban Júlvez (Hospital Joan XXIII, Tarragona), Esther Fernández (Servicio de Cirugía Torácica, Hospital Universitari Germans Trias i Pujol, Badal ona), Ma Jesús Fernández-Aceñero (Fundación Jiménez Díaz, Madrid), Ma Ángeles González Castro (Hospital Virgen del Rocío, Sevilla), Guadalupe González (Pont Hospital Mutua de Terrassa, Terrassa), Pedro López de Castro (Hospital Joan XXIII, Tarragona o and CIBER de Enfermedades Respiratorias – CIBERES, Instituto de Salud Carlos III, Madrid), Carlos Martínez-Barenys (CIBER de Enfermedades Respiratorias – CIBERES, Instituto de Salud Carlos III, Madrid, José Luis Mate (Anatomía Patológica, Hospital Universitari Germans Trias i Pujol, Badalona), Rosario Melchor (Fundación Jiménez Díaz, Madrid), Ramón Rami-Porta (Hospital Mutua de Terrassa, Terrassa and CIBER de Enfermedades Respiratorias – CIBERES, Instituto de Salud Carlos III, Madrid), Julio Sánchez de Cos (Servicio de Neumología, Hospital San Pedro de Alcántara, Cáceres and CIBER de Enfermedades Respiratorias – CIBERES, Instituto de Salud Carlos III, Madrid), Rosa María Sánchez Gil (Hospital Virgen del Rocío, Sevilla), Jaume Sauleda (Servicio de Neumología, Hospital Universitari Son Espases, Palma, Institut d investigació Sanitària de Palma, IdISPa and CIBER de Enfermedades Respiratorias – CIBERES, Instituto de Salud Carlos III, Madrid), Sergio Scrimini (Servicio de Neumología, Hospital Universitari Son Espases, Palma, Institut dinvestigació Sanitària de Palma, IdISPa and CIBER de Enfermedades Respiratorias – CIBERES, Instituto de Salud Carlos III, Madrid), Luis Seijo (Fundación Jiménez Díaz, Madrid and CIBER de Enfermedades Respiratorias – CIBERES, Instituto de Salud Carlos III, Madrid, Mireia Serra (Hospital Mutua de Terrassa, Terrassa) y Cristina Villena (CIBER de Enfermedades Respiratorias – CIBERES, Instituto de Salud Carlos III, Madrid.
Funnding sources: This work was supported by FIMA, Spanish Ministry of Economy and Innovation and Fondo de Investigación Sanitaria-Fondo Europeo de Desarrollo Regional (12/02040, PI13/00806, PI16/01821, RTICC RD12/0036/0040), PII Oncologia Torácica SEPAR y Ciber de Enfermedades Respiratorias-CIBERES–FEDER, CIBERONC and AECC Scientific Foundation (GCB14 – 2170).
Footnotes
Conflict of interest statement: JA, EMT, MJP, RP and LMM are listed as co-inventors of a recently applied patent related to some of the results included in this manuscript
REFERENCES
- 1.Siegel RL, Miller KD, Jemal A. Cancer Statistics, 2017. CA Cancer J Clin 2017; 67: 7–30. [DOI] [PubMed] [Google Scholar]
- 2.Uramoto H, Tanaka F. Recurrence after surgery in patients with NSCLC. Transl Lung Cancer Res 2014; 3:242–249. [DOI] [PMC free article] [PubMed] [Google Scholar]
- 3.Bradbury P, Sivajohanathan D, Chan A, et al. Postoperative adjuvant systemic therapy in completely resected non-small-cell lung cancer: a systematic review. Clin Lung Cancer 2017; 18: 259–273. [DOI] [PubMed] [Google Scholar]
- 4.Shieh Y, Bohnenkamp M. Low-dose computed tomography for lung cancer screening: clinical and coding considerations. Chest 2017; 152: 204–209. [DOI] [PubMed] [Google Scholar]
- 5.National Lung Screening Trial Research Team, Aberle DR, Adams AM, et al. Reduced lung-cancer mortality with low-dose computed tomographic screening. N Engl J Med 2011; 365: 395–409. [DOI] [PMC free article] [PubMed] [Google Scholar]
- 6.Vargas AJ, Harris CC. Biomarker development in the precision medicine era: lung cancer as a case study. Nat Rev Cancer 2016; 16: 525–537. [DOI] [PMC free article] [PubMed] [Google Scholar]
- 7.Feldman R Kim ES. Prognostic and predictive biomarkers post curative intent therapy. Ann Transl Med 2017; 5: 374. [DOI] [PMC free article] [PubMed] [Google Scholar]
- 8.Kratz JR He J, Van Den Eeden SK, et al. A practical molecular assay to predict survival in resected non-squamous, non-small-cell lung cancer: development and international validation studies. Lancet 2012; 379:823–832. [DOI] [PMC free article] [PubMed] [Google Scholar]
- 9.Wistuba II, Behrens C, Lombardi F, et al. Validation of a proliferation-based expression signature as prognostic marker in early stage lung adenocarcinoma. Clin Cancer Res 2013; 19: 6261–6271. [DOI] [PMC free article] [PubMed] [Google Scholar]
- 10.Rakha E, Pajares MJ, Ilie M, et al. Stratification of resectable lung adenocarcinoma by molecular and pathological risk estimators. Eur J Cancer 2015; 51: 1897–1903. [DOI] [PubMed] [Google Scholar]
- 11.Tang H, Wang S, Xiao G, et al. Comprehensive evaluation of published gene expression prognostic signatures for biomarker-based lung cancer clinical studies. Ann Oncol 2017; 28: 733–740. [DOI] [PMC free article] [PubMed] [Google Scholar]
- 12.Phillips T, Simmons P, Inzunza HD, et al. Development of an automated PD-L1 immunohistochemistry (IHC) assay for non-small cell lung cancer. Appl Immunohistochem Mol Morphol 2015; 23: 541–549. [DOI] [PMC free article] [PubMed] [Google Scholar]
- 13.Wolff AC, Hammond ME, Hicks DG, et al. Recommendations for human epidermal growth factor receptor 2 testing in breast cancer: American Society of Clinical Oncology/College of American Pathologists clinical practice guideline update. J Clin Oncol 2013; 31: 3997–4013. [DOI] [PubMed] [Google Scholar]
- 14.Monsó E, Montuenga LM, de Cos Sánchez J, et al. Biological marker analysis as part of the CIBERES-RTIC Cancer-SEPAR strategic project on lung cancer. Arch Bronconeumol 2015; 51: 462–467. [DOI] [PubMed] [Google Scholar]
- 15.Travis WD, World Health Organization., International Agency for Research on Cancer, International Association for the Study of Lung Cancer. International Academy of Pathology Pathology and genetics of tumours of the lung, pleura, thymus and heart. Lyon Oxford: IARC Press Oxford University Press; 2004. [Google Scholar]
- 16.Goldstraw P, Chansky K, Crowley J, et al. The IASLC lung cancer staging project: proposals for revision of the TNM Stage Groupings in the forthcoming (eighth) edition of the TNM Classification for Lung Cancer. J Thorac Oncol 2016; 11: 39–51. [DOI] [PubMed] [Google Scholar]
- 17.Altman DG, McShane LM, Sauerbrei W, et al. Reporting Recommendations for Tumor Marker Prognostic Studies (REMARK): explanation and elaboration. PLoS Med 2012; 9: e1001216. [DOI] [PMC free article] [PubMed] [Google Scholar]
- 18.Bild AH, Yao G, Chang JT, et al. Oncogenic pathway signatures in human cancers as a guide to targeted therapies. Nature 2006; 439: 353–357. [DOI] [PubMed] [Google Scholar]
- 19.Lee ES, Son DS, Kim SH, et al. Prediction of recurrence-free survival in postoperative non-small cell lung cancer patients by using an integrated model of clinical information and gene expression. Clin Cancer Res 2008; 14: 7397–7404. [DOI] [PubMed] [Google Scholar]
- 20.Director’s Challenge Consortium for the Molecular Classification of Lung Adenocarcinoma, Shedden K, Taylor JM, et al. Gene expression-based survival prediction in lung adenocarcinoma: a multi-site, blinded validation study. Nat Med 2008; 14: 822–827. [DOI] [PMC free article] [PubMed] [Google Scholar]
- 21.Okayama H, Kohno T, Ishii Y, et al. Identification of genes upregulated in ALK-positive and EGFR/KRAS/ALK-negative lung adenocarcinomas. Cancer Res 2012; 72: 100–111. [DOI] [PubMed] [Google Scholar]
- 22.Tomida S, Takeuchi T, Shimada Y, et al. Relapse-related molecular signature in lung adenocarcinomas identifies patients with dismal prognosis. J Clin Oncol 2009; 27: 2793–2799. [DOI] [PubMed] [Google Scholar]
- 23.Wilkerson MD, Yin X, Walter V, et al. Differential pathogenesis of lung adenocarcinoma subtypes involving sequence mutations, copy number, chromosomal instability, and methylation. PLoS One 2012; 7:e36530. [DOI] [PMC free article] [PubMed] [Google Scholar]
- 24.Larsen JE, Pavey SJ, Bowman R et al. Gene expression of lung squamous cell carcinoma reflects mode of lymph node involvement. Eur Respir J 2007; 30: 21–25. [DOI] [PubMed] [Google Scholar]
- 25.Raponi M, Zhang Y, Yu J, et al. Gene expression signatures for predicting prognosis of squamous cell and adenocarcinomas of the lung. Cancer Res 2006; 66: 7466–7472. [DOI] [PubMed] [Google Scholar]
- 26.Wilkerson MD, Yin X, Hoadley KA, et al. Lung squamous cell carcinoma mRNA expression subtypes are reproducible, clinically important, and correspond to normal cell types. Clin Cancer Res 2010; 16: 4864–4875. [DOI] [PMC free article] [PubMed] [Google Scholar]
- 27.Pajares MJ, Agorreta J, Larrayoz M, et al. Expression of tumor-derived vascular endothelial growth factor and its receptors is associated with outcome in early squamous cell carcinoma of the lung. J Clin Oncol 2012; 30: 1129–1136. [DOI] [PMC free article] [PubMed] [Google Scholar]
- 28.Collins GS, Reitsma JB, Altman DG, et al. Transparent reporting of a multivariable prediction model for individual prognosis or diagnosis (tripod): The tripod statement. Ann Intern Med 2015; 162: 55–63. [DOI] [PubMed] [Google Scholar]
- 29.Harrell F, Lee K, Mark D. Tutorial in biostatistics multivariable prognostic models: issues in developing models, evaluating assumptions and adequacy, and measuring and reducing errors. Stat Med 1996; 15: 361–387. [DOI] [PubMed] [Google Scholar]
- 30.Harrell FE Jr., Lee KL, Mark DB. Multivariable prognostic models: issues in developing models, evaluating assumptions and adequacy, and measuring and reducing errors. Stat Med 1996; 15: 361–387. [DOI] [PubMed] [Google Scholar]
- 31.Smith GC, Seaman SR, Wood AM, et al. Correcting for optimistic prediction in small data sets. Am J Epidemiol 2014; 180: 318–324. [DOI] [PMC free article] [PubMed] [Google Scholar]
- 32.Ezponda T, Pajares MJ, Agorreta J, et al. The oncoprotein SF2/ASF promotes non-small cell lung cancer survival by enhancing survivin expression. Clin Cancer Res 2010; 16: 4113–4125. [DOI] [PubMed] [Google Scholar]
- 33.Grbesa I, Pajares MJ, Martinez-Terroba E, et al. Expression of sirtuin 1 and 2 is associated with poor prognosis in non-small cell lung cancer patients. PLoS One 2015; 10: e0124670. [DOI] [PMC free article] [PubMed] [Google Scholar]
- 34.de Miguel FJ, Pajares MJ, Martinez-Terroba E, et al. A large-scale analysis of alternative splicing reveals a key role of QKI in lung cancer. Mol Oncol 2016; 10: 1437–1449. [DOI] [PMC free article] [PubMed] [Google Scholar]
- 35.Valles I, Pajares MJ, Segura V, et al. Identification of novel deregulated RNA metabolism-related genes in non-small cell lung cancer. PLoS One 2012; 7: e42086. [DOI] [PMC free article] [PubMed] [Google Scholar]
- 36.Roepman P, Jassem J, Smit EF, et al. An immune response enriched 72-gene prognostic profile for early-stage non-small-cell lung cancer. Clin Cancer Res 2009; 15: 284–290. [DOI] [PubMed] [Google Scholar]
- 197.Lu Y, Lemon W, Liu PY, et al. A gene expression signature predicts survival of patients with stage I non-small cell lung cancer. PLoS Med 2006; 3: e467. [DOI] [PMC free article] [PubMed] [Google Scholar]
- 38.Xie Y, Xiao G, Coombes KR, et al. Robust gene expression signature from formalin-fixed paraffin-embedded samples predicts prognosis of non-small-cell lung cancer patients. Clin Cancer Res 2011; 17: 5705–5714. [DOI] [PMC free article] [PubMed] [Google Scholar]
- 39.Beer DG, Kardia SL, Huang CC, et al. Gene-expression profiles predict survival of patients with lung adenocarcinoma. Nat Med 2002; 8: 816–824. [DOI] [PubMed] [Google Scholar]
- 40.Sun Z, Wigle DA, Yang P. Non-overlapping and non-cell-type-specific gene expression signatures predict lung cancer survival. J Clin Oncol 2008; 26: 877–883. [DOI] [PubMed] [Google Scholar]
- 41.Bianchi F, Nuciforo P, Vecchi M, et al. Survival prediction of stage I lung adenocarcinomas by expression of 10 genes. J Clin Invest 2007; 117: 3436–3644. [DOI] [PMC free article] [PubMed] [Google Scholar]
- 42.Grinberg M, Djureinovic D. Reaching the limits of prognostication in non-small cell lung cancer: an optimized biomarker panel fails to outperform clinical parameters. Mod Pathol 2017; 30: 964–977. [DOI] [PubMed] [Google Scholar]
- 43.Subramanian J, Simon R. Gene expression-based prognostic signatures in lung cancer: ready for clinical use? J Natl Cancer Inst 2010; 102: 464–474. [DOI] [PMC free article] [PubMed] [Google Scholar]
- 44.Barron CC, Bilan PJ, Tsakiridis T, et al. Facilitative glucose transporters: Implications for cancer detection, prognosis and treatment. Metabolism 2016; 65: 124–139. [DOI] [PubMed] [Google Scholar]
- 45.Hardy RJ, Loushin CL, Friedrich VL Jr., et al. Neural cell type-specific expression of QKI proteins is altered in quakingviable mutant mice. J Neurosci 1996; 16: 7941–7949. [DOI] [PMC free article] [PubMed] [Google Scholar]
- 46.Welcsh PL, King M-C. BRCA1 and BRCA2 and the genetics of breast and ovarian cancer. Hum Mol Genet 2001; 10: 705–713. [DOI] [PubMed] [Google Scholar]
- 47.Rosell R, Skrzypski M, Jassem E, et al. BRCA1: a novel prognostic factor in resected non-small-cell lung cancer. PloS one 2007; 2: e1129. [DOI] [PMC free article] [PubMed] [Google Scholar]
- 48.Pirker R, Filipits M. Personalized treatment of advanced non-small-cell lung cancer in routine clinical practice. Cancer Metastasis Rev 2016; 35: 141–50. [DOI] [PMC free article] [PubMed] [Google Scholar]
- 49.Sheffield BS. Immunohistochemistry as a practical tool in molecular pathology. Arch Pathol Lab Med 2016; 140: 766–769. [DOI] [PubMed] [Google Scholar]
- 50.Zhu C-Q, Ding K, Strumpf D, et al. Prognostic and predictive gene signature for adjuvant chemotherapy in resected non-small-cell lung cancer. J Clin Oncol 2010; 28: 4417–4424. [DOI] [PMC free article] [PubMed] [Google Scholar]
Associated Data
This section collects any data citations, data availability statements, or supplementary materials included in this article.