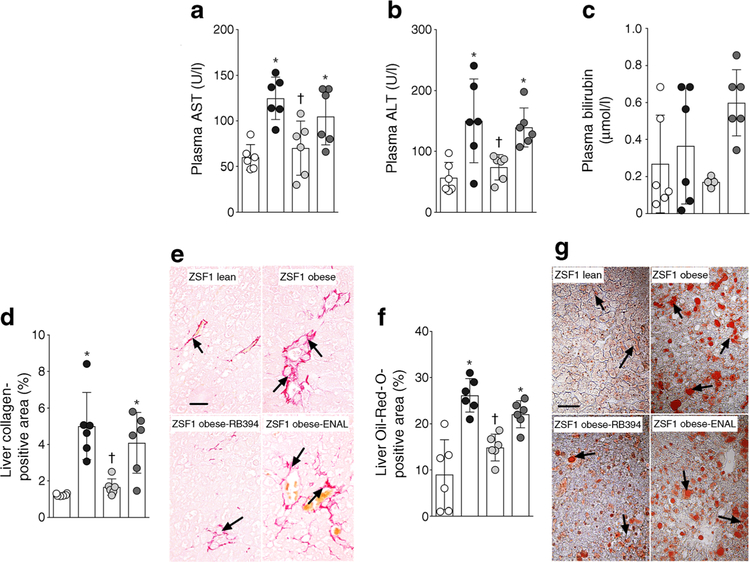
Fig. 7.
(a–c) Plasma levels of aspartate aminotransferase (AST, a), alanine aminotransferase (ALT, b) and bilirubin (c) in rats at the end of the 8 week (56 day) experimental protocol. (d–g) Calculated value of liver collagen-positive area (d), representative photomicrographs depicting collagen-positive areas (arrows) in the liver (e), calculated values of Oil-Red-O-positive (steatosis) liver area (f) and representative photomicrographs of liver steatosis (arrows) (g) in rats at the end of the 8 week (56 days) experimental protocol. Data are expressed as mean ± SEM, n = 6/group. *p < 0.05 vs ZSF1 lean rats;†p < 0.05 vs vehicle-treated ZSF1 obese rats. White circles, vehicle-treated ZSF1 lean rats; black circles, vehicle-treated ZSF1 obese rats; light grey circles, RB394-treated ZSF1 obese rats; dark grey circles, enalapril-treated ZSF1 obese rats. Scale bar, 20 μm in all photomicrographs. ENAL, enalapril

