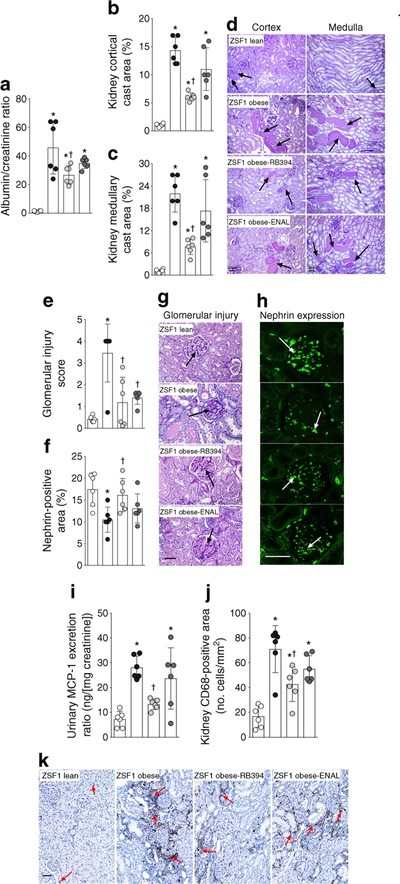
Fig. 8.

(a–d) Albuminuria (a), calculated values of renal cortical (b) and medullary (c) cast area, and representative photomicrographs showing tubular cast (arrows) in the renal cortex and medulla (d) in rats at the end of the 8 week (56 day) experimental protocol. (e–h) Glomerular injury score (e), renal nephrin expression (f) and representative photomicrographs showing glomerular damage (arrows) (g) and nephrin expression (arrows) (h) in rats at the end of the 8 week (56 day) experimental protocol. (i–k) Urinary excretion of MCP-1 (i), CD68-positive inflammatory cells in the kidney (j) and representative photomicrographs depicting CD68-positive cells in the kidney (k) of rats at the end of the 8 week (56 day) experimental protocol. Data are expressed as mean ± SEM, n = 6/group. *p < 0.05 vs ZSF1 lean rats;†p < 0.05 vs vehicle-treated ZSF1 obese rats. White circles, vehicle-treated ZSF1 lean rats; black circles, vehicle-treated ZSF1 obese rats; light grey circles, RB394-treated ZSF1 obese rats; dark grey circles, enalapriltreated ZSF1 obese rats. Scale bar, 50 μm in all photomicrographs. ENAL, enalapril
