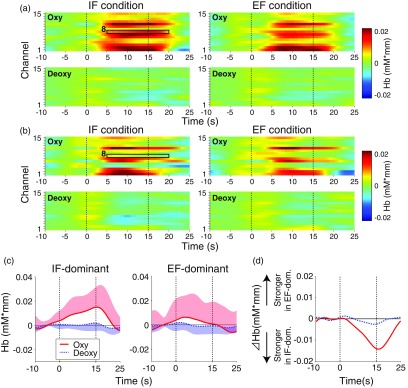
Fig. 5.
Temporal characteristics of oxy-Hb and deoxy-Hb signals. Zero on the horizontal axis indicates the start timing of the motor block. (a, b) Upper row: Under the IF condition, oxy-Hb signal in ch.8 showed a marked difference between the IF- and EF-dominant subgroups. Lower row: Deoxy-Hb signals showed neither strong temporal change nor intersubgroup difference. (c) Temporal profiles of oxy-Hb and deoxy-Hb signals in ch.8 under the IF condition. Red solid and blue dotted lines represent the time courses of oxy-Hb and deoxy-Hb signals, respectively. The lighter colored regions around the time course data indicate the standard deviation. Note that the profiles of oxy-Hb and deoxy-Hb signals show only upper red and lower blue standard deviation regions, respectively. (d) The differential mean profiles between the IF- and EF-dominant subgroups (EF-dominant subgroup minus IF-dominant subgroup). Positive values on the longitudinal axis indicate a stronger oxy-/deoxy-Hb signal in the EF-dominant subgroup than in the IF-dominant subgroup, whereas negative values indicate the opposite magnitude relation.

