

Abstract
Acute kidney injury (AKI) is a systemic disease associated with widespread effects on distant organs, including the heart. Normal cardiac function is dependent on constant ATP generation, and the preferred method of energy production is via oxidative phosphorylation. Following direct ischemic cardiac injury, the cardiac metabolome is characterized by inadequate oxidative phosphorylation, increased oxidative stress, and increased alternate energy utilization. We assessed the impact of ischemic AKI on the metabolomics profile in the heart. Ischemic AKI was induced by 22 minutes of renal pedicle clamping, and 124 metabolites were measured in the heart at 4 hours, 24 hours, and 7 days post-procedure. 41% of measured metabolites were affected, with the most prominent changes observed 24 hours post-AKI. The post-AKI cardiac metabolome was characterized by amino acid depletion, increased oxidative stress, and evidence of alternative energy production, including a shift to anaerobic forms of energy production. These metabolomic effects were associated with significant cardiac ATP depletion and with echocardiographic evidence of diastolic dysfunction. In the kidney, metabolomics analysis revealed shifts suggestive of energy depletion and oxidative stress, which were reflected systemically in the plasma. This is the first study to examine the cardiac metabolome after AKI, and demonstrates that effects of ischemic AKI on the heart are akin to the effects of direct ischemic cardiac injury.
Keywords: organ cross talk, metabolomics, cardiorenal syndrome, acute kidney injury
Introduction.
Acute kidney injury (AKI) is a common complication in hospitalized patients, and independently increases mortality rates.1,2 Clinical and basic research into the mechanisms by which AKI leads to increased mortality has revealed that AKI is a systemic disease with widespread deleterious effects on distant organs, including the heart 3–5 whereby cardiorenal syndrome type 3 defines the syndrome in which AKI causes acute cardiac dysfunction.6 AKI is associated with both short and long term adverse effects on cardiac function,6–9 especially in the presence of other cardiac complications such as heart failure,7 myocardial infarction,10,11 post-cardiac surgery,12–14 and after percutaneous coronary interventions. 15,16.
Compelling data from animal studies demonstrate that AKI directly impairs cardiac function. Two separate research groups have demonstrated that cardiac contractility by echocardiograms is reduced in rodent models of AKI at 48 17 and 72 18 hours. Normal cardiac contractility is dependent on constant ATP generation and the preferred energy source is oxidative phosphorylation which occurs in the mitochondria. Thus, it is not surprising that mitochondrial defects (e.g., fracturing) 18 and apoptosis 18,19 are also associated with AKI-mediated heart injury. Indeed, reduced ATP generation due to inadequate mitochondrial oxidative phosphorylation is a fundamental mechanism of impaired cardiac contractility.20 The hallmarks of inadequate oxidative phosphorylation include oxidative stress and utilization of alternative mechanisms of energy production; metabolomics analyses of the heart in numerous models of cardiac injury - including myocardial infarction/ischemia 21,22, myocarditis 23, and heart failure 21 – have revealed these effects. To date, however, metabolomics analysis in AKI-mediated heart injury has not been performed and the extent to which AKI effects energy production and metabolism in the heart is unknown.
In the present study, metabolomics analysis was performed on heart tissue at 4 hours, 24 hours, and 7 days after ischemic AKI in mice to test the hypothesis that the cardiac metabolome would be characterized by impaired oxidative phosphorylation, increased oxidative stress, and evidence of alternative energy production.
Results
Time course of AKI
Serum creatinine and BUN were determined in normal mice and at each time point after sham and AKI. As shown in Figure 1, serum creatinine was significantly increased at 4 and 24 hours post procedure in AKI versus sham and was not significantly different at 7 days; BUN was significantly increased in AKI versus sham at all three time points.
Figure 1. Time course of AKI.

(A) Serum creatinine and (B) BUN were determined in normal controls and at 4 hour, 24 hours, and 7 days after Sham and AKI. (n=6 to 10)).(0ne way ANOVA comparing the mean all groups with Tukey’s multiple comparison test. Mean+/−SD. * P<0.001 vs. 4 hr Sham; **P<0.0001 vs. 24 hour sham; NS vs 7 day sham; ***P<0.0001 vs. 4 hr Sham, 24 hour sham, or 7 day Sham respectively).
Significant metabolites in the heart via HCA, PCA, PLS-DA
Of the 124 named metabolites measured in the heart, 89 were significantly different among experimental groups based on univariate ANOVA without post-hoc analysis, as shown in Supplemental Table 1. Hierarchical clustering analysis (HCA) and principal component analysis (PCA) were performed for these 89 metabolites to visualize overall trends in the data. The HCA heat map is shown in Figure 2; the PCA observations plots and biplots are shown in Figure 3. Both HCA and PCA reveal that the most notable differences in metabolites has occurred in the 24 hour AKI group.
Figure 2. Hierarchical clustering analysis (HCA) of heart metabolites.

HCA, with predefined sample clusters, was performed for the 89 heart metabolites significantly altered (ANOVA) to determine trends across the metabolome (red is increasing, blue is decreasing across each row). The correlation metric used was the Pearson (n-1) correlation with an average linkage method.
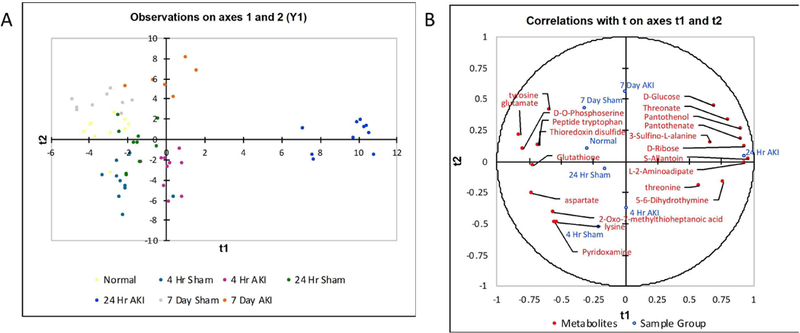
Figure 3. Principal Component Analysis Sample Group Observations Plots (A-C) and Biplots (D-E). Observations plots:

Principal component analysis was performed using the Pearson (n-1) correlation to determine if the 7 groups were distinguishable and identify variances in the data as a whole. Principal component 1 (Axis F1) represented 21.36% of the variation in the data, principal component 2 (Axis F2) represented 14.96% of the variation in the data, and principal component 3 (Axis F3) represented 9.80% of the variation in the data. 24 hour AKI is the most distinguishable group, illustrated by F1. Dots represent individual samples and confidence ellipses were graphed. (A) Observations plot of principal component 1 (F1, 21.36%) and principal component 2 (F2, 14.96%) (B) Observations plot of principal component 2 and principal component 3 (F3, 9.80%) (C) Observations plot of principal component 1 and principal component 3. Biplots: Principal component analysis was done to distinguish groups and find metabolites contributing to the group separation. PCA biplots are graphed here and include both observations (samples) and loadings (metabolites) plotted on the same graph. The metabolites shown are those that have a minimum sum of squared cosines of 0.5 between the two principal components graphed. The sum of squared cosines is a measure to find significant variables in the projection. Metabolites far from the origin in the same location of a group contribute to that group’s separation. These metabolites are positively correlated with each other and are increased in that group. If the group were mirrored over the axes, metabolites in the same location as the mirrored group are decreased in that group and positively correlated with each other. (A) Biplot of principal component 1 and principal component 2 (B) Biplot of principal component 2 and principal component 3 (C) Biplot of principal component 1 and principal component 3.
To further examine overall trends, PLS-DA was performed in order to identify the metabolites that contribute to the greatest variance between experimental groups (Figure 4A,B). The top 20 metabolites with the highest sum of variance between groups, which is referred to as a variable of importance in the projection (VIP) score, are displayed in the correlation plot in Figure 4B. Overall, PLS-DA further reveals the significance of the 24-hour AKI group.
Figure 4. Partial Least Squares Discriminant Analysis (PLS-DA) Sample Group Observations Plot and Correlation Biplot.
(A) PLS-DA was performed to further distinguish sample groups and identify metabolites contributing to the group separation. (B) The top 20 metabolites with the highest sum of variable importance in the projection (VIP) of the two components. In the correlations biplot, the closer the variables are to the unit circle, the higher the contribution in the projection. The group weights are also indicative of the importance of the group in the projection based on their proximity to the unit circle. Group weights and metabolites in proximity to each other are positively correlated. If the group weights were mirrored over the axes, the metabolites in close proximity to the mirrored group weights are negatively correlated.
Metabolites and metabolic pathways affected in the heart by surgical stress
Since surgery itself is associated with cardiac stress, we determined which metabolites were affected by surgical stress alone, independent of AKI, by comparing the sham groups with the normal group (by ANOVA) as shown in Supplemental Table 2A. Pathway analysis identifying significant pathways affected by surgical stress is shown in Supplemental Table 2B.
Specific metabolites and metabolic pathways affected in the heart by AKI
Specific metabolites affected by AKI are shown in Table 1; overall, 51 of the 124 measured metabolites (41%) were affected after AKI. The most dramatic metabolic changes occurred at 24 hours with 20 metabolites significantly decreased and 20 metabolites significantly increased. Changes at 4 hours were minimal, with 6 metabolites decreased and only one increased. Interestingly, metabolic effects were still noted 7 days post AKI, with a change in 15 of the measured metabolites.
Table 1. Metabolites significantly decreased or increased in the heart at 4, 24, and/or 7 days after AKI.
Metabolites are categorized by major pathway involvement (in parentheses). Metabolites in bold were affected at more than one time point.
| Metabolites significantly decreased in the heart after AKI | ||
|---|---|---|
| 4 hours | 24 hours | 7 days |
| Alanine | Alanine (Amino Acid) | Valine (Amino Acid) |
| Glutamate | Glutamate (Amino Acid) | Cytidine (Pyrimidine Metabolism) |
| D-O-Phosphoserine | D-O-Phosphoserine (Glycine, Serine, And Tdreonine Metabolism) | |
| Thioredoxin Disulfide | Thioredoxin Disulfide (Redox Homeostasis) | |
| Succinate (TCA Cycle) | Aspartate (Amino Acid) | |
| Leucine/Isoleucine (Amino Acid)† | Glycine (Amino Acid) | |
| Lysine (Amino Acid) | ||
| Tyrosine (Amino Acid) | ||
| Histidine (Amino Acid) | ||
| Adenine (Purine) | ||
| Adenosine (Purine Metabolism) | ||
| 2-Oxo-7-Methylthioheptanoic Acid (Carboxylate Metabolism) | ||
| Glutathione (Glutathione Metabolism) | ||
| Pyridoxamine (Vitamin B6 Metabolism) | ||
| L-Citrulline (Urea Cycle) | ||
| Ornithine (Urea Cycle) | ||
| Serotonin (Signaling) | ||
| Trans-4-Hydroxy-L-Proline (Arginine And Proline Metabolism) | ||
| 3-Phospho-D-Erythronate (Other) | ||
| Peptide Tryptophan (Other) | ||
| Adenine (Purine) | ||
| Adenosine (Purine Metabolism) | ||
| 2-Oxo-7-Methylthioheptanoic Acid (Carboxylate Metabolism) | ||
| Glutathione (Glutathione Metabolism) | ||
| Glycine (Amino Acid) | ||
| Metabolites significantly increased in the heart after AKI | ||
|---|---|---|
| 4 hours | 24 hours | 7 days |
| S-Allantoin | S-Allantoin (Purine Metabolism) | |
| Glucose (Glycolysis) | Glucose (Glycolysis) | |
| S-Glutathionyl-L-Cysteine (Glutathione Metabolism) | S-Glutathionyl-L-Cysteine (Glutathione Metabolism) | |
| Threonate (Ascorbate Metabolism) | Threonate (Ascorbate Metabolism) | |
| Pantothenate (Pantothenate And CoA Biosynthesis) | Pantothenate (Pantothenate And CoA Biosynthesis) | |
| Pantothenol (Pantothenate And CoA Biosynthesis) | Pantothenol (Pantothenate And CoA Biosynthesis) | |
| N6-Methyl-L-Lysine (Lysine Metabolism) | N6-Methyl-L-Lysine (Lysine Metabolism) | |
| Threonate (Ascorbate Metabolism) | Threonate (Ascorbate Metabolism) | |
| 5-Hydroxyisourate (Purine Metabolism) | Serotonin (Signaling) | |
| 5–6-Dihydrothymine (Pyrimidine Metabolism) | 5-L-Glutamyl-Peptide (Glutathione Metabolism) | |
| UMP (Pyrimidine Metabolism) | N-Glycoloyl-Neuraminate (Aminosugar Metabolism) | |
| D-Glucose 6-Phosphate (Glycolysis) | Adenosine (Purine Metabolism) | |
| 2-Oxoglutaramate (TCA Cycle) | 4-Aminobenzoate (Other) | |
| D-Glucono-1–5-Lactone 6-Phosphate (Pentose Phosphate Pathway) | L-Citrulline (Urea Cycle) | |
| D-Ribose (Pentose Phosphate Pathway) | Ornithine (Urea Cycle) | |
| Ascorbate (Glutathione Metabolism) | ||
| Gamma-L-Glutamyl-D-Alanine (Glutathione Metabolism) | ||
| 3-Oxalomalate (Glycoxylate And Dicarboxylate Metabolism) | ||
| Dethiobiotin (Biotin Metabolism) | ||
| L-2-Aminoadipate (Lysine Metabolism) | ||
Pathway analysis was performed and significant pathways affected by AKI are presented in Table 2.
Table 2. Metabolic pathways significantly affected in the heart after AKI.
| Metabolic pathways significantly affected in t | he heart by AKI | |
|---|---|---|
| 4 hours | 24 hours | 7 days |
| Pantothenate and CoA biosynthesis | Pantothenate and CoA biosynthesis | |
| Alanine, aspartate and glutamate metabolism | ||
| Aminoacyl-tRNA biosynthesis | ||
| Arginine and proline metabolism | ||
| beta-Alanine metabolism | ||
| Cyanoamino acid metabolism | ||
| Glutathione metabolism | ||
| Glycine, serine and threonine metabolism | ||
| Histidine metabolism | ||
| Lysine biosynthesis | ||
| Lysine degradation | ||
| Methane metabolism | ||
| Nitrogen metabolism | ||
| Pentose phosphate pathway | ||
| Phenylalanine metabolism | ||
| Phenylalanine, tyrosine and tryptophan biosynthesis | ||
| Primary bile acid biosynthesis | ||
| Purine metabolism | ||
| Pyrimidine metabolism | ||
| Selenoamino acid metabolism | ||
Relative changes in individual metabolites, and implications regarding energy production and oxidative stress.
To better clarify the effects of AKI on the heart and visualize relative changes in metabolite levels, autoscaled values for all the significant metabolites affected after AKI are presented in Figures 5 to 8 and grouped into the following major categories: amino acids and amino acid metabolites (Figure 5); anti-oxidants and metabolites involved anti-oxidant pathways (Figure 6); metabolites involved in alternate energy production (Figure 7); and urea cycle and other metabolites (Figure 8).
Figure 5. Amino acids and amino acid products affected in the heart after AKI.

10 amino acids (A-C;E-K) and 4 amino acid products (L-O) were affected at 4, 24 hours, and/or 7 days after AKI in the heart. Leucine/isoleucine, alanine, and glutamate (A-C) were decreased 4 hours after AKI relative to sham; glutamate, alanine, glycine, aspartate, lysine and tyrosine (B-G) were decreased in the heart 24 hours after AKI relative to sham; threonine and histidine (H, I) were increased 24 hours after AKI relative to sham; and valine (J) was decreased in the heart 7 days after AKI relative to sham. (D) The alanine to glutamate ratio is marker of increased anerobic metabolism of glutamate; its increase at 24 hours post AKI is indicative of anaerobic metabolism and ATP depletion (Data are normalized values via autoscaling and presented as box and whisker plots which show median and the 25th and 75th percentiles as the ‘boxes’ and the min and max values as the ‘whiskers’. * p < 0.05, ** p < 0.01, *** p < 0.001, **** p < 0.0001).
Figure 8. Urea cycle metabolites and other metabolites affected in the heart after AKI.

2 metabolites involved in the urea cycle were affected in the heart after AKI (A-B, citrulline and ornithine). Pyridoxamine (C), peptide tryptophan (D), 2-oxo-7-methylthioheptanoic acid (E), and 3-phospho-D-erythronate (F) were decreased in the heart 24 hours after AKI relative to sham; 3- oxalomalate (G), dethiobiotin (H), and serotonin (I) were increased in the heart 24 hours after AKI relative to sham; serotonin (I), 4-aminobenzoate (J), and N-glycoloyl-neuraminate (K) were increased in the heart 7 days after AKI relative to sham (Data are normalized values via autoscaling and presented as box and whisker plots which show median and the 25th and 75th percentiles as the ‘boxes’ and the min and max values as the ‘whiskers’; * p < 0.05, ** p < 0.01, *** p < 0.001, **** p < 0.0001).
Figure 6. Metabolites involved in oxidative-stress associated pathways in the heart following AKI.

Glutathione (an anti-oxidant) (A), glutathione metabolites (B-D), ascorbate (i.e., Vitamin C, an anti-oxidant) (E), threonate (a Vitamin C metabolite, an anti-oxidant), and thioredoxin disulfide (an anti-oxidant) (G) were affected at 4 hours, 24 hours, and/or 7 days after AKI in the heart. (Data are normalized values via autoscaling and presented as box and whisker plots which show median and the 25th and 75th percentiles as the ‘boxes’ and the min and max values as the ‘whiskers’; * p < 0.05, ** p < 0.01, *** p < 0.001, **** p < 0.0001).
Figure 7. Energy metabolites affected in the heart after AKI.

Metabolite changes implicate glycolysis and the pentose phosphate pathway (A-D); TCA cycle (E-H); purine metabolism ((I-L), and pyrimidine metabolism (M-O) in the heart after AKI. (Data are normalized values via autoscaling and presented as box and whisker plots which show median and the 25th and 75th percentiles as the ‘boxes’ and the min and max values as the ‘whiskers’; * p < 0.05, ** p < 0.01, *** p < 0.001, **** p < 0.0001).
Amino acid deficiency and implications.
As shown in Figure 5, several amino acids were decreased in the heart at 4 and/or 24 hours after AKI and include alanine, aspartate, glutamate, glycine, lysine, and tyrosine. Amino acid depletion characteristically occurs during cardiac ischemia and other forms of cardiac stress and reflects a number of injury-associated events such as hypoxia, ischemia reperfusion injury, ATP depletion, inadequate oxidative phosphorylation, increased alternative energy production, and increased oxidative stress 24–26. Normally, amino acid metabolism constitutes a very small percentage of cardiac ATP production; however, when oxidative phosphorylation is inadequate, amino acid metabolism increases and becomes an important source of ATP production 25. In particular, glucogenic amino acids such as aspartate and glutamate can be converted to glycolysis and TCA cycle intermediates to generate ATP.
The reduction in glutamate and aspartate is particularly notable as these amino acids are reduced in cardiac biopsies in patients after cardiac bypass and reductions are associated with ATP depletion and cardiac ischemia. 24–26 Thus, decreased glutamate, aspartate, and alanine likely reflect ongoing amino acid metabolism. An additional explanation is the use of glutaminolysis and transamination fueling the production of aspartate, which is then used in purine nucleotide metabolism to generate fumarate;27 fumarate is reduced to succinate via the reverse activity of succinate dehydrogenase (complex II), and succinate accumulation drives reactive oxygen species generation.
Since anaerobic metabolism of glutamate is accompanied by an increase in alanine production, an increase in alanine to glutamate ratio has been shown to correlates with increasing tissue ischemia 24,26. As shown in Figure 5D, the alanine to glutamate ratio was significantly increased 24 hour post AKI as further evidence of increased cardiac stress and a shift toward anaerobic metabolism. Glycine (Figure 5F) is also depleted in the heart after myocardial infarction in rats 22, and – like glutamate - is necessary for glutathione synthesis. Thus, the depletion of glutamate and glycine is also suggestive of increased oxidative stress and an attempt to restore depleted glutathione stores (discussed further, below).
Oxidative stress in the heart after AKI.
As shown in Figure 6, metabolite changes associated with imbalanced redox homeostasis were present after AKI, particularly at 24 hours. Increased oxidative stress is a hallmark of cardiac stress and occurs in a wide range of diseases including myocardial infarction 22, myocarditis 23, dilated cardiomyopathy 28, and heart failure 29,30. The significant reduction in glutathione (GSH) (Figure 6A) 24 hours post-AKI is particularly notable since, like amino acid depletion, depletion of glutathione also occurs during direct cardiac ischemia. Glutathione is a potent anti-oxidant which is crucial to normal cardiac function 29,30 and a key defender against excess reactive oxygen species (ROS) and ensuing cell damage.
Additional markers of redox imbalance after AKI include increased 2-aminoadipate (α- aminoadipate) (Figure 5M), 5-hydroxyisourate (Figure 7K), S-allantoin (Figure 7L), 21 threonate (Figure 6F), and ascorbate (Figure 6E) 21 and decreased thioredoxin disulfide (Figure 6G). 2-Aminoadipate is a product of lysine degradation and a marker of protein oxidation; 31,32 its increase may be the result of oxidative stress and protein oxidation as well as lysine degradation. Increased 5-hydroxyisourate and S-allantoin are a result of increased purine metabolism (as judged by the concomitant reduction in the purines adenosine and adenine). Purine catabolism leads to an increase uric acid and downstream products 5-hydroxyisourate and allantoin in ROS-generating reactions33; thus, increased S-allantoin is a well-established biomarker of increased oxidative stress 34–37. Threonate is a metabolite of ascorbate (Vitamin C), and both threonate and ascorbate were increased in the heart after AKI. Ascorbate is increased in murine models of heart failure. 21
Effects of AKI on alternative energy pathways in the heart
As shown in Figure 7, metabolites involved glycolysis, the TCA cycle, pentose phosphate pathway, and nucleotide metabolism were affected in the heart after AKI and suggest a shift toward alternative energy production (e.g., ATP production via mechanisms alternative to oxidative phosphorylation). As with the metabolite changes described above, these energy shifts are common during cardiac stress from multiple causes such as heart failure, 20,21,38–40 cardiac ATP depletion, 40 myocardial ischemia/infarction, and myocarditis.23 In particular, excess purine metabolism is associated with decreased ATP and anaerobic ATP production 41; increased purine metabolism is suggested by the marked decreased in the purines adenine and adenosine accompanied by increases in their end products (5-hydroxyisourate and S-allantoin). Pyrimidine consumption is also present as evidenced by changes associated with 5–6 dihydrothymine, cytidine, and UMP.
Echocardiography
To determine if the metabolic changes in the heart were associated with functional consequences, serial echocardiography was performed at baseline, and at 24 and 72 hours after sham and AKI. As shown in Figure 9, the E/A ratio was slightly decreased at 24 hours and was significantly decreased at 72 hours post-AKI; this result at 72 hours represents significant diastolic dysfunction. Other parameters of cardiac function were assessed and are listed in Table 3.
Figure 9. Mice with AKI have diastolic dysfunction.

Echocardiography was performed in mice 24 hour and 72 hours after surgery for Sham and AKI. (A) Doppler measurement of mitral inflow velocity (E/A) in sham and AKI mice at 24 and 72 hours after surgery. *P<0.05 versus Sham; N=3–5) (B) Representative E/A Doppler echocardiography images of sham mice at 24 and 72 hours after surgery. (C) Representative E/A Doppler echocardiography images of AKI mice at 24 and 72 hours after surgery. The ratio of the early filling (E) phase of the left ventricle during diastole and the late filling (A) phase is a common echocardiographic measurement of diastolic function. The AKI mice have a slight decrease in diastolic function at 24 hours and a significant decrease at 72 hours post-AKI as indicated by a significant decrease in the E/A ratio.
Table 3. Echocardiographic findings after acute kidney injury (AKI).
Echocardiography was performed in Normal mice, Sham, and AKI at 24 and 72 hours. Heart rate, ejection fraction, fractional shortening, left ventricular (LV) volume during diastole, LV volume during systole, and E/A were determined. E/A is the ratio of early diastolic filling pressure versus the atrial (late) diastolic filling pressure; the level of reduced E/A 72 hours after AKI is indicative of significant diastolic dysfunction. BPM: beats per minute; LV: left ventricle. *P<0.05 versus Sham; NS for all other comparisons. N=3–5.
| 24 hours | Heart Rate (BPM) |
Ejection Fraction (%) |
Fractional Shortening (%) |
LV volume diastole (uL) |
LV volume systole (uL) |
E/A |
|---|---|---|---|---|---|---|
| Normal | 562±53 | 64±2 | 34±2 | 60±5 | 22±3 | 1.42±0.28 |
| Sham | 497±23 | 62±4 | 33±3 | 76±16 | 29±8 | 1.40±0.13 |
| AKI | 486±13 | 57 ±4 | 30±1 | 81±10 | 35±7 | 1.26±0.12 |
| 72 hours | ||||||
| Normal | 536±41 | 62±2 | 33±1 | 66±10 | 25±4 | 1.42±0.20 |
| Sham | 540±85 | 60±6 | 32±4 | 68±13 | 27±8 | 1.48±0.13 |
| AKI | 495±44 | 59±3 | 31±2 | 56±6 | 23±3 | 1.09±0.12* |
ATP levels
ATP depletion is a well described cause of diastolic dysfunction 42 and the metabolic changes strongly suggested the presence of ATP depletion. Therefore, ATP levels were measured in normal mice, sham, and AKI at 4, 24, and 72 hours. As shown in Figure 10, ATP levels were non-significantly decreased at 4 hours of AKI, and were significantly decreased at 24 and 72 hours of AKI; these result are thus consistent with the metabolic observations and echocardiographic findings.
Figure 10. ATP levels in the heart are reduced at 24 hour 72 hours after AKI.

ATP levels were determined in the left ventricle of the heart in normal, sham, and AKI mice at 4, 24, and 72 hours. (A) ATP levels were reduced at 4 hours post AKI compared to normal and sham but did not reach statistical significance and were significantly reduced at 24 and 72 hours of AKI versus normal and sham at the same time point. *P<0.05 versus 4 hour AKI. (N=3–14 as indicated in the figure). (B) Graphic representation of the data in (A) demonstrating the dramatic reduction of ATP levels in the left ventricle during AKI over time. *P<0.05 versus 4 hour AKI
Mean arterial blood pressure (MAP) and weight
Mean arterial blood pressure and weight were determined at baseline, and 24 and 72 hours after sham or AKI in a separate cohort of mice. Plasma creatinine was determined at 24 hours as shown in Figure 11A. As shown in Figure 11B, MAPs were not different between sham and AKI at any time point. As shown in Figure 11C, weights were not different between sham and AKI at any time point (a non-significant trend for a decrease in weight, 72 hours after AKI was present).
Figure 11. Mean arterial blood pressure and weight after AKI.

Mean arterial blood pressure and weight were determined at baseline, and 24 hour hours and 72 hours after Sham and AKI. Plasma creatinine was determine 24 hours after AKI and was significantly increased (A). Mean arterial blood pressure was not different between Sham and AKI at baseline, 24 hours, or 72 hours (B). Weight was not different between Sham and AKI at baseline (prior to surgery for sham or AKI), 24 hours, or 72 hours; (weight trended to decrease in AKI, but did not reach statistical significance)(C). (2 separate experiments, N is indicated below each experimental group).
Volume overload may be associated with diastolic dysfunction 43; however, our data indicate that volume overload is not a feature of our AKI model given that AKI did not affect either MAP or weight; indeed, a slight trend for decreased BP was observed after AKI. Thus, changes in MAP or volume status do not plausibly account for the changes in the cardiac metabolome or function.
Serum potassium
Potassium levels were determined in separate cohorts of mice. Plasma potassium (mEq/L) was 4.17±0.6 in normal mice (n=3), 5.86±0.48 24 hours after AKI (P<0.001 versus normal, n= 8), and 4.13±0.58 72 hours after AKI (P<0.001 versus 24 hour AKI; P=NS versus normal; n=4)(paired t test; 2 separate experiments; mean±SD).
Thus, statistically significant hyperkalemia was observed 24 our after AKI, although it is unlikely that this level of potassium has pathologic significance in the heart given that the level was below 6.0 mEq/L. This is especially true since hyperkalemia is associated with cardiac arrhythmias, but not changes in energy metabolism nor diastolic dysfunction.
Arterial pH
Arterial pH was determined in separate cohorts of mice. As shown in Figure 12, the only significant difference between sham and AKI was at 24 hour with pH values of 7.25±0.03 in sham and 7.12±0.03 in AKI (P<0.001, paired t test; 2 separate experiments; mean±SD). 72 hours after AKI, pH levels were similar to levels in sham and normal mice.
Figure 12. Arterial pH after AKI.

Arterial pH was determined in normal mice, and in mice at 4 hours, 24 hours, 72 hours and one week after Sham and AKI. (4 separate experiments, N is indicated below each experimental group). (*P<0.05)
While acidosis is known to impair cardiac contractility, significant effects are generally noted with severe acidosis (e.g., pH <7.0) as studied in vitro.44 Interestingly, acidosis is protective against ischemia-reperfusion induced ATP depletion.44 72 hours post-AKI, pH has normalized, when ATP depletion and cardiac dysfunction are most severe; thus, it is unlikely that acidosis is responsible for these cardiac effects. Whether the acidosis observed at 24 hours contributed to the metabolic changes in the heart at 24 hours is unresolved and merits additional study.
Metabolite analysis in the kidney and plasma
In order to gain insight into the mechanism by which ischemic AKI might lead to the changes in energy metabolism observed in the heart, metabolomics analysis of kidney and plasma was performed on samples obtained from the same cohorts of mice from which heart metabolomics was performed. Based on univariate ANOVA without post hoc analysis, 141 of the 177 (80%) metabolites measured in the kidney and 117 of the 128 (91%) metabolites measured in the plasma were significantly different among experimental groups as shown in Supplemental Table 4 and 5. HCA heat maps are shown in Figures13 and 14 and PCA observation plots and biplots for these significant metabolites are shown in Supplemental Figures 1–4.
Figure 13. Hierarchical clustering analysis (HCA) of kidney metabolites.

HCA, with predefined sample clusters, was performed for the kidney metabolites significantly altered (ANOVA) to determine trends across the metabolome (red is increasing, blue is decreasing across each row). The correlation metric used was the Pearson (n-1) correlation with an average linkage method.
Figure 14. Hierarchical clustering analysis (HCA) of plasma metabolites.

HCA, with predefined sample clusters, was performed for the plasma metabolites significantly altered (ANOVA) to determine trends across the metabolome (red is increasing, blue is decreasing across each row). The correlation metric used was the Pearson (n-1) correlation with an average linkage method.
In Tables 4–7 all of the metabolites that were significantly decreased or increased in the kidney, plasma, or heart at 4 hours (Tables 4, 5) and at 24 hours (Tables 6, 7) are presented (metabolites that were present in 2 or more sites are in the top section; metabolites present in only one site are in the bottom section and grouped by pathway).
Table 4. Comparison of metabolites that were decreased in the kidney, plasma, and/or heart 4 hours after AKI.
Top:Metabolites that were decreased in more than one site 4 hours after AKI are presented in the top section. Only one metabolite, glutamate, was reduced in two or more compartments and was reduced in the kidney and heart. Bottom: All of the remaining metabolites that were decreased in either the kidney, plasma or heart 4 hours after AKI are included in the bottom section, and grouped by metabolite type/pathway. In total, 4 hours after AKI, 25 metabolites were decreased in the kidney, 3 were decreased in the plasma, and 6 were decreased in the heart.
| Decreased metabolites in the kidney, plasma, and heart at 4 hours | |||
|---|---|---|---|
| Kidney | Plasma | Heart | Metabolite type or pathway |
| Glutamate | Glutamate | Amino acid | |
| Kidney | Plasma | Heart | Metabolite type or pathway |
| Glycine | Arginine | Alanine | Amino acid |
| Cysteine | Leucine/Isoleucine | Amino acid | |
| D-O-Phosphoserine | Serine metabolite | ||
| Guanidinoacetate | Arginine and proline metabolism | ||
| N-Succinyl-L-citrulline | Arginine and proline metabolism | ||
| L-Homocysteine | Cysteine and methionine metabolism | ||
| S-Adenosyl-L-homocysteine | Cysteine and methionine metabolism | ||
| Thioredoxin Disulfide | Antioxidant | ||
| Glutathione | Glutathione (antioxidant) | ||
| 5-L-Glutamyl-L-glutamine | Glutathione metabolism | ||
| 5-Oxoproline | Glutathione metabolism | ||
| Gamma-L-glutamyl-D-alanine | Glutathione metabolism | ||
| Gamma-L-glutamyl-L-cysteine | Glutathione metabolism | ||
| Adenine | Purine | ||
| Inosine | Purine metabolism | ||
| Hypoxanthine | Purine metabolism | ||
| 5–6-Dihydrothymine | Pyrimidine metabolism | ||
| Cytidine | Pyrimidine metabolism | ||
| NAD | Vitamin B3 metabolism, NAD/NADH reactions | ||
| Pyruvate | Glycolysis | ||
| Malate | Succinate | TCA cycle | |
| Ethanolamine phosphate | Glycerophospholipid metabolism | ||
| O-Propanoylcarnitine | Carnitine and fatty acid metabolism | ||
| Poly-gamma-D-glutamate | Other | ||
| S-Formylglutathione | Other | ||
| Shikimate 3-phosphate | Other | ||
| 1-Hydroxy-2-aminoethylphosphonate | Other | ||
| Ectoine | Other | ||
| 25 total | 3 total | 6 total | |
Table 7. Comparison of metabolites that were increased in the kidney, plasma, and/or heart 24 hours after AKI.
Top:Metabolites that were increased in more than one site 24 hours after AKI are presented in the top section. Four metabolites were increased in all three sites. Bottom: All of the remaining metabolites that were increased in the kidney, plasma or heart 24 hours after AKI are included in the bottom section, and grouped by metabolite type/pathway. In total, 24 hours after AKI, 39 metabolites were increased in the kidney, 42 were increased in the plasma, and 20 were increased in the heart.
| Increased metabolites in the kidney, plasma, and heart at 24 hours | |||
|---|---|---|---|
| Kidney | Plasma | Heart | Metabolite type or pathway |
| Ascorbate | Ascorbate | Ascorbate | Vitamin C (anti-oxidant) |
| D-Ribose | D-Ribose | D-Ribose | Pentose phosphate pathway |
| 2-Oxoglutarate | 2-Oxoglutaramate | 2-Oxoglutaramate | TCA cycle |
| 3-Oxalomalate | 3-Oxalomalate | 3-Oxalomalate | TCA cycle |
| Threonate | Threonate | Vitamin C metabolite | |
| Dethiobiotin | Dethiobiotin | Biotin (Vitamin B7) metabolism | |
| S-Allantoin | S-Allantoin | Purine metabolism | |
| D-Glucose 6-Phosphate | D-Glucose 6-Phosphate | Glycolysis | |
| N6-Methyl-L-lysine | N6-Methyl-L-lysine | Lysine Metabolism | |
| Gamma-L-Glutamyl-D-alanine | Gamma-L-Glutamyl-D-alanine | Glutathione metabolism | |
| Histidine | Histidine | Amino acid | |
| 4-Acetamidobutanoate | 4-Acetamidobutanoate | Arginine and proline metabolism | |
| Creatinine | Creatine | Arginine and proline metabolism | |
| Creatinine | Creatinine | Arginine and proline metabolism | |
| N-Acetyl-L-citrulline | N-Acetyl-L-Citrulline | Arginine and proline metabolism | |
| L-Citrulline | L-Citrulline | Arginine metabolism, urea cycle | |
| Dimethylglycine | Dimethylglycine | Glycine, serine, and threonine metabolism | |
| L-Homocitrulline | L-Homocitrulline | Lysine metabolism, urea cycle | |
| Pyridoxal | Pyridoxal | Vitamin B6 metabolism | |
| N-Glycoloyl-Neuraminate | N-Glycoloyl-Neuraminate | Aminosugar | |
| Ornithine | Ornithine | Urea cycle | |
| Homomethionine | Homomethionine | Other | |
| Methylenediurea | Methylenediurea | Other | |
| Kidney | Plasma | Heart | Metabolite type or pathway |
| Arginine | Cystine | Threonine | Amino acid |
| Peptide tryptophan | Glutamine | Amino acid | |
| N-Amidino-L-aspartate | Arginine and proline metabolism | ||
| Phosphocreatine | Arginine and proline metabolism | ||
| 5-Guanidino-2-Oxopentanoate | Arginine and proline metabolism | ||
| 3-Sulfino-L-Alanine | Cysteine and methionine metabolism | ||
| N-Carbamyl-L-glutamate | Histidine metabolism | ||
| Dehydroascorbate | 5-L-Glutamyl-peptide | S-Glutathionyl-L-Cysteine | Glutathione metabolism |
| 5-Oxoproline | Glutathione metabolism | ||
| gamma-L-Glutamylputrescine | Glutathione metabolism | ||
| 5-Hydroxyisourate | Hypoxanthine | 5-Hydroxyisourate | Purine metabolism |
| Xanthine | Purine metabolism | ||
| 5–6-Dihydrothymine | Thymine | 5–6-Dihydrothymine | Pyrimidine metabolism |
| UMP | Pyrimidine metabolism | ||
| D-Glucono-1–5-Lactone 6-Phosphate | Pentose phosphate pathway | ||
| Maleamate | Vitamin B3 metabolism | ||
| Pantothenate | Vitamin B5 | ||
| Pantothenol | Vitamin B5 analog | ||
| Pyridoxamine | 4-Pyridoxate | Vitamin B6 metabolism | |
| D-Glucose | Glycolysis | ||
| Oxalosuccinate | Fumarate | TCA Cycle | |
| L-Arabinose | Monosaccharide | ||
| N-Acetylneuraminate | Aminosugar metabolism | ||
| D-Arabitol | D-Rhamnose | Other sugars | |
| Mannitol | Other sugars | ||
| Other sugars | |||
| Putrescine | 2-Deoxy-Alpha-D-Glucoside | Other | |
| Serotonin | Beta-D-Glucuronoside | Other | |
| Triacanthine | N-Acyl-D-Aspartate | Other | |
| Hydroxyacetone phosphate | Taurine | Other | |
| N5-Methyl-L-glutamine | Orthophosphate | Other | |
| Acetylcholine | N-N-Dimethylglycine | Other | |
| Phosphate | Other | ||
| 39 total | 42 total | 20 total | |
Table 5. Comparison of metabolites that were increased in the kidney, plasma, and/or heart 4 hours after AKI.
Top:Metabolites that were increased in more than one site 4 hours after AKI are presented in the top section. One metabolite, S-Allantoin, was increased in both the plasma and heart; 7 metabolites were increased in both the kidney and plasma. Bottom: All of the remaining metabolites that were increased in the kidney, plasma or heart 4 hours after AKI are included in the bottom section, and grouped by metabolite type/pathway. In total, 4 hours after AKI, 27 metabolites were increased in the kidney, 21 were increased in the plasma, and 1 was increased in the heart.
| Increased metabolites in the kidney, plasma, and heart at 4 hours | |||
|---|---|---|---|
| Kidney | Plasma | Heart | Metabolite type or pathway |
| S-Allantoin | S-Allantoin | Purine metabolism | |
| 2-Deoxy-alpha-D-glucoside | 2-Deoxy-alpha-D-glucoside | Other | |
| 6-Phospho-D-gluconate | 6-Phospho-D-gluconate | Pentose phosphate pathway | |
| Creatinine | Creatinine | Arginine and proline metabolism | |
| L-Homocitrulline | L-Homocitrulline | Lysine metabolism, urea cycle | |
| D-Ribose | D-Ribose | Pentose phosphate pathway | |
| N-Glycoloyl-neuraminate | N-Glycoloyl-neuraminate | Aminosugar metabolism | |
| Tricanthine | Tricanthine | Other | |
| Kidney | Plasma | Heart | Metabolite type or pathway |
| Leucine | Asparagine | Amino acid | |
| Histidine | Amino acid | ||
| Tryptophan | Amino acid | ||
| 4-Acetamidobutanoate | 5-Guanidino-2-oxopentanoate | Arginine and proline metabolism | |
| Carnosine | Phosphocreatine | Arginine and proline metabolism | |
| Homocarnosine | Arginine and proline metabolism | ||
| N-Amidino-L-aspartate | Arginine and proline metabolism | ||
| L-Citrulline | Arginine metabolism, urea cycle | ||
| N-Carbamyl-L-glutamate | Histidine metabolism | ||
| N6-Methyl-L-lysine | Lysine metabolism | ||
| Threonate | Ascorbate metabolism | ||
| 5-L-Glutamyl-Peptide | Glutathione metabolism | ||
| Hypoxanthine | Purine metabolism | ||
| Xanthine | Purine metabolism | ||
| UMP | Pyrimidine metabolism | ||
| D-glucono-1,5-lactone | Pentose Phosphate Pathway | ||
| Nicotinamide (NAM) | Vitamin B3 analog | ||
| Pyridoxal | Vitamin B6 metabolism | ||
| D-Arabitol | D-Rhamnose | Other sugar | |
| Maltose | Other sugar | ||
| L-Arabinose | Monosaccharide | ||
| N-Acetylneuraminate | Aminosugar metabolism | ||
| 3D-3–5/4-Trihydroxycyclohexane-1–2-dione | Beta-D-Glucuronoside | Other | |
| 6-Aminohexanoate | N-Acyl-D-Aspartate | Other | |
| Ferric gluconate | Triacanthine | Other | |
| Homomethionine | Other | ||
| Serotonin | Other | ||
| 27 total | 21 total | 1 total | |
Table 6. Comparison of metabolites that were decreased in the kidney, plasma, and/or heart 24 hours after AKI.
Top:Metabolites that were decreased in more than one site 24 hours after AKI are presented in the top section. One metabolite, tyrosine, was decreased in all three sites. 6 metabolites were decreased in both the plasma and the heart. Bottom: All of the remaining metabolites that were decreased in the kidney, plasma or heart 24 hours after AKI are included in the bottom section, and grouped by metabolite type/pathway. In total, 24 hours after AKI, 37 metabolites were decreased in the kidney, 34 were decreased in the plasma, and 20 were decreased in the heart.
| Increased metabolites in the kidney, plasma, and heart at 4 hours | |||
|---|---|---|---|
| Kidney | Plasma | Heart | Metabolite type or pathway |
| Tyrosine | Tyrosine | Tyrosine | Amino acid |
| Alanine | Alanine | Amino acid | |
| Lysine | Lysine | Amino acid | |
| D-O-Phosphoserine | D-O-Phosphoserine | Amino acid metabolite | |
| Glutathione | Glutathione | Antioxidant | |
| Pyridoxamine | Pyridoxamine | Vitamin B6 metabolism | |
| 2-Oxo-7-Methylthioheptanoic acid | 2-Oxo-7-Methylthioheptanoic acid | Carboxylate metabolism | |
| Glutamate | Glutamate | Amino acid | |
| Glycine | Glycine | Amino acid | |
| Adenine | Adenine | Purine nucleotide | |
| Adenosine | Adenosine | Purine nucleotide | |
| Cysteine | Cysteine | Amino acid | |
| Methionine | Methionine | Amino acid | |
| Valine | Valine | Amino acid | |
| L-Carnitine | L-Carnitine | Carnitine and fatty acid metabolism | |
| cis-p-Coumarate | Cis-P-Coumarate | Other | |
| Kidney | Plasma | Heart | Metabolite type or pathway |
| Cystine | Arginine | Aspartate | Amino acid |
| Proline | Histidine | Amino acid | |
| Phenylalanine | Peptide Tryptophan | Amino acid | |
| Threonine | Amino acid | ||
| Trans-4-Hydroxy-L-Proline | Amino acid metabolite | ||
| Indolepyruvate | Tryptophan metabolism | ||
| N6-Methyl-L-Lysine | Lysine metabolism | ||
| Guanidinoacetate | Arginine and proline metabolism | ||
| L-Citrulline | Arginine metabolism, urea cycle | ||
| L-Homocysteine | Serine metabolism | ||
| S-Adenosyl-L-homocysteine | Serine metabolism | ||
| 5-Oxoproline | Gamma-L-Glutamyl-D-Alanine | Glutathione metabolism | |
| 5-L-Glutamyl-taurine | Glutathione Disulfide | Glutathione metabolism | |
| gamma-Glutamyl-gamma- aminobutyrate |
S-Glutathionyl-L-Cysteine | Glutathione metabolism | |
| gamma-L-Glutamyl-L-cysteine | Glutathione metabolism | ||
| Thioredoxin disulfide | Antioxidant | ||
| AMP | Purine | Nucleotide/nucleotide metabolism | |
| GMP | Cytidine | Nucleotide/nucleotide metabolism | |
| Hypoxanthine | Guanine | Nucleotide/nucleotide metabolism | |
| Inosine | Nucleotide/nucleotide metabolism | ||
| alpha-D-Ribose 1-phosphate | Pentose Phosphate Pathway | ||
| Sedoheptulose 1-phosphate | Pentose Phosphate Pathway | ||
| NAD | Vitamin B3 metabolism, NAD/NADH reactions | ||
| Nicotinamide (NAM) | Vitamin B3, NAD/NADH reactions | ||
| 2-Methyleneglutarate | Vitamin B3 metabolism | ||
| Lactate | D-Glucose | Glycolysis | |
| Pyruvate | Lactate | Glycolysis | |
| Succinate | TCA cycle | ||
| Ethanolamine phosphate | Glycerophospholipid biosynthesis | ||
| Glycerol 3-phosphate | Glycerophospholipid biosynthesis | ||
| O-Propanoylcarnitine | Carnitine and fatty acid metabolism | ||
| 2-Hydroxyglutarate/Citramalate | Butanoate Metabolism | ||
| Ornithine | Urea cycle | ||
| 1-Hydroxy-2- aminoethylphosphonate |
3D-3–5/4-Trihydroxycyclohexane- 1–2-Dione |
Other | |
| 4-Aminobenzoate | L-Adrenaline | Serotonin | Other |
| Poly-gamma-D-glutamate | N-Acyl-D-Mannosaminolactone | 3-Phospho-D-Erythronate | Other |
| Ectoine | Sodium Glucuronate | Other | |
| Anthranilate | Other | ||
| Hypotaurine | Other | ||
| Phosphate | Other | ||
| 37 total | 34 total | 20 total | |
Few metabolites changed similarly among the kidney, plasma, and heart with only 5 metabolites similarly affected in all three sites. With regard to the plasma and heart, 16 metabolites were similarly affected and represent a variety of metabolites/pathways (e.g., amino acid deficiency, oxidative stress/glutathione deficiency). With regard to the kidney and plasma – as would be expected - several metabolites that were increased in the kidney were also increased in the plasma: 7 at 4 hours and 17 at 24 hours.
Although changes in individual metabolites were minimal, the overall changes in metabolites are informative with notably similar effects in both the kidney and heart, as evidenced by amino acid depletion, increased oxidative stress, and alternative energy production that were evident in the kidney at 4 hours, and then manifested in the plasma and heart at 24 hours. For example, in the plasma, only 3 metabolites were decreased at 4 hours, yet at 24 hours, 34 metabolites were decreased including the amino acids alanine, arginine, cysteine, lysine, methionine, phenylalanine, proline, threonine, tyrosine, and valine. With regard to oxidative stress, glutathione is decreased in the kidney at 4 hours, but plasma levels do not decrease until 24 hours. Both amino acid deficiency and deficiency of antioxidant capacity at 24 hours likely contribute to cardiac ATP depletion and increased cardiac oxidative stress.
Additionally, metabolites reflecting shifts in energy production were affected during AKI, with the most notable effects being related to nucleotide catabolism as evidenced by decreased levels of purines and pyrimidines and increased levels of their metabolites in the kidney and plasma. Increased nucleotide metabolism, which also occurred in the heart, is most likely the result of a shift to anaerobic metabolism, and most certainly due to the hypoxic environment within the kidney due to direct ischemia.
Discussion
In the present study, our data demonstrate that 41% of metabolites measured in the heart were affected at some time point after AKI, with the most dramatic effects occurring 24 hours after AKI. The number and acuity of the changes in metabolites after AKI are notable; by comparison, metabolic profiling after myocardial infarction revealed change in approximately 40% of metabolites in one study 21 and 50% of metabolites in another 22; in contrast, cardiac stress induced by pressure overload affected only 1.3% of metabolites 21. Remarkably, the metabolites affected after in the heart after AKI are akin to the changes induced after direct cardiac injury from myocardial ischemia reperfusion as evidenced by amino acid depletion, glutathione depletion, increased oxidative stress, and evidence of anaerobic energy production; these metabolic effects also occurred within the kidney and were similarly reflected in the plasma. Thus, AKI – within the kidney and systemically - is characterized by marked energy substrate depletion, increased oxidative stress, and changes in energy metabolism. Whether depletion of amino acids and other energy substrates are due to increased consumption, decreased production, or both, is not resolved by our study, however, it is plausible that this energy substrate deficient state contributes to reduced ATP generation in the heart after AKI. Indeed, re-introduction of the amino acids glutamate and aspartate (markedly decreased in the heart after AKI) improves ATP production during direct cardiac ischemia, and supplementation of cardioplegic solutions for bypass with aspartate and glutamate has been standard practice for decades.26,45 Thus, future studies to test the potential benefit of amino acid supplementation during AKI-induced cardiac injury are warranted.
Increased oxidative stress after AKI is particularly evident by the marked reduction of kidney, plasma, and cardiac glutathione at 24 hours. Glutathione is essential for normal cardiac function,29,30 and glutathione deficiency is an early trigger of apoptotic cell death 46 which has been observed in rodent models of AKI-induced cardiac injury.18 Depletion of cardiac glutathione occurs in animal models of myocardial infarction and heart failure and also associated with longer term outcomes as cardiac decreased glutathione levels correlates with decreased cardiac function and heart failure progression in humans.30 Glutamate supplementation is thought to beneficial during hypoxia and bypass surgery by increasing levels of glutathione 25, and could be similarly beneficial during AKI.
In addition to the marked deficiencies in metabolites, AKI was also characterized by the accumulation of numerous metabolites with a significant increase in 42 of 144 measured metabolites at 24 hours. It is possible that one or more of these metabolites may account for the changes in energy metabolism, ATP depletion, and cardiac dysfunction observed. Of particular relevance, 2-oxoglutarate (also known as alpha ketoglutarate), which was increased in the kidney, plasma, and heart 24 hours post-AKI, was recently identified as having an important role in cardiac energy metabolism. Specifically, plasma accumulation of alpha-ketoglutarate affected hepatic tryptophan metabolism to produce kynurenic acid which activates hypoxia inducible factor (HIF) in the heart.47 Activation of HIF shifts cells away from glycolytic metabolism towards reliance on amino acid metabolism via regulation of pyruvate dehydrogenase kinase. In our data, the significant increase in alpha ketoglutarate is was accompanied by evidence of increased amino acid metabolism in the heart, consistent with a HIF-1 effect. During AKI, this shift in metabolism could be maladaptive given the marked reduction in circulating amino acids and thus lack of sufficient amino acid substrate. Thus, it is possible that the cardiac effects of AKI result from synergist effects of both metabolite accumulation and depletion.
Our data in the present study may have considerable implications regarding the potential benefit, or harm, of renal replacement therapy (RRT) during AKI. RRT results in the indiscriminate removal of small and medium sized metabolites and proteins. While it has long been evident that removal of the accumulation of certain metabolites during AKI and end stage renal disease (ESRD) is beneficial, much less attention has been paid to the potential harms of RRT and that numerous metabolites and proteins essential for optimal organ function may be removed during the process. Enthusiasm for the potential benefits of RRT during AKI is evident by the number of past and current clinical trials devoted to the study of increased dose and early initiation.48 Our data demonstrate that a dramatic number of measured metabolites (42) are increased in the plasma 24 hours after AKI, and it is possible that one or many of these metabolites may adversely affect distant organ function thus supporting the argument that early RRT may be of clinical benefit. Remarkably, however, a large number of metabolites (34) were significantly reduced in the plasma 24 hours after AKI. One wonders whether the additional removal of these, and other substrates essential for normal cardiac function and energy production such as glutamate, aspartate and glycine might result in adverse clinical outcomes.
Since supplementation of these amino acids is beneficial during direct cardiac ischemia, it is plausible to conclude that the removal would be harmful. Another potential beneficial metabolite that would be expected to be removed by RRT includes the major antioxidant glutathione, which was reduced in the plasma, kidney and heart at 24 hours of AKI; given the increase in oxidative stress noted in the kidney and heart after AKI, further and continued removal of glutathione by RRT might be expected to be harmful. Removal of potentially beneficial metabolites may be particularly important to consider when AKI is accompanied by myocardial infarction or congestive heart failure in which an already compromised heart may be especially susceptible to removal of amino acids and other energy substrates. The potential competing benefits and harms of RRT is a plausible explanation for the lack of clinical benefit seen in studies of higher dose of dialysis during AKI, as well as overall lack of improvement in mortality in patients with RRT requiring dialysis over the past several decades.
Limitations.
Metabolite levels reported reflect steady state levels that are the cumulative effect of numerous interconnected pathways. Definitive assessment of substrate sources for key metabolites and implications for metabolic pathways disrupted require additional focused experimentation. Accurate metabolite identity involves the use of appropriate standards, and may be subject to error. Raw datasets are available for review upon request.
Summary and conclusions.
In the present study, we demonstrate that AKI is associated with dramatic changes in cardiac metabolism, cardiac ATP depletion, and diastolic dysfunction. While the systemic complications of AKI are traditionally considered to be due to the accumulation of metabolites and other circulating mediators, our data demonstrate that numerous essential metabolites were depleted after AKI which likely contribute to the deleterious effects of AKI on the heart. We suggest that methods to improve energy metabolism in the heart after AKI may have substantial potential to improve outcomes. Furthermore, our data highlight the complexity of the systemic consequences of AKI and suggest that more precise tools of therapy beyond RRT will be necessary to optimize patient outcomes.
Materials and Methods
Complete descriptions of methods are available in “Supplemental Methods“
Animals
Adult (8–10-week-old), male C57BL/6 mice (Jackson Laboratories, Bar Harbor, ME) weighing between 20–25 g were used. Mice were maintained on a standard diet, and water was freely available.
Surgical protocol
Two surgical procedures were performed: (1) sham operation (i.e., laparotomy) and (2) ischemic AKI as previously described. 3,49
Experimental groups and accounting for mice included in experiments and analysis.
For metabolomics analysis, we began with 10 mice per group for each of the 7 experimental groups: 1) normal (no surgical procedure), 2) 4 hour sham, 3) 4 hour AKI, 4) 24 hour sham, 5) 24 hour AKI, 6) 7 day sham, and 7) 7 day AKI for a total of 70 mice. However, 1 mouse in the 7 day sham group died, and 4 mice in the 7 day AKI group died. Thus, the numbers of animals included in the final data analysis are as follows: 1) normal: n=10, 2) 4 hour sham: n=10, 3) 4 hour AKI: n=10, 4) 24 hour sham: n=10, 5) 24 hour AKI: n=10, 6) 7 day sham: n=9, and 7) 7 day AKI: n=6.
Metabolomics analyses
Frozen heart and kidney samples were milled with a mortar and pestle in the presence of liquid nitrogen, then weighed to the nearest 0.1 mg and extracted in ice-cold lysis/extraction buffer at a concentration of 10 mg/mL. Samples were then agitated at 4°C for 30 min and then centrifuged at 10,000 g for 15 min at 4°C. Protein and lipid pellets were discarded, while supernatants were stored at −80°C until metabolomics analyses via ultra high pressure liquid chromatography coupled to online mass spectrometry (UHPLC-MS) as previously reported 50. Plasma samples were snap frozen and stored at −80 until UHPLC-MS analysis. Untargeted UHPLC-MS-based metabolomics analysis provided the measurement of annotated metabolites (124 for the heart, 177 for the kidney, and 128 for the plasma). No data points were excluded in the analysis.
Echocardiography, ATP assay, mean are blood pressure, and potassium and arterial blood pH measurements are described in supplemental methods.
Statistical analysis
To normalize the metabolite data for statistical analysis, the raw peak areas were autoscaled using MetaboAnalyst 3.0 (available at http://www.metaboanalyst.ca) 51 in order to achieve a standard deviation of 1 for each metabolite, thus allowing for homoscedastic statistical tests 52,51. Univariate ANOVA (significant threshold p < 0.05) was performed on autoscaled data in Metaboanalyst 3.0 followed by post-hoc analysis with Bonferonni-Sidak’s multiple comparison test (significance threshold for p < 0.05). Hierarchical clustering analysis (HCA), principal component analysis (PCA), partial least squares- discriminant analysis (PLS-DA), and pathway enrichment and ranking analysis were performed on significant metabolites after univariate ANOVA. HCA was performed using Morpheus (available at: https://software.broadinstitute.org/morpheus/); PCA and PLS-DA were performed using XLSTAT (available at https://www.xlstat.com/en/); pathway analysis was performed using MetaboAnalyst 3.0. For all analyses, rigorous statistical profiling methods and thresholds were utilized in order to minimize false discovery. For PCA biplots, the metabolites with a minimum sum of squared cosines of 0.5 were considered significant. For pathway analysis, pathway significance was based on the total number of metabolites that map to a pathway and their respective significances; a pathway was considered significant if the number of significant metabolites (i.e. “hits”) was ≥ 2 and the Holm adjusted P value was less than 0.05.
Supplementary Material
Acknowledgements
This work was supported by 1R01 HL095363 and VA Merit 1 I01 BX001498 to SF. RAB was awarded a postdoctoral fellowship from the Canadian Institutes of Health Research (FRN- 216927). TAM was supported by the National Institutes of Health (HL116848, HL127240 and AG043822) and the American Heart Association (16SFRN31400013).
Sources of support: This work was supported by 1R01 HL095363 and VA Merit 1 I01 BX001498 to SF. TAM was supported by the National Institutes of Health (HL116848, HL127240 and AG043822) and the American Heart Association (16SFRN31400013). RAB received funding from the Canadian Institutes of Health Research (FRN-216927).
We thank Maria A Cavasin PhD from the Consortium for Fibrosis Research & Translation (University of Colorado University of Colorado Anschutz Medical Campus, Aurora, Colorado) for assistance with blood pressure measurements.
Footnotes
financial disclosures
The authors report no relevant financial conflicts
Publisher's Disclaimer: This is a PDF file of an unedited manuscript that has been accepted for publication. As a service to our customers we are providing this early version of the manuscript. The manuscript will undergo copyediting, typesetting, and review of the resulting proof before it is published in its final citable form. Please note that during the production process errors may be discovered which could affect the content, and all legal disclaimers that apply to the journal pertain.
References
- 1.Thakar CV, Christianson A, Freyberg R, Almenoff P, Render ML. Incidence and outcomes of acute kidney injury in intensive care units: a Veterans Administration study. Critical care medicine. 2009;37(9):2552–2558. [DOI] [PubMed] [Google Scholar]
- 2.Waikar SS, Liu KD, Chertow GM. Diagnosis, epidemiology and outcomes of acute kidney injury. Clinical journal of the American Society of Nephrology: CJASN. 2008;3(3):844–861. [DOI] [PubMed] [Google Scholar]
- 3.Hoke TS, Douglas IS, Klein CL, et al. Acute renal failure after bilateral nephrectomy is associated with cytokine-mediated pulmonary injury. J Am Soc Nephrol. 2007;18(1):155–164. [DOI] [PubMed] [Google Scholar]
- 4.Grams ME, Rabb H. The distant organ effects of acute kidney injury. Kidney international. 2012;81(10):942–948. [DOI] [PubMed] [Google Scholar]
- 5.Ologunde R, Zhao H, Lu K, Ma D. Organ cross talk and remote organ damage following acute kidney injury. International urology and nephrology. 2014;46(12):2337–2345. [DOI] [PubMed] [Google Scholar]
- 6.Ronco C, Haapio M, House AA, Anavekar N, Bellomo R. Cardiorenal syndrome. J Am Coll Cardiol. 2008;52(19):1527–1539. [DOI] [PubMed] [Google Scholar]
- 7.Cruz DN, Gheorghiade M, Palazzuoli A, Ronco C, Bagshaw SM. Epidemiology and outcome of the cardio-renal syndrome. Heart Fail Rev. 2011;16(6):531–542. [DOI] [PubMed] [Google Scholar]
- 8.Ronco C, House AA, Haapio M. Cardiorenal and renocardiac syndromes: the need for a comprehensive classification and consensus. Nat Clin Pract Nephrol. 2008;4(6):310–311. [DOI] [PubMed] [Google Scholar]
- 9.Gammelager H, Christiansen CF, Johansen MB, Tonnesen E, Jespersen B, Sorensen HT. Three- year risk of cardiovascular disease among intensive care patients with acute kidney injury: a population-based cohort study. Crit Care. 2014;18(5):492. [DOI] [PMC free article] [PubMed] [Google Scholar]
- 10.Jose P, Skali H, Anavekar N, et al. Increase in creatinine and cardiovascular risk in patients with systolic dysfunction after myocardial infarction. J Am Soc Nephrol. 2006;17(10):2886–2891. [DOI] [PubMed] [Google Scholar]
- 11.Chawla LS, Amdur RL, Shaw AD, Faselis C, Palant CE, Kimmel PL. Association between AKI and Long-Term Renal and Cardiovascular Outcomes in United States Veterans. Clin J Am Soc Nephrol. 2013. [DOI] [PMC free article] [PubMed] [Google Scholar]
- 12.Lassnigg A, Schmidlin D, Mouhieddine M, et al. Minimal changes of serum creatinine predict prognosis in patients after cardiothoracic surgery: a prospective cohort study. J Am Soc Nephrol. 2004;15(6):1597–1605. [DOI] [PubMed] [Google Scholar]
- 13.Rosner MH, Okusa MD. Acute kidney injury associated with cardiac surgery. Clin J Am Soc Nephrol. 2006;1(1):19–32. [DOI] [PubMed] [Google Scholar]
- 14.Crawford TC, Magruder JT, Grimm JC, et al. Renal Failure After Cardiac Operations: Not All Acute Kidney Injury Is the Same. Ann ThoracSurg. 2017;104(3):760–766. [DOI] [PubMed] [Google Scholar]
- 15.McCullough PA, Wolyn R, Rocher LL, Levin RN, O’Neill WW. Acute renal failure after coronary intervention: incidence, risk factors, and relationship to mortality. Am J Med. 1997;103(5):368–375. [DOI] [PubMed] [Google Scholar]
- 16.Rihal CS, Textor SC, Grill DE, et al. Incidence and prognostic importance of acute renal failure after percutaneous coronary intervention. Circulation. 2002;105(19):2259–2264. [DOI] [PubMed] [Google Scholar]
- 17.Kelly KJ. Distant effects of experimental renal ischemia/reperfusion injury. J Am Soc Nephrol. 2003;14(6):1549–1558. [DOI] [PubMed] [Google Scholar]
- 18.Sumida M, Doi K, Ogasawara E, et al. Regulation of Mitochondrial Dynamics by Dynamin-Related Protein-1 in Acute Cardiorenal Syndrome. J Am Soc Nephrol. 2015;26(10):2378–2387. [DOI] [PMC free article] [PubMed] [Google Scholar]
- 19.Kelly KJ. Acute renal failure: much more than a kidney disease. Semin Nephrol. 2006;26(2):105–113. [DOI] [PubMed] [Google Scholar]
- 20.Doenst T, Nguyen TD, Abel ED. Cardiac metabolism in heart failure: implications beyond ATP production. Circ Res. 2013;113(6):709–724. [DOI] [PMC free article] [PubMed] [Google Scholar]
- 21.Sansbury BE, DeMartino AM, Xie Z, et al. Metabolomic analysis of pressure-overloaded and infarcted mouse hearts. Circ Heart Fail. 2014;7(4):634–642. [DOI] [PMC free article] [PubMed] [Google Scholar]
- 22.Wang X, Wang D, Wu J, et al. Metabolic Characterization of Myocardial Infarction Using GC-MS- Based Tissue Metabolomics. Int Heart J. 2017;58(3):441–446. [DOI] [PubMed] [Google Scholar]
- 23.Girones N, Carbajosa S, Guerrero NA, Poveda C, Chillon-Marinas C, Fresno M. Global metabolomic profiling of acute myocarditis caused by Trypanosoma cruzi infection. PLoS Negl Trop Dis. 2014;8(11):e3337. [DOI] [PMC free article] [PubMed] [Google Scholar]
- 24.Suleiman MS, Dihmis WC, Caputo M, Angelini GD, Bryan AJ. Changes in myocardial concentration of glutamate and aspartate during coronary artery surgery. Am J Physiol. 1997;272(3 Pt 2):H1063–1069. [DOI] [PubMed] [Google Scholar]
- 25.Drake KJ, Sidorov VY, McGuinness OP, Wasserman DH, Wikswo JP. Amino acids as metabolic substrates during cardiac ischemia. Exp Biol Med (Maywood). 2012;237(12):1369–1378. [DOI] [PMC free article] [PubMed] [Google Scholar]
- 26.Venturini A, Ascione R, Lin H, Polesel E, Angelini GD, Suleiman MS. The importance of myocardial amino acids during ischemia and reperfusion in dilated left ventricle of patients with degenerative mitral valve disease. Mol Cell Biochem. 2009;330(1–2):63–70. [DOI] [PMC free article] [PubMed] [Google Scholar]
- 27.Chouchani ET, Pell VR, Gaude E, et al. Ischaemic accumulation of succinate controls reperfusion injury through mitochondrial ROS. Nature. 2014;515(7527):431–435. [DOI] [PMC free article] [PubMed] [Google Scholar]
- 28.Maekawa K, Hirayama A, Iwata Y, et al. Global metabolomic analysis of heart tissue in a hamster model for dilated cardiomyopathy. J Mol Cell Cardiol. 2013;59:76–85. [DOI] [PubMed] [Google Scholar]
- 29.Adamy C, Mulder P, Khouzami L, et al. Neutral sphingomyelinase inhibition participates to the benefits of N-acetylcysteine treatment in post-myocardial infarction failing heart rats. J Mol Cell Cardiol. 2007;43(3):344–353. [DOI] [PubMed] [Google Scholar]
- 30.Damy T, Kirsch M, Khouzami L, et al. Glutathione deficiency in cardiac patients is related to the functional status and structural cardiac abnormalities. PLoS One. 2009;4(3):e4871. [DOI] [PMC free article] [PubMed] [Google Scholar]
- 31.Sell DR, Strauch CM, Shen W, Monnier VM. 2-aminoadipic acid is a marker of protein carbonyl oxidation in the aging human skin: effects of diabetes, renal failure and sepsis. Biochem J. 2007;404(2):269–277. [DOI] [PMC free article] [PubMed] [Google Scholar]
- 32.Dalle-Donne I, Giustarini D, Colombo R, Rossi R, Milzani A. Protein carbonylation in human diseases. Trends Mol Med. 2003;9(4):169–176. [DOI] [PubMed] [Google Scholar]
- 33.Kim K, Park J, Rhee S. Structural and functional basis for (S)-allantoin formation in the ureide pathway. J Biol Chem. 2007;282(32):23457–23464. [DOI] [PubMed] [Google Scholar]
- 34.Tolun AA, Zhang H, Il’yasova D, Sztaray J, Young SP, Millington DS. Allantoin in human urine quantified by ultra-performance liquid chromatography-tandem mass spectrometry. Anal Biochem. 2010;402(2):191–193. [DOI] [PMC free article] [PubMed] [Google Scholar]
- 35.Halliwell B, Whiteman M. Measuring reactive species and oxidative damage in vivo and in cell culture: how should you do it and what do the results mean? Br J Pharmacol. 2004;142(2):231–255. [DOI] [PMC free article] [PubMed] [Google Scholar]
- 36.Grootveld M, Halliwell B. Measurement of allantoin and uric acid in human body fluids. A potential index of free-radical reactions in vivo? Biochem J. 1987;243(3):803–808. [DOI] [PMC free article] [PubMed] [Google Scholar]
- 37.Kaur H, Halliwell B. Action of biologically-relevant oxidizing species upon uric acid. Identification of uric acid oxidation products. Chem Biol Interact. 1990;73(2–3):235–247. [DOI] [PubMed] [Google Scholar]
- 38.Sambandam N, Lopaschuk GD, Brownsey RW, Allard MF. Energy metabolism in the hypertrophied heart. Heart Fail Rev. 2002;7(2):161–173. [DOI] [PubMed] [Google Scholar]
- 39.Shao D, Tian R. Glucose Transporters in Cardiac Metabolism and Hypertrophy. Compr Physiol. 2015;6(1):331–351. [DOI] [PMC free article] [PubMed] [Google Scholar]
- 40.Ingwall JS, Weiss RG. Is the failing heart energy starved? On using chemical energy to support cardiac function. Circ Res. 2004;95(2):135–145. [DOI] [PubMed] [Google Scholar]
- 41.Hisatome I, Ishiko R, Miyakoda H, et al. Excess purine degradation caused by an imbalance in the supply of adenosine triphosphate in patients with congestive heart failure. Br Heart J. 1990;64(6):359–361. [DOI] [PMC free article] [PubMed] [Google Scholar]
- 42.Hearse DJ, Garlick PB, Humphrey SM. Ischemic contracture of the myocardium: mechanisms and prevention. Am J Cardiol. 1977;39(7):986–993. [DOI] [PubMed] [Google Scholar]
- 43.Kim JS, Yang JW, Yoo JS, Choi SO, Han BG. Association between E/e ratio and fluid overload in patients with predialysis chronic kidney disease. PLoS One. 2017;12(9):e0184764. [DOI] [PMC free article] [PubMed] [Google Scholar]
- 44.Orchard CH, Kentish JC. Effects of changes of pH on the contractile function of cardiac muscle. Am J Physiol. 1990;258(6 Pt 1):C967–981. [DOI] [PubMed] [Google Scholar]
- 45.Williams H, King N, Griffiths EJ, Suleiman MS. Glutamate-loading stimulates metabolic flux and improves cell recovery following chemical hypoxia in isolated cardiomyocytes. J Mol Cell Cardiol. 2001;33(12):2109–2119. [DOI] [PubMed] [Google Scholar]
- 46.Franco R, Cidlowski JA. Apoptosis and glutathione: beyond an antioxidant. Cell Death Differ. 2009;16(10):1303–1314. [DOI] [PubMed] [Google Scholar]
- 47.Olenchock BA, Moslehi J, Baik AH, et al. EGLN1 Inhibition and Rerouting of alpha-Ketoglutarate Suffice for Remote Ischemic Protection. Cell. 2016;164(5):884–895. [DOI] [PMC free article] [PubMed] [Google Scholar]
- 48.Faubel S, Chawla LS, Chertow GM, et al. Ongoing clinical trials in AKI. Clin J Am Soc Nephrol. 2012;7(5):861–873. [DOI] [PubMed] [Google Scholar]
- 49.Klein CL, Hoke TS, Fang WF, Altmann CJ, Douglas IS, Faubel S. Interleukin-6 mediates lung injury following ischemic acute kidney injury or bilateral nephrectomy. Kidney Int. 2008. [DOI] [PubMed] [Google Scholar]
- 50.D’Alessandro A, Moore HB, Moore EE, et al. Early hemorrhage triggers metabolic responses that build up during prolonged shock. American journal of physiology Regulatory, integrative and comparative physiology. 2015;308(12):R1034–1044. [DOI] [PMC free article] [PubMed] [Google Scholar]
- 51.Xia J, Wishart DS. Using MetaboAnalyst 3.0 for Comprehensive Metabolomics Data Analysis. Current Protocols in Bioinformatics: John Wiley & Sons, Inc.; 2002. [DOI] [PubMed] [Google Scholar]
- 52.van den Berg RA, Hoefsloot HC, Westerhuis JA, Smilde AK, van der Werf MJ. Centering, scaling, and transformations: improving the biological information content of metabolomics data. BMC Genomics. 2006;7:142. [DOI] [PMC free article] [PubMed] [Google Scholar]
Associated Data
This section collects any data citations, data availability statements, or supplementary materials included in this article.