Abstract
Fullerene-based compounds are being developed for an extensive range of biomedical applications, and may provide a completely new class of biologically useful reagents. In support of our continuing investigation and characterization of one such compound, e,e,e-fullerene(60)-63-tris malonic acid (1) we optimized the conditions for obtaining mass spectra. Both positive and negative ion mass spectra are obtained using electrospray ionization (ESI). However, the spectra are dramatically different in the different ionization modes. We studied the effect of solvent media, acid content as well as the concentration of the compound (1) on mass fragmentation pattern both in positive and negative mode. The best mass spectra were obtained when 1 was sprayed from a solution containing a weak organic acid added to aqueous methanol (1:1) in positive mode. We also analyzed the ion current as function of capillary voltage for selected ion. Fragment ions formed by the direct loss of carboxyl groups from the doubly-charged dimer occur for the loss of one, two and six carboxyl groups. Of these, the loss of one carboxyl is the most abundant. The dominant mechanism for the formation of singly-charged fragment ions arises from splitting of the doubly-charged dimers into singly-charged monomers with subsequent carboxyl losses.
Keywords: Fullerene, ESI, positive ion, negative ion, doubly charged, dimer
Introduction
Mass spectrometry (MS) with a variety of ionization techniques including field desorption (FD), fast atom bombardment (FAB), and laser desorption (LD) was employed as an analytical tool in the first synthesis [1] of carboxyfullerenes having two or more carboxyl groups. However, none of these analytical techniques yielded a molecular ion and therefore failed to verify the molar mass of the compound. By contrast, molecular ions were observed in the FAB [2] and Maldi-FTMS [3] of fullerene mono carboxylic acids. Electrospray ionization (ESI), the softest ionization technique, was applied to crown ether derivatives of fullerenes doped with potassium ions in positive ion mode [4] and to anionic adducts of fullerenes in negative ion mode [5]. These were the only effective ESI methods of obtaining ions of fullerene derivatives at the time, but were not generally applicable for analytical purposes due to the complexity of the spectra.
Subsequently several groups took advantage of the electrochemical properties of the ESI source and the fullerene molecule. Dupont [6], Barrow [7] and Mou [8], observed radical anion and radical cation while spraying in non-polar solvents. Zhang et al [9] reported an ESI- Fourier transform ion cyclotron resonance (FTICR) MS study of 1,6-methano(60) fullerene - 61,61-dicarboxylic acid. They observed the deprotonated molecular anion [M - H]− and the related decarboxylated anion [M - CO2 - H]−; but were unsuccessful in obtaining mass spectra in the positive ion mode. Time-of-Flight (ToF) ESI negative ion spectra of halogenated aliphatic carboxylic acids, employing solutions adjusted to pH10 with ammonium hydroxide, produced ions corresponding to [M- H]− and proton bound dimers [2M - H]− [10]
Our objective was to obtain qualitative and quantitative information about e,e,e-fullerene(60)-63-tris malonic acid (1).
The synthesis of the compound has been reported in our recent publication[11]. In the discussion of the ionization and fragmentation of this molecule, which tends to form dimer ions, we use the following designations to differentiate the isotopic species. Ions containing only 12C atoms will be denoted by M. Ions containing one 13C atom will be denoted by M† and those containing two 13C atoms by M††. The most intense ion in the isotopic cluster was used for plotting data. For dimers, which contain 138 carbon atoms, the heterodimer MM† is the most intense peak.
We report results in positive and negative ESI-MS of 1 using[12] a ToF instrument. There are three potential modes of ion formation for this compound: 1) positive ion formation by protonation; 2) negative ion formation by proton loss; 3) formation of radical ionic species, either positive or negative, by electrochemical processes in the ion source [6], [7], [8]. We begin with positive ion electrospray because the results are straightforward.
Analytical Methods
Experiments were performed on two different instruments in the Washington University Mass Spectrometry Research Resource. Two sectors of a VG (now Waters) ZAB-T four sector mass spectrometer equipped with an electrospray ion source and a Waters Q-ToF II hybrid tandem instrument were used for these studies. For both instruments, the spray needle temperatures were held at 150 °C.
Samples were analyzed on an Agilent LC/MSD equipped with ESI, APCI, and APPI spray chambers. Samples were run on a Zorbax 2.1 × 50mm 3.5um SB C18 column in a gradient from 60% (0.1%TFA/ACN) / 40% (0.1%TFA in water) to 100% (0.1%TFA/ACN) over 25 minutes at 0.3mls/minute. A makeup flow of 0.05 mL/min of 1% NH4OH in 50:50 water:iso-propyl alcohol was added post column between the DAD and the MSD to facilitate ionization in ESI. The ESI conditions included positive ion mode: scan 100-1500 and negative ion mode: scan 200-1500 with the fragmentor set at 175V, gain = 4 for both. The nebulizer pressure of 40 psi was maintained using a dry gas flow of 10 L/min at 30 °C. The ESI had a Vcap of −3500V in positive mode and a Vcap of −3500V in negative mode.
Results and discussion:
Positive Ion Electrospray: Solvent Dependence
Preliminary experiments indicated that no ions were formed during positive ion electrospray of 1 in the HPLC solvent of choice, acetonitrile:water:trifluoroacetic acid (ACN:water:TFA) or in pure organic solvents. The best mass spectra were obtained when 1 was sprayed from a solution containing a weak organic acid added to aqueous methanol (1:1). Substitution of longer chain alcohols in the spray solvent resulted in decreased ion current. Substitution of acetonitrile for alcohol with a trace of weak organic acid gave the least desirable spray solvent. No ions were observed with solutions containing stronger acids, TFA or HCl.
It seems contradictory that one would have to add an acid to the spray solution for a compound that is an acid to produce a positive ion mass spectrum. Apparently, 1 cannot protonate itself. As will become obvious below, this molecule has a strong tendency to form negatively charged proton-bound dimers, which we believe accounts for its inability to self-protonate. Acetic acid is a weaker acid than 1, hence acetic acid should not be able to protonate the stronger acid (1). However, we suspect that acetic acid serves as a hydrogen bond donor, thereby neutralizing the proton bound dimer.
In 50/50 aqueous methanol containing 1% acetic acid, 95% of the ionization appears as the protonated molecule [M + H] + at m/z 1027. The isotopic pattern for the theoretical and measured [M + H] + ion is shown overlay in Figure 1. Very weak ions are observed for higher n-mers such as the protonated dimer [MM† + H] + at m/z 2054 and a doubly protonated trimer [3M + 2H] + + at m/z 1539. Note, there is no evidence for the formation of the doubly charged dimer, which would have a half-mass ion at m/z 1027.5, [MM† + 2H] + +, in the molecular ion region.
Figure 1.
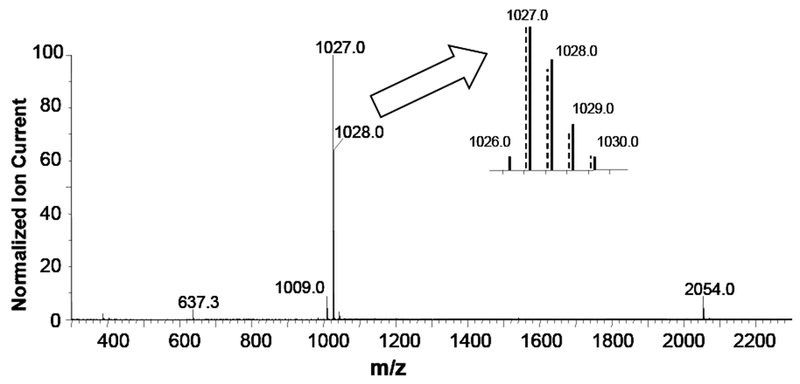
Positive ion electrospray spectrum of 1 at 80uMol/L. Collision Energy 10 Vdc; Capillary Voltage 4.0 kVdc. Inset compares the measured (solid) and theoretical (dashed) isotopic cluster at [M + H]+ for C69H6O12.
In addition to m/z 1027.0, a low intensity radical positive ion is observed at m/z 1026.0 which must arise from an electrochemical route [6], [7], [8]. One low abundance fragment at m/z 1009, [M - H2O + H] + , is also present. Significantly, neither the loss of carboxyl groups nor the formation of solvent adducts was observed. Thus, positive ion electrospray of 1 exhibits two modes of ionization, dominated primarily by protonation, and a weak tendency to form oligomers.
Concentration Dependence
ESI is regarded as a concentration dependent technique which makes it useful for obtaining quantitative data[13, 14]. We therefore investigated the ion current of 1 as a function of analyte concentration over one order of magnitude in aqueous methanol containing 1% acetic acid solution. The solution was continuously infused at 10 μL/min. As seen in Figure 2, the signal level increases nearly linearly with analyte concentration from 20 to 80 μMol/L; confirming a linear concentration dependence. However, the ratio of protons from the analyte to those from the acetic acid varies under these conditions.
Figure 2.
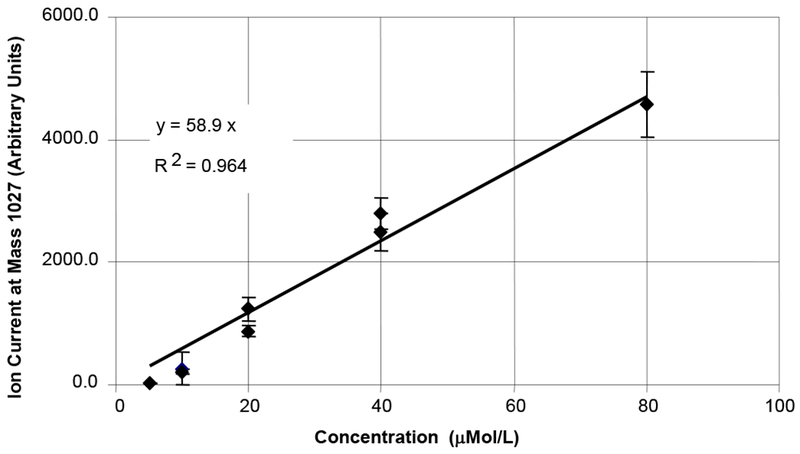
Concentration dependence of 1a sprayed in 1:1 aqueous methanol with 1% acetic acid. M+H ion plotted. Collision Energy: 10 Vdc; Capillary Voltage: varied from 3 to 4 kVdc.
Therefore, we performed a series of experiments in which the analyte concentration was held constant at 20 μMol/L while the acetic acid content was varied from 0.5 to 5% (v). The data (Figure 3) exhibit non-linear behavior consisting of three regions, strong acid dependence up to 1 % acetic acid, a plateau from 1 to 2 % acetic and a weaker acid dependence above 2% acetic acid.
Figure 3.
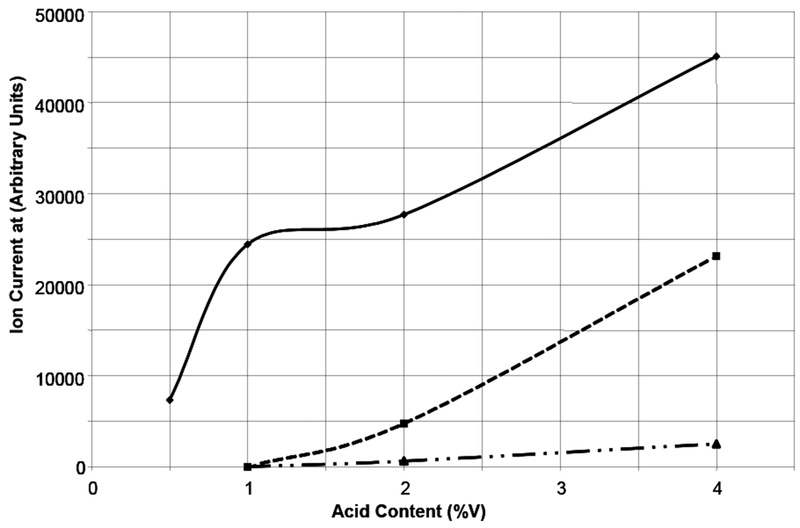
Ion current of selected ions in the positive ion electrospray of 1 at 20μmol/L concentration as a function of acid content in 1:1 methanol/water (v) spray solvent at 10μL/min. Solid line: [M + H]+ ion at 1027 Da. Dashed line: [M+M† + H]+ ion at 2054 Da. Dotted-dash line: [M+2M† + H] + + ion at 1541 Da. Collision Energy: 10 Vdc; Capillary Voltage: 3.5 kVdc.
The shape of the curve for the singly-charged monomer can be explained in the following manner: As noted above, in the absence of acid, no ions were observed in positive ion mode. If we assume that anions are formed under positive ion electrospray conditions, then the addition of a weak acid would provide a source of protons to suppress anion formation in proportion to the protons available. We calculated the acetic acid concentration to be less than the carboxyl concentration of 1 up to 1% and greater than that of 1 above 2%. Two phenomena contribute to the plateau region between 1 and 2% acetic acid content: 1) The titration of 1 by the added acid is reaching completion; and 2) dimer ion formation is beginning as evidenced by the dashed line in Figure 3 tracking the singly-charged dimer ion at m/z 2054. The change in the rate of increase of the ion current of the singly-charged monomer with increased acid content is slower above 2 % acetic acid content because of the competing formation of dimer ions. At the highest acetic acid concentrations, we observe the onset of formation of doubly-charged trimers of 1; dotted-dash line.
Positive Ion Electrospray: Collision Energy Dependence
Under optimum conditions for a quantitative method, the spectrum would consist of a single intense ion that varies with concentration. Collision energy is an instrument variable that influences fragmentation and thus needs to be explored to obtain the optimum conditions for quantitation. We varied this parameter over the range from 5 to 50 Vdc to obtain the results shown in Figure 4 where the ion current of select ions is plotted as a function of collision energy.
Figure 4.
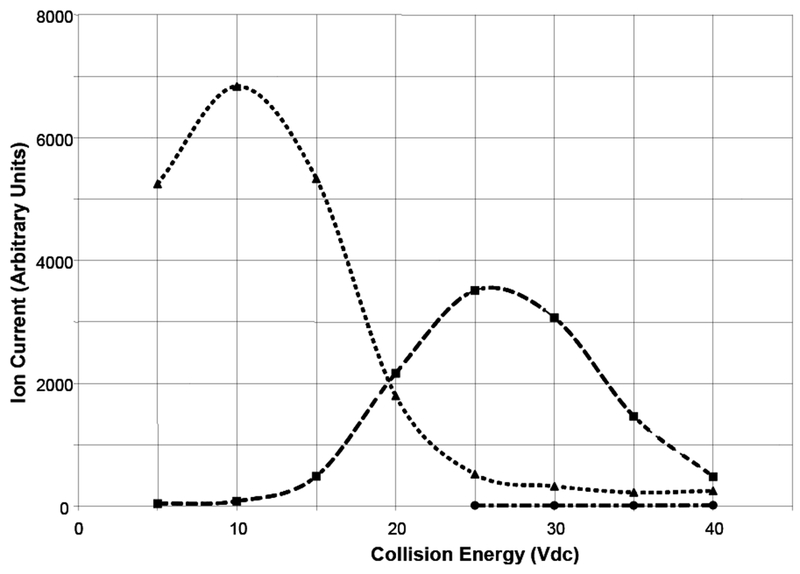
Ion current of selected ions in the positive ion electrospray spectrum of 1 at 20uMol/L in 50/50 v/v aqueous methanol solution with 1.0% acetic acid as a function of collision energy. [M + H]+ at m/z 1027 dotted line; [M - (H2O) + H]+ at m/z 1009 dashed line; [M -2(H2O) + H]+ at m/z 981 dotted-dashed line.
The ion current of the protonated molecular ion maximizes at a collision energy of 10 Vdc and quickly drops off as the collision energy increases. At higher collision energies only water losses are observed. The abundance of the fragment ion [M - H2O + H] + at m/z 1009 increases and peaks at about 25 Vdc. Further increases in the collision energy reduce the total ion current and produce an extremely weak ion at m/z 991 (loss of two H2O molecules). The analyte appears to be stabilized with respect to decarboxylation since no carboxyl losses from the molecular ion are observed in positive ion mode.
Negative Ion Electrospray: Effect of Spray Solvent
We began our search for an optimum electrospray solvent for the formation of negative ions of 1 with aqueous methanol without acid since it was the optimum solvent for positive ion electrospray. However, negative ion current was inversely proportional to the water content, resulting in no negative ions at 40% water by volume. Pure methanol was determined to be the best solvent for negative ionization studies providing excellent signal to noise ratio and the most stable signal.
Negative Ion Electrospray: Characteristics of the Mass Spectrum
The ions formed during negative ion electrospray are abundant and more complex than those observed from positive ion electrospray experiments. The spectra are strongly dependent upon instrumental conditions as well as the concentration of the analyte and nature of the spray solvent. A typical negative ion electrospray spectrum is shown below.
A striking feature of the negative ion spectrum is the presence of a variety of multiply-charged oligomers of 1. In addition, the most intense ion in the spectrum is m/z 1025.5, the mass of the doubly-charged dimer ion containing one 13C atom; i.e., [MM† - 2H] − − . This can be easily seen in the inset, where the theoretical isotopic distribution of the dimer ion is compared to the measured isotopic cluster. We can estimate the amount of the singly-charged monomer in the molecular ion region since we know that all of the ion current at m/z 1025.5 is due only to the doubly-charged dimer with one 13C atom, [MM† - 2H] − − . Consequently, we can compute the amount of the doubly-charged dimer [2M - 2H] 2−− contributing to the ion current at m/z 1025.0. Any residual ion current has to be due to the singly-charged monomer, [M − H] −. Thus, we observe that the singly-charged monomer accounts for less than 10% of the ionization of this compound. The only other singly-charged ions are the carboxyl losses at m/z 981 (loss of one carbon dioxide), m/z 937 (loss of two carbon dioxides) and the dimer ion at m/z 2052. All three of these are minor ions in the spectrum. The relative abundance of the m/z 1026.0 in the molecular ion cluster is consistent with that expected for the dimer ion containing two 13C atoms; i.e., either [2M† - 2H] 2−, or [MM††- 2H] 2− ; and leaves no excess to assign to the radical anion [M − ·].
Over the mass range shown in Figure 5, we observe in addition to the doubly-charged dimer, several other doubly-charged species, the monomer at m/z 512 and its associated sequential carboxyl losses at m/z 490, 468, and 446; and the trimer at m/z 1539. There are several ion clusters of triply-charged ions as well; the dimer at m/z 683.4, the tetramer at m/z 1367.7, and the pentamer at m/z 1710. Interestingly, there is no evidence for the triply-charged trimer as there are no peaks in the molecular ion cluster separated by one-third mass units.
Figure 5.
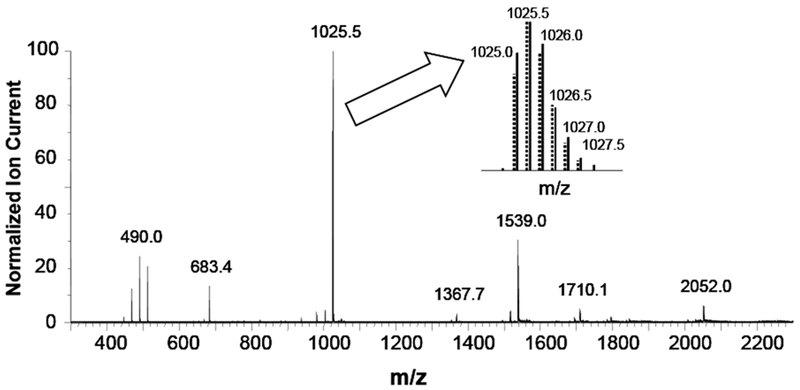
Negative ion electrospray spectrum of 1 at 80uMol/L, Collision Energy of 10 Vdc and Capillary Voltage 2.5kVdc. Inset compares measured isotopic distribution (solid lines) with the theoretical isotopic distribution (dotted lines) in the molecular ion region for the doubly-charged dimer C138H12O24 .
In contrast to the positive ion spectrum which has minor fragment peaks from the loss of water, the negative ion spectrum exhibits multiple carboxyl losses. Note that odd numbered carboxyl losses from the doubly-charged dimer will be obvious by the presence of half mass ions in the isotopic cluster for that fragment. The only odd numbered carboxyl loss observed is at m/z 1003.5 [MM† - CO2 - 2H] − −, 22 mass units lower than the mass of the doubly-charged dimer ion at m/z 1025.5. The relative abundance of peaks in the ion cluster at m/z 1003.5 further supports our observation that this ion arises from the loss of a carboxyl from the doubly-charged dimer ion.
In addition, isotopic clusters of fragment ions are observed at m/z 981 and 937; the loss of one and two carboxyls respectively. The absence of half-mass ions and the relative abundance of the peaks in these clusters indicate that they are singly-charged and monomeric. The exact mechanism by which these ions are formed will be discussed in more detail below. It is interesting to note that carboxyl losses from the doubly-charged monomer (mass range 446 to 512) are significantly more intense than those from the singly-charged monomer (mass range 893 to 1025) or doubly-charged dimer (mass range 1986 to 2052). This suggests that the smaller the charge to mass ratio of the oligomer, the more stable the ion is with respect to carboxyl losses.
Besides having a more complex spectrum than the positive ion spectrum, the negative ion oligomers and fragment ions of various charges are strongly dependent on experimental conditions. Below, we investigate the behavior of these ions as a function of analyte concentration and ESI source capillary voltage.
Negative Ion Electrospray: Concentration Dependence
A spectrum of 1 is shown in Figure 6 at a lower analyte concentration, 20uMol/L. This spectrum differs slightly from that shown in Figure 5 in which the analyte concentration is 80 μMol/L. In particular, the ions in the doubly-charged monomer region, from m/z 446 to 512 shift in intensity towards the 512 ion. Also the ion cluster from the triply-charged dimer at m/z 683.3, [MM† − 3H] − − − is more intense than that shown in Figure 5; and the carboxyl losses at m/z 668.7 are slightly more intense.
Figure 6.
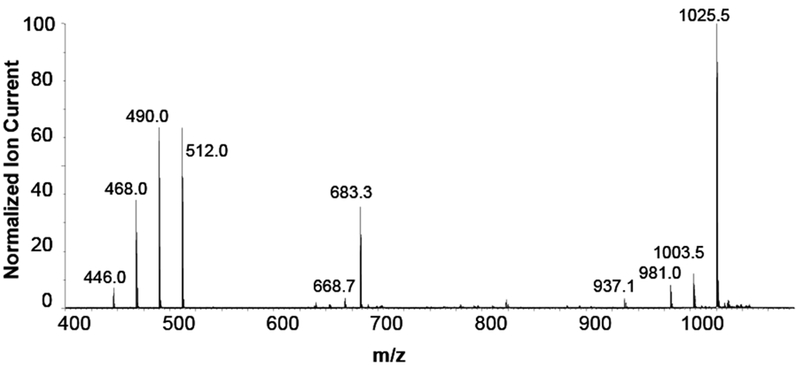
Negative ion spectrum of 1 infused at 5uL/min at a concentration of 20μMol/L. Capillary voltage 2.5 kVdc and Collision energy 10.0 Vdc.
The concentration dependence of several ions is shown in Figure 7. The doubly-charged dimer ion at m/z 1025.5 [MM† − 2H] − − , the monomer ion at 1025.0, [M − H] − after correction for contribution from the doubly-charged dimer, and several other important fragment ions derived from loss of one carboxyl from each of these species. Initially, for analyte concentrations up to 20μMol/L, there is a sharp increase in the ion current for all ions. However with increased analyte concentration, the ion current of the m/z 1025.5 ion decreases slightly while the other ions fall off more quickly.
Figure 7.
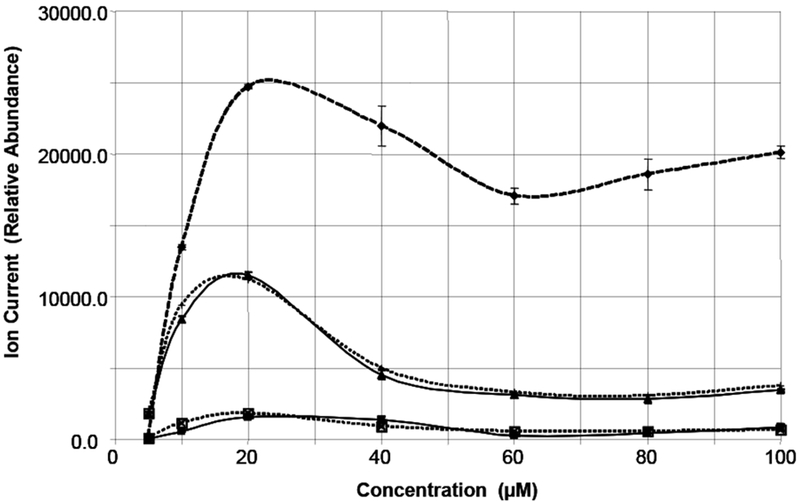
Concentration dependence of important ions at Capillary Voltage 2.5 kVdc and Collision Energy 10Vdc. Dashed line with diamonds m/z 1025.5, [MM† - 2H] − − ; Solid line with triangles m/z 512, [M − 2H] − − ; Dotted line with + m/z 490, [M − CO2 − 2H] − − ; Solid line with squares m/z 1025, [M − H] − (corrected for contribution from doubly-charged dimer); Dotted line with X m/z 981, [M − CO2 − H] −
The ion current for m/z 1025.0 has been corrected for the contribution of doubly-charged dimer [MM - 2H] − − ; and thus represents the amount of singly-charged monomer [M - H] − . Both ions representing carboxyl losses (m/z 981 and 490) track very closely with their respective precursor ions (m/z 1025 and 512 ). Comparing the shape of the concentration curves for the positive and negative ion electrospray experiments reveals a striking difference. Whereas the positive ion electrospray curve shows the expected linear increase with concentration, no such behavior is observed in negative ion mode. Thus, it appears that under all conditions of concentration, in negative ion mode, the molecule prefers to form doubly-charged ions; either monomers at low concentrations or dimers at high concentrations. What is not clear is why the response flattens out and decreases as the analyte concentration is increased by a relatively small amount.
Negative Ion Electrospray: Capillary Voltage Dependence
The capillary voltage controls the charging of droplets leading to subsequent ion formation and can be varied from 0 to 4kVdc; establishing a threshold for ionization; which in this instrument for most compounds is in the range of 2.5 to 3.0 kVdc. Increasing the capillary voltage beyond this value imparts additional energy, and possibly charge, during the ionization process and in some molecules can lead to the formation of fragment ions in the source prior to any mass separation. We investigated the effect of capillary voltage over the range from 2.00 to 4.00 kVdc in 250 Vdc increments while continuously infusing an 80uMol/L solution of 1 in methanol at 5uL/min . At this concentration, the dominant species is the doubly-charged dimer, followed by singly-charged carboxyl losses from the monomer and then doubly-charged carboxyl losses from the dimer. Data for these ions is shown in Figure 8.
Figure 8.
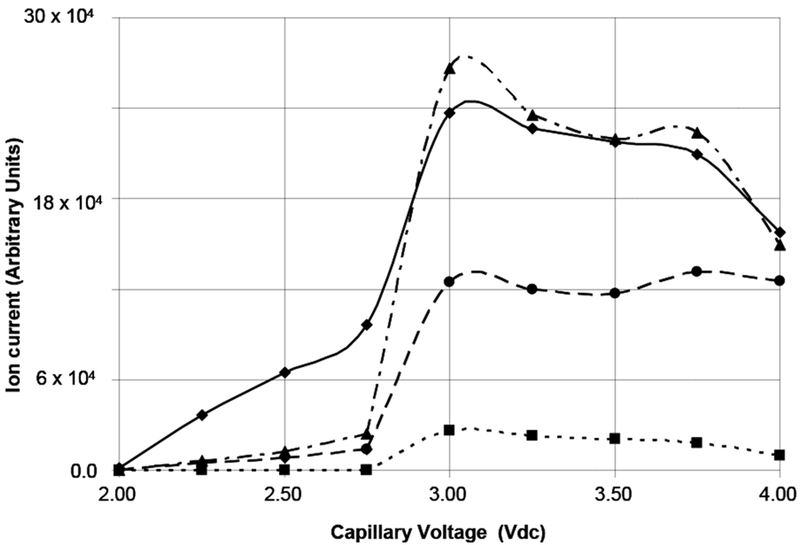
Ion current as a function of Capillary Voltage for selected ions. ♦ Sum of doubly-charged dimer ions [MM - 2H] − − ; ■ m/z 1025.0, [M - H] − (corrected); ▲Sum of singly-charged carboxyl losses; ● Sum of doubly-charged carboxyl losses.
Note that the ion current for the singly-charged monomer at m/z 1025.0 ( filled squares ) is zero over the range of capillary voltages from 2.00 to 2.75 kVdc. The ion currents for all of the other species shown in Figure 8 increase in proportion to one another in a linear fashion over this range. However, at a capillary voltage of 3.0 kVdc, the ion currents for all of the species increase significantly. Interestingly, the sum of the ion currents for singly-charged carboxyl losses (filled triangles) is greater than for the sum of doubly-charged dimer ions (filled diamonds) at capillary voltages of 3kVdc and higher. In this region, all of the ion currents decrease with the exception of those for the sum of doubly-charged carboxyl losses; which is essentially flat. Clearly, 2.75 kVdc is the optimum value of the capillary voltage to minimize fragment ion formation. At this capillary voltage, almost all of the ionization is in the doubly-charged dimer ion.
In a spectrum dominated by doubly-charged dimer ions, two separate steps are required to produce singly-charged decarboxylated fragment ions; dissociation of the dimer ion and decarboxylation. But the order in which these steps occur is not obvious. It is not possible to determine the order of the two steps leading to the formation of the singly-charged decarboxylated fragment ions on the basis of the negative ion spectrum alone. Consequently, a tandem mass spectrometry experiment was performed.
Negative Ion Electrospray: MS/MS Experiments
We performed MS/MS experiments on the individual ions in the molecular ion region; m/z 1025.0, 1025.5, and 1026.0. In order to isolate these ions from one another the LM and HM Resolution parameters of the Waters Ultima Global Q-ToF had to be set to a very high value; typically 17. This narrowed the acceptance window of the ToF so much that we observed a slight decrease in the intensity of the ion selected for MS/MS. However, by this means we were able to exclude almost completely the neighboring half-mass ions from entering the ToF thus minimizing their contribution to the MS/MS spectrum of the selected ion.
Although we obtained good MS/MS spectra for all three ions in the molecular ion region, the information from the spectrum of the m/z 1025.0 ion does not provide us with any insight as to the order of events in the formation of decarboxylated singly-charged fragment ions. Consequently, we focused our attention on the product-ion spectra of the m/z 1025.5 and 1026.0 ions, which consist primarily of doubly-charged dimer ions that contain one and two 13C atoms respectively.
MS/MS of 1025.5 ion:
The ion at m/z 1025.5 can ONLY be the doubly-charged dimer containing one 13C atom [MM†-2H] − −. If the splitting of the doubly-charged dimer into singly-charged monomers occurs then there should be peaks of equal intensity on either side of the m/z 1025.5 ion at m/z 1025.0 and 1026.0. There is a small 1025.0 ion present, but it arises because the mass selection window cannot be made any narrower. Thus, the precursor ion region indicates that splitting of the doubly-charged dimer into two singly-charged monomer ions does not occur, or that these species are extremely short-lived.
Considering the fragment ion region of the spectrum, we note doublets at m/z 849 and 937 and triplets at m/z 893 and 981 in this spectrum (see insets in Figure 9). For each doublet, the low mass peak corresponds to the loss of n carboxyls from the [M − H] − ion and the high mass peak corresponds to the loss of n carboxyls from the [M† − H] − ion. These ions would occur at integer mass values. These peaks offer conclusive proof that the order of formation of the singly-charged decarboxylation fragment ions proceeds via splitting of the doubly-charged dimer into two singly-charged monomers followed by decarboxylation. For each triplet, the same explanation holds true for the integer mass satellites, whereas the half-mass ions in the middle of the triplet are doubly-charged dimer fragments produced by decarboxylation of the doubly-charged dimer parent.
Figure 9.
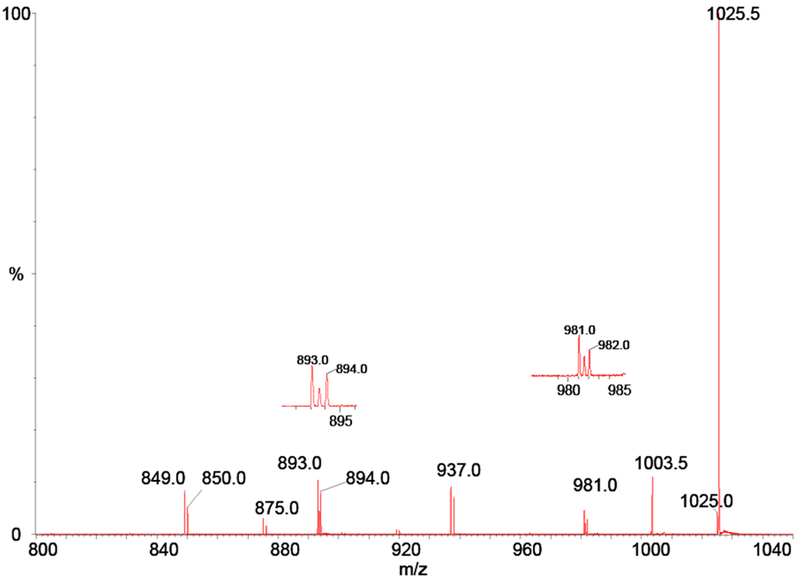
MS/MS spectrum of the 1025.5 ion from the negative ion electrospray of 1
Note that these latter ions are observed only at m/z 1003.5, 981.5 and 893.5 reflecting losses of 1, 2 and 6 carboxyls from the doubly-charged precursor ion. There are no odd-numbered carboxyl losses from the doubly-charged dimer other than that for one carboxyl; suggesting that the 5 and 7 decarboxylation process does not occur in the doubly-charged dimer ion. The relative intensities of the half-mass ions, indicative of doubly-charged decarboxylated fragments, to the integer mass ions, indicative of singly-charged monomer fragments, suggests that the decarboxylation of the dimer ions is less favored. Finally, we note that the lower mass ion of any carboxyl loss is more abundant than the higher. We attribute this to the fact that a small fraction of the ions selected for MS/MS of m/z 1025.5 includes some ions from m/z 1025.0; since – as noted above -- the mass selection window is unable to exclude the entire lower mass ion from the MS/MS experiment.
MS/MS of 1026.0 ion:
Ions with three different 13C compositions are contained in the 1026.0 ion; a singly-charged monomer, (M†-H)− , and two different doubly-charged dimers (M†M†-2H)− − and (MM††-2H)− − , containing one and two 13C atoms respectively. From previous results above, the monomer ion should be less than a few percent of the total ion current at m/z 1026.0. We know on a statistical basis, that 50% of the doubly-charged dimer ions are homodimers, (M†M†-2H)− − , and 50% are heterodimers (MM††-2H)− − . Again, looking closely at the parent ion region of the MS/MS spectrum it is apparent that there are no ions observed at 1025.0, (M-H)−, and 1027.0, (M††-H)− ; ions which should be present if the dimer ion were to dissociate into long-lived monomer ions.
This spectrum shows the same carboxyl losses as for the 1025.5 MS/MS experiment; however, triplets appear at every fragment ion except for the loss of one carboxyl from the dimer ( m/z 1004 ). The satellite peaks in these triplets again support the mechanism in which the doubly-charged dimer fragments into two singly-charged monomers that subsequently undergo carboxyl losses. When this mechanism occurs for the homodimer ion, only the central peak of the triplet will appear since each mer of the homodimer contains one 13C atom. However, for the heterodimer, one mer contains two 13C atoms and the other none, thus producing ions two mass units apart with the fragments from the homodimer ion between them. If this were the only mechanism producing the triplet ions at the various carboxy losses, then the relative abundance of the peaks in the triplet should be 1:2:1. This is nearly the case for most losses as can be seen by visually inspecting the individual blowups of the various triplets. However, we note that for the loss of 44 Da from the precursor ion at m/z 982, the central peak is much more abundant than would be expected on the basis of the intensity of the two smaller satellite peaks. In addition to the ions at this mass produced by the mechanism described above, this central peak has two other possible sources, the loss of one carboxyl from the singly-charged monomer, or the loss of two carboxyl from the doubly-charged dimer. Since we know that the parent ion is composed of mostly doubly-charged dimer, then the contribution to the m/z 982 ion by the loss of a carboxyl from the singly-charged monomer should be minimum. This indicates that a reasonable fraction of the 982 ion arises from the loss of two carboxyl from the doubly-charged dimer.
MS/MS of the 1025.5 as a function of collision energy
Finally, it is instructive to investigate the formation of fragment ions as a function of collision energy as shown in Figure 11. The left panel in Figure 11 shows the behavior of doubly-charged fragment ions formed by the loss of carboxyl groups from the doubly-charged dimer. Note that the precursor ion, m/z 1025.5, decreases almost linearly with increasing collision energy.
Figure 11.
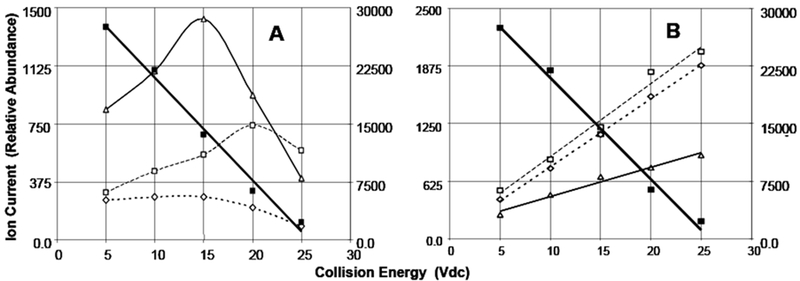
Selected ions in the MS/MS spectrum of the 1025.5 ion as a function of collision energy. Capillary voltage: 3.0 kVdc, 80umol/L solution infused at 10uL/min.
A: Right Scale: filled squares, m/z 1025.5 precursor ion. Left Scale: Open triangles, m/z 1003.5. Open squares, m/z 893.5. Open diamonds, m/z 981.5 ion.
B: Right Scale: filled squares, m/z 1025.5 precursor ion. Left Scale: Open triangles, m/z 981.0. Open squares, m/z 893.0. Open diamonds, m/z 937.0 ion.
However, doubly-charged fragment ions increase initially, but then decrease with increasing collision energy. This is in contrast to the singly-charged monomer fragments shown in the right graph which increase almost linearly with increased collision energy. Note also the left axes of both graphs show the ion current for the fragment ions and that for the doubly-charged dimer fragments, the ion current is significantly less than for the singly-charged monomer fragments.
Conclusions
The mass spectrometry of tris malonic acid fullerenes has been explored in both positive and negative ion electrospray experiments. Ion formation and fragmentation are significantly different for the different ionization modes. In positive ion mode, the spectra are simple with minimal fragmentation and the molecular ion region increases linearly with analyte concentration over the range studied. In negative ion mode, the spectra are more complex with the formation of dimer and fragment ions and the molecular ion region increases in a non-linear way with concentration. Further, in negative ion mode, fragment ions are affected by nearly every instrumental parameter controlling the ionization process.
From MS/MS data in negative on mode, we can conclude several things: 1) Fragment ions formed by the direct loss of carboxyl groups from the doubly-charged dimer occur for the loss of one, two and six carboxyl groups. Of these, the loss of one carboxyl is the most abundant. Apparently, the dimer structure is such that losses of three, four, five, seven and higher carboxyl groups is not favored. 2) The fragmentation of the doubly-charged dimer into two stable singly-charged monomers is not favored. 3) The dominant mechanism for the formation of singly-charged fragment ions arises from splitting of the doubly-charged dimers into singly-charged monomers with subsequent carboxyl losses.
Finally, we note that the ionization of this compound is extremely sensitive to the presence of impurities in the spray solvent. From an analytical standpoint, these results are not particularly encouraging for quantitative work. However, we have demonstrated that this compound and its related analogs can be ionized by electrospray ionization, provided sufficient care is taken in using very pure solvents.
Figure 10.
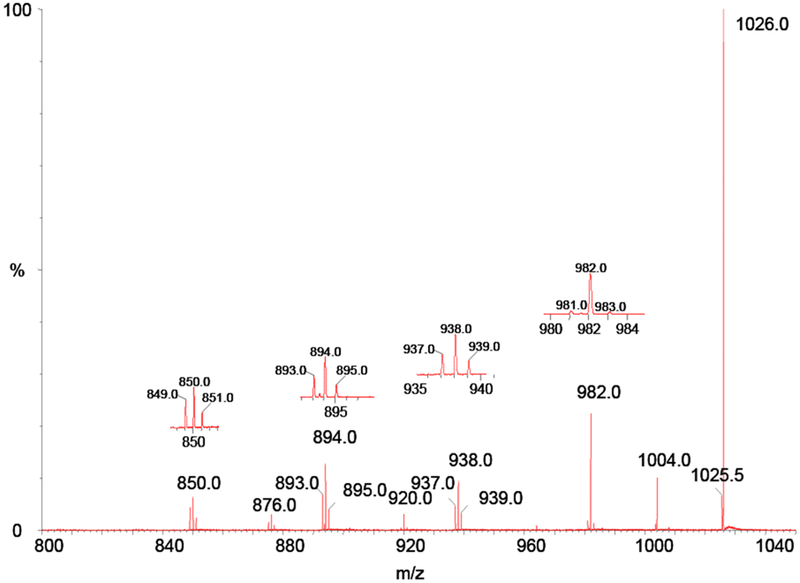
MS/MS spectrum of the 1026.0 ion from negative ion electrospray of 1
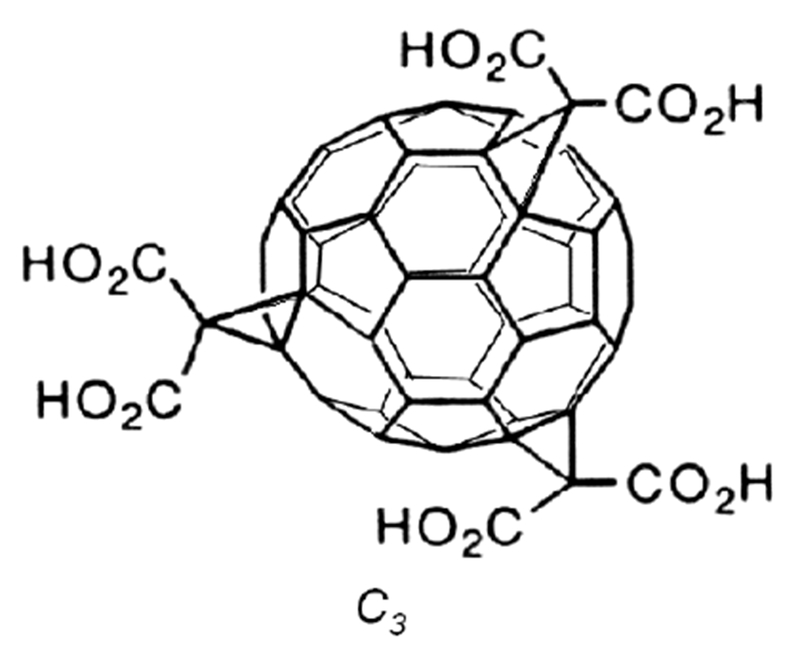
Structure 1
Acknowledgements
This work was supported by NIH NS37688, and a gift from the family of Selma J. Hartke (LLD); and the Washington University NIH / NIGMS Biomedical Mass Spectrometry Resource P41GM103422 (MLG). The authors would like to thank Dr. Eva Lovett for excellent synthesis and preparation of the compound studied, and for insightful comments and input throughout the course of the work.
References
- 1.Lamparth I and Hirsch A, Water-soluble Malonic Acid Derivatives of C60 with a Defined Three-dimensional Structure, J. Chem. Soc., Chem. Commun, 1994, 1727–1728. [Google Scholar]
- 2.Isaacs L and Diederich F, 176. Structures and Chemistry of Methanofullerenes: A Versatile Route into N-[(MethanofuIlerene)carbonyl]-Substituted Amino Acids, Helvetica Chimica Acta, 1993, 76, 2454–2464 [Google Scholar]
- 3.Hummelen JC, Knight BW, LePeq F, Wudl F, Yao J and Wilkins CL, Preparation and Characterization of Fulleroid and Methanofullerene Derivatives, J. Org. Chem, 1995, 60, 532–538 [Google Scholar]
- 4.Wilson SR and Wu Y, Applications of Electrospray Ionization Mass Spectrometry to Neutral Organic Molecules Including Fullerenes, J. Am. Soc. Mass Spectrom, 1993, 4, 596–603 [DOI] [PubMed] [Google Scholar]
- 5.Wilson SR and Wu Y, Detection of Methoxylated Anions of Fullerenes by Electrospray Ionization Mass Spectrometry, J. Am. Chem. SOC, 1993,115, 10334–10337. [Google Scholar]
- 6.Dupont A, Gisselbrecht J-P, Leize E, Wagner L and Van Dorsselaer A, Electrospray Mass Spectrometry of ElectrochemicaIly Ionized Molecules: Application to the Study of Fullerenes. Tett. Let, 1994, 35, 6083–6086 [Google Scholar]
- 7.Barrow MP, Feng X, Wallace JI, Boltalina OV, Taylor R, Derrick PJ and Drewello T, Characterization of Fullerenes and Fullerene Derivatives by Nanospray. Chem. Phys. Lett, 2000, 330, 267–274 [Google Scholar]
- 8.Deng J-P, Mou C-Y; Han C-C Mass Spectrometric Study of C60O and isomers of C60O2. Proc. Electrochem. Soc Proceedings of the Symposium on Recent Advances in the Chemistry and Physics of Fullerenes and Related Materials; 1995, 95-10, 1409–1424 [Google Scholar]
- 9.Zhang R, Fisher KJ, Smith DR, Willett GD, Peel JB, Gan LB, Shi YR; Gao Z, An electrospray ionization Fourier transform ion cyclotron resonance mass spectrometry study of 1,6-methano[60]fullerene-61,61-dicarboxylic acid. European Journal of Mass Spectrometry, 2000, 6 (2), 161–168. [Google Scholar]
- 10.Debre O, Budde WL and Song X, Negative ion electrospray of bromo- and chloroacetic acids and an evaluation of exact mass measurements with a bench-top time-of-flight mass spectrometer, J. Am. Soc. Mass Spectrom, 2000, 11, 809–821. [DOI] [PubMed] [Google Scholar]
- 11.Dugan LL, Lovett EG, Quick KL and Hardt JI, Therapeutic malonic acid/acetic acid C60 tri-adducts of buckminsterfullerene and methods related thereto. USP 2004/0034100 A1 February 19, 2004.
- 12.Grayson MA, Lovett EG, Dugan LL and Gross ML, Proceedings of the 49th ASMS Conference on Mass Spectrometry and Allied Topics, 2001, Chicago IL, American Society for Mass Spectrometry. [Google Scholar]
- 13.Cole RB, Some tenets pertaining to electrospray ionization mass spectrometry. J. Mass Spectrom, 2000, 35, 763–772. [DOI] [PubMed] [Google Scholar]
- 14.Kebarle P, A Brief Overview of the Present Status of the Mechanisms Involved in Electrospray Mass Spectrometry. J. Mass Spectrom, 2000, 35, 804–817 [DOI] [PubMed] [Google Scholar]


