

Abstract
Nicotinamide adenine dinucleotide (NAD+) is a central signaling molecule and enzyme cofactor that is involved in a variety of fundamental biological processes. NAD+ levels decline with age, neurodegenerative conditions, acute brain injury, and in obesity or diabetes. Loss of NAD+ results in impaired mitochondrial and cellular functions. Administration of NAD+ precursor, nicotinamide mononucleotide (NMN), has shown to improve mitochondrial bioenergetics, reverse age associated physiological decline, and inhibit post-ischemic NAD+ degradation and cellular death. In this study we identified a novel link between NAD+ metabolism and mitochondrial dynamics. A single dose (62.5mg/kg) of NMN, administered to male mice, increases hippocampal mitochondria NAD+ pools for up to 24 hours post-treatment and drives a sirtuin 3 (SIRT3) mediated global decrease in mitochondrial protein acetylation. This results in a reduction of hippocampal reactive oxygen species levels via SIRT3 driven deacetylation of mitochondrial manganese superoxide dismutase. Consequently, mitochondria in neurons become less fragmented due to lower interaction of phosphorylated fission protein, dynamin-related protein 1 (pDrp1 (S616)), with mitochondria. In conclusion, manipulation of mitochondrial NAD+ levels by NMN results in metabolic changes that protect mitochondria against reactive oxygen species and excessive fragmentation, offering therapeutic approaches for pathophysiologic stress conditions.
Graphical Abstract
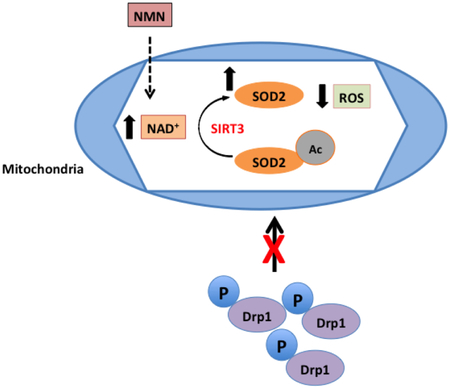
NMN administration increases mitochondrial NAD+ pools and drives the reduction of mitochondria generated ROS via a SIRT3 dependent deacetylation and stimulation of SOD2 activity. As a result, fission is less active due to decreased binding of pDrp1 (S616) to the mitochondrial outer membrane.
1. Introduction
Nicotinamide adenine dinucleotide (NAD+) is now recognized as a central signaling molecule and enzyme cofactor that is involved in a variety of fundamental biological processes including cellular bioenergetic metabolism, life span regulation, DNA repair, cell death mechanisms, and telomere maintenance (Brennan et al. 2006, Belenky et al. 2007). The majority of NAD+ is replenished via the salvage pathway by two enzymatic reactions (Belenky et al. 2007). In the first rate limiting step nicotinamide (Nam), a byproduct of NAD+ consuming enzymes, is converted to nicotinamide mononucleotide (NMN) via nicotinamide phosphoribosyltransferase (Nampt). In the second step NMN is adenylylated by nicotinamide nucleotide adenylyltransferase (NMNAT) to form NAD+. NMN can also be generated via phosphorylation of nicotinamide riboside (NR) by nicotinamide riboside kinase (NRK) (Belenky et al. 2009). The requirement of NRK1 activity for generation of NAD+ from NR was confirmed using NRK1 knockout animals (Ratajczak et al. 2016). Additionally, NMN can be a substrate for ectoenzyme CD73 that then generates NR from NMN (Grozio et al. 2013).
NAD+ levels decrease in brain with age, in obesity or diabetes (Yoshino et al. 2011, Verdin 2015, Imai and Guarente 2014), under pathologic conditions of neurodegenerative disease (Long et al. 2015, Lu et al. 2014, Liu et al. 2013, Martire et al. 2015), and also following acute brain injury induced by ischemic insult or trauma (Lo et al. 1998, Szabo and Dawson 1998, Kauppinen and Swanson 2007, Liu et al. 2009, Park et al. 2016, Zhu et al. 2005). Loss of NAD+ results in several impaired cellular functions one of which is mitochondrial dysfunction.
Mitochondria respond to stress by altering not only their functional outcome but also their structure and morphology. This ability of mitochondria to structurally adapt to the change in metabolic environment is referred to as “mitochondrial dynamics”. Fission, fragmentation of mitochondria, occurs when there is a higher energy demand. Smaller organelles can then move more efficiently to the part of the cell where energy supply is needed. Additionally, fission can isolate damaged mitochondrial proteins or DNA and eliminate these by directing them to degradation by mitophagy (Buhlman et al. 2014, Chen and Chan 2009, Liu et al. 2012, Ni et al. 2015). Under pathologic stress the mitochondrial population shifts to a highly fragmented state generating excessively small organelles that lack essential metabolites and proteins required for normal function. This process is reversed by fusion, which combines contents of the fragmented population. Fusion thus stabilizes mitochondrial protein and DNA levels and forms mitochondria with regained function and morphology. Several proteins are responsible for controlling mitochondrial fusion and fission. Fusion of the mitochondrial outer membrane is mediated by mitofusion 1 (MFN1) and mitofusion 2 (MFN2) while the inner mitochondria membrane fusion is controlled by optic atrophy 1 gene (Opa1) (Anne Stetler et al. 2013, Song et al. 2009, Klimova et al. 2018). Fission is mediated by dynamin-related protein 1 (Drp1) which is recruited to the mitochondria from the cytosol. Phosphorylation of Drp1 at serine 616 (pDrp1 S616) promotes targeting of Drp1 to the mitochondria to execute the fission process (Chang and Blackstone 2010, Han et al. 2008).
Sirtuin 3 (SIRT3), a member of the sirtuin protein deacetylase family, is localized to the mitochondrial matrix and its activity is NAD+-dependent (Ahn et al. 2008, Anderson and Hirschey 2012). Sirtuins transfer an acetyl group from the lysine residue of acetylated protein onto ADP-ribose to form 3’-O-acetyl-ADP-ribose (Lawson et al. 2010). Mitochondrial protein acetylation controls energy metabolism processes by modulating the activity of the tricarboxylic acid cycle (TCA) enzymes, respiratory chain complexes, as well as enzymes involved in reactive oxygen species (ROS) degradation, and mitochondrial dynamics (Parodi-Rullan et al. 2018). Consequently, depletion of NAD+ decreases SIRT3 activity and increases acetylation of its target proteins (Lombard et al. 2007). Hyper-acetylation of mitochondrial proteins can result in altered mitochondrial metabolism and oxidative state. Thus, the mitochondrial acetylome can greatly dictate cellular homeostasis.
Supplementing mice with NMN can increase NAD+ levels, ameliorate glucose intolerance, and restore gene expression related to oxidative stress in high fat diet-induced diabetes (Yoshino et al. 2011). Furthermore, NMN mitigates age-associated physiological decline (Mills et al. 2016) and reverses vascular dysfunction and oxidative stress in aging mice (de Picciotto et al. 2016). Administration of NMN to animals that represent the transgenic model of Alzheimer’s disease showed improved mitochondrial bioenergetic functions and reduced fragmentation (Long et al. 2015). We carried out dose dependent experiments of NMN administration following global cerebral ischemia that showed an NMN-induced inhibition of post-ischemic NAD+ catabolism and dramatic amelioration of ischemic cell death (Park et al. 2016). Therefore, we decided to study the mechanisms of NMN protection by exploring the downstream effects of NMN administration on mitochondrial NAD+ levels, protein acetylation, and modulation of mitochondrial dynamics.
2. Methods
2.1. Animals
Adult, 3 months old C57Bl6 male mice (Jackson Laboratories) were used for experiments. Female animals were not used due to the difference in NAD+ metabolism between males and females (Siegel and McCullough 2013, Owens et al. 2013). The animals were maintained in a 12-hours light/dark cycle, and were housed in groups of 2 to 5 mice per cage in a temperature (22 ± 1°C) and humidity (55 ± 15%) controlled room. All mice were allowed free access to water and a maintenance diet (Teklad mouse diet, Envigo). All cages contained bedding and nesting material (Nestlets, Ancare) for environmental enrichment. The mice were free of all viral, bacterial, and parasitic pathogens. Mice were divided at random into several groups for all experiments. The animal protocol was approved by the Animal Care and Used Committee of the University of Maryland, Baltimore, in accordance with the National Institutes of Health Guidelines for Care and Use of Laboratory Animals.
2.2. Generation of mito-eYFP and mito-eYFP-SIRT3KO animals
To visualize cell-type specific mitochondria in the brain we used our transgenic animal model that expresses mitochondria targeted yellow fluorescence protein (mito-eYFP) in neurons (Chandrasekaran et al. 2006). To examine the role of SIRT3 in regulation of mitochondrial dynamics we generated transgenic mice that express the mitochondria targeted eYFP in neurons and carry homozygous knockout of the Sirt3 gene (mito-eYFP-SIRT3KO). These animals were generated by cross-breeding our mito-eYFP mice with SIRT3KO animals (B6.129S6(Cg)-Sirt3tm1.1Fwa/J) obtained from Jackson Laboratories (Bar Harbor, ME). Thus, the offspring that were SIRT3KO and also expressed the mito-eYFP in neurons (mito-eYFP-Sirt3KO) were used in this study. Twelve to fourteen weeks old male mice were used for experiments.
2.3. NMN administration
NMN (Sigma N3501) was prepared in sterile PBS and was administered to mice at 62.5 mg/kg dose (Park et al. 2016). The drug or vehicle solution (PBS) of the same volume (200 μl) was injected intraperitoneally (i.p.) using 29G needles. NMN doses and vehicle solution were prepared the same day as administered. To avoid the effect of circadian rhythm on brain tissue NAD+ levels, all samples were collected at the same time of the day between 9 and 10 AM. The investigator performing the drug administration, sample collections and processing was blinded to the final identity of the groups.
2.4. Brain tissue and blood sample collection for metabolites determination
Frozen brains were collected 15 minutes, 1, 4, 24, and 48 hours after NMN injection (n=4-6/group). Under deep anesthesia, induced by 5% isoflurane for 5 min, the animal heads were frozen in situ with liquid nitrogen. Afterward, the brains were carefully removed from the frozen heads with a saw, a hammer, and a chisel inside a glove box cooled to −20°C. Then the hippocampi were dissected as described previously (Hu et al. 1998), and stored in the −80°C freezer until processed for HPLC or western blots. Arterial blood was collected at 5, 15 minutes, and at 1 hour after NMN administration and the plasma was isolated by centrifugation at 10,000g for 10 min at 4 °C (n=4-6/group). The supernatant was then stored at −80°C till further processing.
2.5. Hippocampal mitochondria isolation
Non-synaptic hippocampal mitochondria were isolated at 15 minutes, 1, 4, 24, 48 hours after NMN administration according the technique described in (Kristian et al. 2000, Kristian 2010) (n=4-6/group). Briefly, following decapitation, mouse hippocampi were isolated on ice and then homogenized in ice-cold isolation medium (225 mM sucrose, 75 mM mannitol, 1 mM EGTA, 5 mM Hepes) with protease inhibitors (AG Scientific T-2495), acetylation inhibitors (10 μM TSA, 10 mM nicotinamide, 10 mM sodium butyrate), and PARP1 inhibitors (2mM Naorthovanadate, 5 mM NaF, 5 mM glycerol-2-phosphate, 1 μM ADP-HPD, 40 μM PJ-34). Homogenate was mixed with 30% percoll (1:1 volume to volume) and loaded on a 24%-40% percoll gradient. Gradient was centrifuged at 30,700g for 8 minutes at 4°C. The accumulated layer at the 24% and 40% percoll interface was collected as purified mitochondria. Isolation medium was added to the collected fraction and centrifuged at 16,700g for 10 minutes at 4°C. Supernatant was removed and additional isolation medium was added and centrifuged at 6,900g for 10 min at 4°C. Pellet was collected and re-suspended in isolation medium lacking EGTA and used for either western blots or metabolite measurement.
2.6. Extraction of brain tissue metabolites
Hippocampi were pulverized using a liquid nitrogen-cooled Bessman pulverizer (Repligen, Waltham, MA) and the metabolites were extracted by 7% ice-cold perchloric acid (PCA). Similarly, the metabolites from isolated mitochondria and plasma were extracted by 7% PCA. Following extraction with PCA the samples were incubated on ice for 15 minutes with occasional vortexing. Then after centrifugation at 10,000g for 10 minutes at 4°C the pellet was used for Lowry protein measurements. The supernatant was neutralized with 1 M Trizma and 9 M KOH and centrifuged again at 10,000g for 10 minutes at 4°C. The supernatant was then filtered by 0.22 μm PVDF filter and used for either HPLC or NAD+ determination by enzymatic cyclic assay (Kristian and Fiskum 2004).
2.7. HPLC measurement of brain tissue metabolites
NAD+, NMN, NR, and ATP were separated and measured using the Agilent Chemstation 1100 high performance liquid chromatography (HPLC) machine with a Jupiter C18 300A (250 × 4.6 mm, 5 micron) column. To the extracted metabolites from hippocampal tissue samples a concentration gradient similar to (Broetto-Biazon et al. 2009), see also (Long et al. 2017) was created with 50 mM sodium phosphate pH 6 and 50% of 50 mM sodium phosphate in HPLC grade methanol pH 7. The gradient consisted of following steps (in % methanol): 0 min, 0%; 6.5 min, 0.5%; 9 min, 3%; 11 min, 5%; 12 min, 12%; 14 min, 15%; 16 min, 20%; 21 min, 30%; 22 min, 50%. NAD+ retention time was 14.7 min, NR 5.9 min, ATP 5.2 min, and NMN 4.3 min. The authenticity of individual metabolites in the samples was confirmed by co-elution with NAD+, NMN, ATP or NR standards. All samples were diluted 1:1 in their respective 50 mM sodium phosphate buffer before being loaded and run on HPLC. The temperature was kept at 30°C and the injection volume was 80 μL. Between runs the column was washed with water and methanol.
2.8. Measurement of Mitochondrial NAD+ levels
Due to limited volume, the NAD+ content in hippocampal mitochondria and plasma samples was measured by a cycling enzymatic assay that generates a fluorescent product (Kristian and Fiskum 2004). NAD+ levels were normalized to the protein amount from mitochondrial or plasma samples.
2.9. Western Blots
After hippocampal dissection and mitochondrial isolation was performed, protein concentration was measured using the Lowry assay. Twenty-five μg of protein were heated at 75°C, loaded into Bio-Rad 10 well mini-protean TGX precast gels and separated through sodium dodecyl sulfate polyacrylamide gel electrophoresis (SDS-PAGE). Gels were transferred to immobilon PVDF-FL membranes using the Trans-Blot Turbo system (Bio-Rad). Membranes were incubated in Odyssey blocking buffer (Li-cor Biosciences) for 1 hour before being incubated in primary antibody overnight at 4°C (for list of used antibodies see Table 1). After washing in phosphate buffered saline with 0.1 % tween-20 (PBST), the membranes were incubated in infrared (IR) fluorophore conjugated secondary antibody (Li-Cor) for 30 minutes at room temperature in the dark (Table 1). Following PBST and PBS washes, the membranes were scanned, and bands were quantified with Odyssey infrared imaging system (Li-Cor). The β-actin and VDAC signal were used as normalization for hippocampal homogenate and mitochondria, respectively. Additionally, all antibodies were titrated to appropriate working concentrations before use.
Table 1.
Antibody Reporting
| Description /Immunogen |
Manufacturer Details |
RRID | Concentration | |
|---|---|---|---|---|
| Acetylated-Lysine Rabbit mAb | ε-amine groups of lysine residues | Cell Signaling Cat No: 9814 |
AB_10548766 | 1:1000 |
| Sirt3 Rabbit mAb | Val130 of mouse SirT3 isoform S | Cell Signaling Cat No: 5490 |
AB_10828246 | 1:1000 |
| Sirt5 Rabbit mAb | Full-length human SirT5 protein | Cell Signaling Cat No: 8779 |
N/A | 1:1000 |
| β-Actin Mouse mAb | Amino-terminal residues of human β-actin | Cell Signaling Cat No: 3700 |
AB_2242334 | 1:15,000 |
| β-Actin Rabbit mAb | Amino-terminal residues of human β-actin | Cell Signaling Cat No: 8457 |
AB_10950489 | 1:15,000 |
| VDAC1/Porin Mouse mAb | Recombinant full length human protein | Abcam Cat No: ab14734 |
AB_443084 | 1:5000 |
| VDAC Rabbit mAb | Amino terminus of human VDAC-1 protein | Cell Signaling Cat No: 4661 |
AB_10557420 | 1:5000 |
| MFN1 Rabbit pAb | Human MFN1 protein | ProteinTech Cat No: 13798-1-AP |
AB_2266318 | 1:1000 |
| MFN2 Mouse mAb | C-terminus of human MFN2 protein | Abcam Cat No: ab56889 |
AB_2142629 | 1:1000 |
| OPA1 Mouse mAb | Human OPA1 amino acids 708-830 | BD Biosciences Cat No: 612606 |
AB_399888 | 1:1000 |
| SOD2 Rabbit pAb | Human SOD2 protein | ProteinTech Cat No: 24127-1-AP |
N/A | 1:1000 |
| GCN5L1 Rabbit pAb | C-terminus (MLSRLLKEHQAKQNER-C) of human GCN5L1 protein | Provided by Dr. Sack {Scott, 2012 #962} |
N/A | 1:500 |
| pDrp1 (S616) Rabbit mAb | Residues surrounding Ser616 of human DRP1 | Cell Signaling Cat No: 4494 |
AB_11178659 | 1:500 (IHC) 1:1000 (WB) |
| 800CW Goat anti-Mouse IgG (H + L) | Mouse IgG paraproteins | Li-cor Cat No: 925-32210 |
AB_2687825 | 1:100,000 |
| 680RD Goat anti-Rabbit IgG (H + L) | Rabbit IgG | Li-cor Cat No: 925-68071 |
AB_2721181 | 1:10,000 |
| Goat anti-Rabbit IgG (H+L) Alexa Fluor 594 | Rabbit IgG | ThermoFisher Cat No: A-11012 |
AB_141359 | 1:600 |
2.10. Immunoprecipitation
Vehicle or NMN was administered to mice and after 1 hour hippocampal tissue was dissected and homogenized in 500 μL RIPA buffer containing protease and acetylation inhibitors (10 μM TSA, 10 mM nicotinamide, 10 mM sodium butyrate) (n=4/group). The volume was adjusted to 1.5 ml with PBS and protein concentration was measured by Lowry assay. Four mg of tissue was incubated with protein A sepharose bead slurry (Sigma P9424) for 30 minutes on a rotator at 4°C. Mixture was centrifuged at 1000g for 3 minutes at 4°C and supernatant transferred to a new tube. Four μg of SOD2 antibody (Protein Tech 24127-1-AP) was added to supernatant and incubated rocking for 12 hours at 4°C. Protein A Sepharose bead slurry (50 μL) was added to the mixture to capture immunocomplex. Mixture was rocked for 12 hours at 4°C and then beads pelleted and washed 3 times with 1 ml 0.2 % TBS-Triton X-100. SOD2 was eluted using elution buffer (0.1 M Glycine, 0.05 M Tris-HCl, 0.5 M NaCl, pH 1.5-2.5) and neutralized by 10X PBS. 4X Laemmli Sample Buffer was added to the elution and heated at 95°C for 5 minutes. Western blot analysis was performed on samples using primary antibodies for SOD2 and acetylated lysine (Table 1) and normalized to the amount of SOD2 protein present. Negative control used was Protein A beads lacking antibody while positive control was recombinant SOD2 protein.
2.11. Superoxide Detection
For superoxide detection studies in vivo, dihydroethidium (DHE) was prepared as a 1 mg/mL solution in DMSO and administered 2 mg/kg by i.p. injection. A group of wild-type (WT) and SIRT3KO-mito-eYFP mice were administered DHE and PBS (vehicle) and another group with DHE and 62.5 mg/kg NMN (n=4-6/group). Three hours after administration mice were perfusion fixed with 4% paraformaldehyde. After perfusion brains were post-fixed overnight in cold paraformaldehyde and the next day transferred into 30% sucrose for 3 days. Afterwards, coronal sections of 40 μm were cut on a freezing microtome and collected. Cryoprotectant was washed from sections with KPBS and incubated in nuclear stain, Hoechst 33342, for 15 minutes at room temperature. Sections were washed with KPBS, mounted on slides, and hippocampal images were collected using laser scanning confocal microscope. Z-stack images were obtained from the CA1, CA3, and DG neuronal cell body layer of the hippocampal tissue. Four images were taken from each section. Images were analyzed with Volocity software (PerkinElmer, Waltham, MA). The total intensity of all objects within the recorded volume was counted and normalized to the unit volume (μm3).
2.12. Immunohistochemistry
Mito-eYFP and mito-eYFP-SIRT3KO mice were administered PBS or NMN and then perfusion fixed under deep anesthesia (Owens et al. 2015) (n=4/group). First, the mice were intubated and ventilated, then they were transcardialy perfused for 1 minute with oxygenated cold PBS (see (Owens et al. 2015). This was followed by perfusion with warm (37°C) 4% paraformaldehyde in PBS for 7 minutes. Afterwards brains were post-fixed overnight in cold paraformaldehyde and the next day transferred into 30% sucrose for 3 days. Coronal sections of 40 μm were cut on a freezing microtome and collected for staining. Cryoprotectant was washed from sections with KPBS and incubated with pDrp1 (S616) antibody (Table 1, Cell Signaling Technology Cat# 4494S, RRID: AB_11178659) at 4°C overnight in 0.3% KPBS-T (Triton X-100). pDrp1 (S616) working concentration was determined by NiDAB titration (Hoffman et al. 2016). Following washes in KPBS, sections were incubated in goat anti-rabbit (Alexa Fluor 594) secondary antibody (Table 1) for 1 hour shaking at room temperature. Another set of sections were stained only with secondary antibody to test for non-specific staining (Hoffman et al. 2016). Sections were then washed in KPBS and mounted on slides for analysis using laser scanning confocal microscopy. Four Z-stack images were obtained from the CA1 stratum oriens for each experimental group. Volocity software was used to measure colocalization by determining the Pearson’s coefficient between mito-eYFP and pDrp1 (S616) signal.
2.13. Quantification of mitochondrial dynamics
Mitochondrial length in mito-eYFP and mito-eYFP-SIRT3KO mice treated with PBS or NMN were measured as described in (Owens et al. 2015) (n=4/group). Briefly, z-stack images of mitochondria from hippocampal sub-regions (4 images/region) were collected using a laser scanning confocal microscope. Images were quantified using Volocity software (Owens et al. 2015). While defining individual mitochondria the program measures morphometric parameters of identified objects including skeletal length and diameter of each individual mitochondrion. After the measurement was complete, mitochondria were sorted based on length and the data exported to Excel (Version 14.7.7) for final calculations and graph constructions (Owens et al. 2015).
2.14. Laser Scanning Confocal Microscopy
Sections were imaged on a Ziess LSM 510 laser scanning confocal microscope using a Plan-Apochromat 63x/1.4 oil lens. Single planes of 1024 × 1024 pixels were recorded at 1.0–1.5 Airy unit pinhole every 0.5 μm z-spacing throughout the whole tissue section. For mitochondrial length analysis 0.2 μm z-interval was used. Lasers 405, 488, and 555 nm were used to visualize Hoechst 33342, eYFP, and Alexa Fluor 594, respectively.
2.15. Statistics
Statistical analysis was performed using KaleidaGraph (Synergy Software) version 4.5.0. All data are expressed as box plots. Sample size was estimated based on our previous study (Park et al. 2016). Data was assumed normally distributed based on the skewness or kurtosis parameter. Statistical significance was assessed by Student T-test when two groups were compared and one-way or two-way ANOVA test followed by the Tukey HSD post hoc test for multiple comparisons. Figure legend indicates which test was used for each corresponding experiment. The p values < 0.05 were considered to be statistically significant. However, due to small sample sizes we confirmed any significant differences between experimental groups also using non-parametric Kruskal Wallis test, or Mann-Whitney U test.
3. Results
3.1. NMN inhibits mitochondrial fission by reducing mitochondrial pDrp1 (S616) levels
To determine whether acute NMN treatment affects mitochondrial dynamics in the brain we decided to quantify the relative length distribution of neuronal mitochondria following a single dose of NMN injection. We have already shown that chronic administration of NMN for 28 days resulted in a shift of mitochondrial dynamics towards fusion (Long et al. 2015). To visualize neuronal mitochondria we used our transgenic mito-eYFP mice (Chandrasekaran et al. 2006). Morphometric parameters of mitochondria were measured in the hippocampal CA1 subregion (Figure 1A) (Owens et al. 2015). We chose the neuropil region for analysis since the density of mitochondrial in the perinuclear region is too high and the individual organelles cannot be readily identified (Owens et al. 2015). To quantify the changes in mitochondrial length, the organelles were divided into 3 categories, spherical (0.2-1 μm), rod shaped (1-5 μm), and tubular organelles (5-15 μm) (Owens et al. 2015). At physiological state about 30% of mitochondria are spherical, 67% rod shape, and 3% tubular (Figure 1C). One hour after NMN administration there is a significant decrease of the spherical population from 30 to 25% (t34=2.166; p=0.037) and a corresponding increase in the number of the rod shape mitochondria by about 5% to 72% of the total population (Figure 1C) (t34=−2.889; p=0.007). Thus, NMN treatment leads to a dynamic state of less fragmented neuronal mitochondria. To reveal how NMN can alter the mitochondrial dynamics, we first determined the changes in mitochondrial fusion and fission regulatory protein levels. The proteolytic cleavage of inner membrane fusion protein OPA1 was not altered (F(2,9)=3.923; n=12; p=0.060; Figure 2A). Similarly, levels of fusion proteins that regulate outer membrane fusion, MFN2 (F(2,9)=2.100; n=12; p=0.178), and MFN1 (F(2,9))=13.286; n=12; p=0.002) did not change significantly from vehicle group up to 24 hours after NMN injection (Figure 2B-C). However, there was a 60% decrease in levels of the active form of fission protein, phosphorylated Drp1 (S616) (pDrp1), in the hippocampal mitochondria from 15 min to 4 hours post NMN treatment (Figure 2D) (F(5,18)=7.939; n=24; p=<0.001). This reduction of mitochondrial pDrp1 was also confirmed by immunostaining brain sections from mito-eYFP animals with pDrp1 (S616) antibody (Fig 2E). At 1 hour after NMN administration there was a 35% decrease in pDrp1 (S616) colocalization with mitochondrial eYFP in the hippocampal CA1 neurons (Figure 2E) (t30=8.409; p=<0.001).
Figure 1.

NMN administration leads to decrease in neuronal mitochondria fragmentation. Transgenic mice with neuron-specific expression of mitochondria targeted enhanced yellow fluorescence protein (mito-eYFP) were perfusion-fixed after intraperitoneal (i.p.) injection of vehicle or NMN. (A) Overview of hippocampal mitochondria in neurons (green). Red represents immunostaining with NeuN antibody. Mitochondria were visualized and measured in the hippocampal CA1 oriens (white square). Scale bar represents 160 μm. (B) Mitochondria in neuronal processes 1 hour after i.p. injection of vehicle (PBS) or NMN (62.5mg/kg). Mitochondria in NMN treated brain section appeared elongated when compared to vehicle. Scale bar represents 100 μm. (C) Quantification of mitochondrial fragmentation. Mitochondria were divided into 3 populations based on their length. Spherical 0.2-1 μm, rode shape 1-5 μm, and tubular 5-15 μm. Following recording of z-stack images by confocal microscope the data were processed and analyzed by Volocity software. The graphical presentation of individual mitochondrial subpopulations shows that at 1 hour after NMN administration the relative number of short, spherical mitochondria significantly decreased and the number of longer, rod shape mitochondria increased when compared to vehicle treated animals. *p<0.05, **p<0.01 compared to vehicle (n=35 (C)) (Student T-test).
Figure 2.

NMN-induced changes in mitochondrial fusion and fission protein levels. NMN administration did not significantly affect OPA1 (A), MFN2 (B), or MFN1 (C) protein levels in hippocampal tissue. (D) However, the mitochondrial pDrp1 (S616) levels show a significant reduction from 15 min to 4 hours after NMN administration. At 24 and 48 hours the pDrp1 (S616) levels returned to control values. (E) Brain sections from the mito-eYFP (neuronal mitochondria-green) mice treated with NMN or vehicle (PBS) were immunostained with pDrp1 (S616) antibody (red). Z-stack images were collected and colocalization of pDrp1 (S616) with mito-eYFP in the CA1 oriens was quantified using Volocity software. NMN decreased colocalization of pDrp1 (S616) with mitochondrial eYFP as determined by the Pearson colocalization coefficient. Scale bar represents 100 μm. *p<0.05, **p<0.01, ***p<0.001 compared to vehicle (n=12 (A-C), n=24 (D), n=31 (E)) ((A-D) One-way ANOVA followed by Tukey HSD test, (E) Student T-test).
3.2. NMN, NAD+, ATP, NR metabolite levels after NMN administration
To gain further insight into mechanisms of NMN action, we assessed and characterized plasma and brain tissue NAD+ metabolism after NMN administration. NMN injection resulted in an increase in plasma NMN levels to 1.67 nmol/mg (F(2,8)=10.563; n=11; p=0.006) at 5 min post-treatment, which then returned to baseline (1.33 nmol/mg) at 15 min (Figure 3A). Thus, after 15 min NMN is either converted into NAD+ in the plasma or transported from blood into the brain tissue. Therefore, we also determined the plasma NAD+ levels. At 15 min and 1 hour after NMN injection plasma NAD+ levels were significantly increased from 1.1 nmol/mg up to 5.5 nmol/mg (F(5,20)=37.667; n=26; p=<0.001; 1 hour post-injection) and normalized by 24 hours (Figure 3B). In hippocampal tissue, NAD+ levels were elevated from 2.55 nmol/mg to 3.68 nmol/mg (F(4,25)=8.030; n=30; p=<0.001) at 15 min after NMN administration and then gradually normalized by 24 hours post-treatment (Figure 3C). On the other hand, hippocampal mitochondrial NAD+ levels significantly increase by from 3.12 nmol/mg to 5.51 nmol/mg at 15 min and remained elevated up to 24 hours after the NMN administration (Figure 3D) (F(4,15)=19.118; n=20; p=<0.001). Increased mitochondrial NAD+ content resulted in elevated hippocampal ATP pools from 24.2 nmol/mg to 32.2 nmol/mg at 1 hour and to 33.7 nmol/mg at 24 hours, suggesting that NMN administration stimulates mitochondrial bioenergetic metabolism (Figure 3E) (F(3,18)=6.051; n=22; p=0.005). Since it has been suggested that following administration, NMN is first converted to NR and then transported into cells (Trammell et al. 2016), we decided to determine the changes in hippocampal tissue NR levels. Figure 3F shows that there was a transient increase in NR from 31.8 nmol/mg to 50.8 nmol/mg (F(4,20)=22.052; n=25; p=<0.001) at 15 min after NMN treatment. This increase was followed by gradual return to control levels.
Figure 3.

NMN administration leads to increase in plasma and hippocampal tissue NAD+, NMN, NR, and ATP levels. (A) Plasma NMN levels increased at 5 min after NMN injection and normalized to vehicle by 15 min. (B) There was a significant increase in plasma NAD+ levels, at 15 min and at 1 hour after NMN treatment. Twenty-four hours following NMN injection the NAD+ levels returned to vehicle. (C) Hippocampal tissue NAD+significantly increased also already at 15 min after NMN administration but afterwards begin to decline back to physiological levels. (D) In isolated hippocampal mitochondrial, NAD+ increased by 76% from 15 min to 24 hours following NMN injection. (E) Hippocampal tissue showed an increase in ATP levels at 1 hour that was sustained up to 24 hours after NMN administration. (F) Levels of NAD+ precursor, NR, increased by 60% at 15 min NMN post-injection in hippocampal tissue suggesting that at least part of NMN is metabolized into NR. * p<0.05, ** p<0.01, *** p<0.001 compared to vehicle (n=11 (A), n=26 (B), n=30 (C), n=20 (D), n=22 (E), n=25 (F)) (One-way ANOVA followed by Tukey HSD test).
3.3. SIRT3 is required for NMN induced decrease in mitochondrial protein acetylation
Mitochondrial metabolism and function is highly regulated by protein acetylation (Baeza et al. 2016). SIRT3 is the major mitochondrial NAD+-dependent deacetylase. Another mitochondrial sirtuin, Sirtuin 5 (SIRT5) is also a NAD+-dependent deacetylase, however the deacetylase activity of SIRT5 is negligible (Klimova et al. 2018; Parodi-Rullan et al. 2018, Anderson and Hirschey 2012, Hirschey et al. 2011a). Since we show that NMN administration increases mitochondrial NAD+ content we hypothesized that global mitochondrial protein acetylation could be altered. Figure 4 (A, B) shows that NMN reduces mitochondrial global protein acetylation by about 40% at 15 min, 1, 4, and 24 hours post-injection (F(5,26)=18.544; n=32; p=<0.001). The proteins that show the most significant decrease in acetylation are in the range of 20 to 75 kDa (Figure 4A). Furthermore, NMN induced increase in mitochondrial SIRT3 (F(2,13)=34.321; n=16; p=<0.001) and SIRT5 (F(2,12)=21.089; n=15; p=<0.001) protein levels that probably also contributed to reduction in acetylation of mitochondrial proteins (Figure 4C-D). Interestingly, 48 hours after NMN treatment the mitochondrial acetylation levels were not only reversed but increased by 68% when compared to vehicle treated animals (Figure 4B). Since increased acetylation can be a result of higher acetyltransferase activity, we examined the changes in expression level of mitochondrial acetyltransferase GCN5L1. As figure 4E shows the mitochondrial GCN5L1 levels were increased 3-fold 48 hours after NMN administration (Figure 4E) (t6=−5.795; p=0.001).
Figure 4.

NMN causes decrease in hippocampal mitochondria protein acetylation. (A) Western blot of hippocampal mitochondria samples that were collected after vehicle or NMN (62.5 mg/kg) administration at 15 min, 1, 4, 24, and 48 hours post-treatment. (B) Quantification of changes in mitochondrial protein acetylation NMN induced reduced acetylation of mitochondrial proteins at 15 min post-treatment. However, at 48 hours post-administration mitochondrial acetylation significantly increased when compared to vehicle treated animals. There was an increase in protein levels of mitochondrial deacetylases, SIRT3 (C) and SIRT5 (D) at 24 HR following NMN injection. However, the mitochondrial acetyltransferase, GCN5L1, expression levels were elevated 48 hours following NMN administration (E). * p<0.05, ** p<0.01 compared to vehicle (n=32 (B), n=16 (C), n=15 (D), n=7 (E)) (B One-way ANOVA followed by Tukey HSD test, C-E Student T-test).
To confirm that NMN is altering the mitochondrial proteins acetylation by modulating SIRT3 activity we decided to determine the acetylation changes of the direct, well-characterized SIRT3 target, mitochondrial superoxide dismutase 2 (SOD2) (Cheng et al. 2016). Immunoprecipitation of acetyl-SOD2 after 1 hour of NMN administration showed a 30% decrease in SOD2 acetylation when compared to samples from vehicle injected animals (Figure 5A) (t6=2.680; p=0.036). To ensure the SIRT3 activity is required for the NMN-induced effect, we used a SIRT3KO mouse model. Mitochondrial protein acetylation from SIRT3KO mice showed about 3-fold increase of protein acetylation when compared to their wild-type counterpart (Figure 5B) (F(2,9)=43.811; n=12; p=<0.001). Furthermore, the NMN mediated decrease in mitochondrial protein acetylation was eliminated when examined in SIRT3KO animals (Figure 5B). These data thus suggest that SIRT3 is a major mitochondrial deacetylase and is required for the NMN-induced decrease of mitochondrial protein acetylation.
Figure 5.

SIRT3 is required for NMN induced decrease in mitochondrial protein acetylation. Hippocampal tissue was isolated from NMN (62.5 mg/kg) or vehicle (PBS) treated animals. SIRT3 target, SOD2, was immunoprecipitated from hippocampal tissue samples and acetylation levels were analyzed by western blot. (A) NMN induced a 30% decrease in acetylation of SOD2 compared to vehicle treated animals. (B) In samples from SIRT3KO mice NMN did not affect mitochondrial protein acetylation. *p<0.05, ***p<0.001 compared to vehicle (n=7 (A), n=12 (B)) (A Student T-test, B One-way ANOVA followed by Tukey HSD test)
3.4. NMN stimulates decline of ROS in the hippocampus
SIRT3 dependent SOD2 deacetylation plays a protective role against oxidative stress in the mitochondria since the activity of SOD2 is increased by deacetylation (Ren et al. 2017, Zheng et al. 2018, Liu et al. 2017). Therefore, we examined whether NMN dependent changes in acetyl-SOD2 altered reactive oxygen species (ROS) levels in the mouse brain. We used in vivo superoxide indicator dihydroethidium (DHE) to determine the changes in hippocampal ROS levels. DHE upon reaction with superoxide anions forms a red fluorescent ethidium (Murakami et al. 1998, Suh et al. 2008). Interestingly, ROS levels at a physiological state exhibited regional differences between the individual sectors of the hippocampus. The CA1 displayed the strongest signal, the CA3 sub-region showed 15% reduction, and in DG the ROS levels were about 46% lower when compared to CA1 (F(2,69)=79.940; n=75, p=<0.001; Two way ANOVA interaction F(2,69)=2.025; p=0.140) (Figure 6B). Administration of NMN reduced the ethidium signal by about 23% in all hippocampal subregions when compared to vehicle (Figure 6A-B) (F(1,69)=52.680; n=75, p=<0.001). Thus, the NMN administration did not alter the regional differences (Figure 6B). To confirm that the changes in NMN-induced ROS levels were dependent on SIRT3 activity we repeated the experiments with SIRT3KO animals. Both vehicle and NMN treated SIRT3KO mice showed an significant increased fluorescence signal when compared to vehicle treated wild-type animals, however NMN injected SIRT3KO animals were not different from vehicle treated ones (Figure 6C-D) (F(2,23)=4.815; n=26; p=0.020). Thus, ROS levels in the CA1 did not changed in SIRT3KO mice after NMN administration (Figure 6C-D).
Figure 6.

NMN administration reduces hippocampal ROS levels. Dihydroethidium (DHE) was injected simultaneously with NMN or vehicle (PBS) to monitor ROS levels in hippocampal CA1, CA3, or DG regions in WT and SIRT3KO mice. Z-stack images were collected and ethidium is represented in red while cell nuclei are stained with Hoechst (blue). Scale bars represent 100 μm (A, C). Fluorescence intensity was normalized to unit volume and graphically represented (B, D). ROS levels decreased with NMN administration by 20-25%. Additionally, ROS levels exhibited regional differences between individual hippocampal sub-regions, CA1 exhibiting the highest levels and DG the least (A-B). SIRT3KO mice exhibited a 12% increase in hippocampal CA1 ROS levels when compared to WT mice and the ROS remained elevated in SIRT3KO animals with NMN administration (C-D). *p<0.05, ***p<0.001 compared to vehicle, ## p<0.01, ### p<0.001 compared to CA1, ♦♦♦ p<0.001 compared to CA3, ^^^ p<0.001 compared to DG (n=75 (B), n=26 (D)) (B Two-way ANOVA followed by Tukey HSD test, D One-way ANOVA followed by Tukey HSD test)
3.5. SIRT3KO pDrp1 (S616) mediated mitochondrial fragmentation
Evidence suggests that mitochondrial morphology is tightly coupled to ROS generation depending on the physiological state of the cell (Yu et al. 2006). Accumulation of ROS results in a shift to a more fragmented population of mitochondria (Willems et al. 2015, Kim et al. 2018). We showed that NMN is decreasing SOD2 acetylation via SIRT3, which leads to reduced hippocampal ROS levels. Since SIRT3KO animals showed higher ROS levels when compared to wild-type mice we decided to examine whether this increase in free radicals affects mitochondrial dynamics in SIRT3KO brains. There was a clear shift to more fragmented mitochondria in the hippocampal CA1 sub-region of SIRT3KO animals when compared to wild-type (Figure 7A). The spherical (0.2-1 μm) mitochondrial population increased from 30 to 38% (t26=−3.183; p=0.003) while the rod shaped (1-5 μm) decreased from 67 to 61% (t30=2.108; p=0.04) and tubular population (5-15 μm) decreased from 4 to 1% (t26=4.406; p=<0.001) (Figure 7 A). Next, we examine whether the SIRT3KO mice exhibit changes in the fission activating protein pDrp1 (S616). As figure 7B shows, the shift in mitochondrial fusion/fission is likely mediated by increased mitochondrial pDrp1 (S616) levels. SIRT3KO animals show an increased colocalization of fission protein pDrp1 (S616) with the mito-eYFP protein (Figure 7B) (t30=−2.315; p=0.027).
Figure 7.

pDrp1 (S616) shows increased colocalization with neuronal mitochondria leading to more fragmented organelles in SIRT3KO mice. Z-stack images from hippocampal CA1 oriens of mito-eYFP and mito-eYFP-SIRT3KO brain sections were collected and analyzed using Volocity software. (A) The fragmented mitochondrial population (0.2-1 μm) increased by 27% when compared to vehicle treated animals, while the rod shape (1-5 μm) and tubular (5-15 μm) population decreased 8% and 74%, respectively. Mito-eYFP and mito-eYFP-SIRT3KO brain sections were stained with pDrp1 (S616) (red) and colocalization between pDrp1 (S616) and eYFP analyzed using Volocity software. SIRT3KO samples show an increase in colocalization of pDrp1 (S616) and mito-eYFP (green) resulting in increased fragmentation (B). Scale bars represent 100 μm. *p<0.05, **p<0.01, ***p<0.001 compared to mito-eYFP (n=27 (A), n=31 (B)) (A Student T-test, B One-way ANOVA followed by Tukey HSD test)
4. Discussion
We show here that a single dose of NAD+ precursor, NMN, alters mitochondrial dynamics in the brain by reducing fragmentation of neuronal mitochondria. We reported similar findings after chronic treatment of animals with NMN, injecting 100 mg/kg, every other day for 28 days (Long et al. 2015). Several previous studies also used repeated dosages of NMN from 300 to 1,000 mg/kg over days or weeks with beneficial outcomes in animal models of diabetes mellitus, obesity, aging, stoke, or heart dysfunction (for review see Yoshino et al. 2018). Interestingly, we found that a much lower dose, about 60 mg/kg, administered once provided significant neuroprotection against brain damage induced by global cerebral ischemia (Park et al. 2016).
Mitochondrial dynamics is regulated by fusion and fission proteins (Anne Stetler et al. 2013, Klimova et al. 2018). Division of mitochondria into smaller organelles is facilitated by fission protein Drp1 that is recruited to the mitochondrial outer membrane from the cytosol upon phosphorylation at serine 616 (pDrp1 (S616)) (Kraus and Ryan 2017). Correspondingly, purified mitochondria from the mouse hippocampus after NMN administration showed a reduction in pDrp1 (S616) levels, which supports the observed shift in mitochondrial morphology towards the increased population of longer organelles. Mitochondrial fusion is controlled by outer membrane localized fusion proteins MFN1, MFN2, and inner membrane fusion protein OPA1. The fusion proteins expression levels remained unchanged after NMN treatment, comparably to our chronic administration study (Long et al. 2015).
Intraperitoneal injection (i.p.) of NMN was followed by rapid and transient increase in plasma NMN levels at 5 minutes, which then normalized 15 minutes after the injection. Interestingly, similar plasma NMN pharmacokinetics were reported following oral gavage administration of NMN at a dose of 300 mg/kg (Mills et al. 2016). However, one hour after oral gavage the NAD+ levels in plasma, or cortex did not increase significantly. Only the long-term administration protocol resulted in significant increase in NAD+ pools (Mills et al. 2016). We observed a significant increase in plasma, hippocampal tissue, and mitochondrial NAD+ already at 15 minutes following i.p. injection.
Injection of NMN leads to significant increase of plasma Nam, suggesting a partial conversion of NMN to Nam (Ratajczak et al. 2016). This process is facilitated by ectoenzyme CD38 that can consume NMN while generating cyclic-ADP-ribose and Nam (Sauve et al. 1998, Grozio et al. 2013). The Nam then can be converted back to NAD+ via the salvage pathway (Sauve 2008).
Our data also shows elevated NR levels in hippocampal tissue at 15 minutes after NMN administration suggesting that at least partly NMN is converted to NR. However, plasma NR levels were not affected by NMN administration (Ratajczak et al. 2016). Although, this may be due to the fact that the plasma samples in Ratajczak et al. study were collected at 1 hour post administration when in our hands the plasma NMN was already normalized. Thus, the NMN in vivo pharmacokinetics and its conversion to NAD+ is a complex process that is so far poorly understood. The data however suggests that NMN is rapidly absorbed from the gut into the blood (see also Mills et al. 2016), and then transported into the brain tissue where it is converted into NAD+.
A single dose of about 60 mg/kg of NMN administration increased mitochondrial NAD+ levels by 76% for up to 24 hours, suggesting a prolonged lasting effect of NMN treatment on mitochondrial NAD+ metabolism and functions.
The NMN-induced increase in mitochondrial NAD+ levels was accompanied by concomitant deacetylation of mitochondrial proteins. The mitochondrial protein acetylation is controlled by mitochondrial acetyltransferase GCN5L1 and NAD+-dependent deacetylase SIRT3 (Scott et al. 2012, Parodi-Rullan et al. 2018), although a non-enzymatic acetylation can also contribute to this post-translational lysine modification (Hosp et al. 2017). Data obtained from SIRT3KO animals confirmed that the NMN-induced deacetylation requires SIRT3 activity. Furthermore, our data suggests that the hyperacetylation of mitochondrial proteins 48 hours after the NMN injection was at least in part due to the overexpression of mitochondrial acetyltrasnferase GCN5L1. The changes in mitochondrial SIRT3, SIRT5, and GCN5L1 expression levels probably reflect NMN-induced modulation of gene expression at the nuclear level. For example, previous studies reported that NMN alters PGC-1α transcript levels of which SIRT3 is a downstream target (Uddin et al. 2017, Giralt et al. 2011).
There are several mitochondrial proteins that are modified by acetylation via SIRT3 activity (Parodi-Rullan et al. 2018, Hirschey et al. 2011b, Lombard et al 2007, Sol et al. 2012). One of the SIRT3 targets is mitochondrial SOD2, which is an important antioxidant enzyme. SOD2 catalyzes the detoxification of superoxide into oxygen and hydrogen peroxide, which is then converted to water by glutathione peroxidase. Acetylation of SOD2 decreases its activity (Chen et al. 2011). Here, we show that NMN administration, by increasing mitochondrial NAD+ level, mediates SIRT3 dependent deacetylation of SOD2 that can contribute to lower superoxide levels in hippocampal tissue.
The significant role of SIRT3 activity in ROS detoxification was shown in studies with oxygen and glucose deprivation-induced neuronal damage (Dai et al 2017), oxidative stress in type I diabetic model (Liu et al. 2017), heart ischemia-induced damage (Parodi-Rullan et al. 2017), intracerebral hemorrhage in diabetic animals (Zheng et al. 2018) or protective mechanisms in adaptive responses of neurons to physiological challenges and resistance to degeneration (Cheng et al. 2016). Our data shows that SIRT3KO mice exhibit increased ROS levels when compared to WT animals with no change after NMN administration. However, in WT mice expressing SIRT3, NMN administration reduced acetylation of SOD2 and resulted in lower ROS levels throughout the hippocampus. Interestingly, baseline ROS levels between the CA1, CA3, and DG are different, with highest in the CA1 sub-region and lowest in DG. This may contribute to selective vulnerability of CA1 pyramidal neurons to pathologic conditions (Smith et al. 1984, Ouyang et al. 2007).
Mitochondrial dynamics and ROS production are intrinsically linked. The fragmented mitochondrial phenotype is observed with mitochondrial ROS overproduction (Huang et al. 2016, Jezek et al. 2018). Recent studies have shown that blocking or inhibiting Drp1 in ROS-mediated oxidative stress improved mitochondrial function and decreased fragmentation (Gan et al. 2015, Zhang et al. 2017). In our mito-eYFP-SIRT3KO model that displays elevated ROS levels we observed more fragmented mitochondria, which was driven by the recruitment of pDrp1 (S616). These results suggest that mitochondrial morphology correlates to mitochondrial ROS production status. Thus, one of the possible protective mechanism of NMN administration is the decreased mitochondrial ROS production via SIRT3 mediated deacetylation and associated increase in activity of SOD2. As a result of mitochondrial protein deacetylation, mitochondrial fission is less active due to the reduced association of pDrp1 (S616) with mitochondria.
In this study we show for the first time a novel link between NAD+ metabolism and mitochondrial dynamics. We examine the effects of NAD+ precursor, NMN, in naive mice to gain understanding of its potential protective mechanism observed in post-ischemic brain injury. NMN administration increases mitochondrial NAD+ pools and drives the reduction of hippocampal ROS via a SIRT3 driven deacetylation of SOD2 and other mitochondrial proteins. As a result, mitochondrial fragmentation is reduced via a pDrp1 (S616) dependent mechanism. Since there are several kinases that can phosphorylate Drp1 (Klimova et al. 2018), future studies are required to identify the possible metabolic pathway the involves kinases responsible for acetylation-dependent or ROS-driven Drp1 phosphorylation and recruitment to mitochondria. In conclusion, we report here that manipulation of mitochondrial NAD+ levels simply by supplying animals with NAD+ precursor can stimulate protective mechanisms that could help cells cope with bioenergetic stress conditions.
Significance Statement.
Nicotinamide adenine dinucleotide (NAD+) is a central signaling molecule and enzyme cofactor that is involved in a variety of fundamental biological processes. NAD+ levels decline with age, and under pathologic conditions such as neurodegenerative diseases, acute brain injury, obesity and diabetes. As a result, cellular and mitochondrial bioenergetic functions are compromised. Administration of NAD+ precursor, nicotinamide mononucleotide (NMN) increases mitochondrial NAD+ levels and improves mitochondrial functions by stimulating antioxidant defense mechanisms leading to reduced levels of toxic reactive oxygen species. Thus, replenishing or elevating NAD+ levels offers a protective therapeutic approach for cellular pathophysiological conditions.
Acknowledgements
This work was supported by US Veterans Affairs Merit grant BX000917 to TK. We would like to thank Dr. Michael Sack at NIH for kindly providing GCN5L1 antibody.
Footnotes
Conflict of Interest
Nina Klimova, Aaron Long, and Tibor Kristian declare no conflict of interest.
Data Accessibility
Data can be available via email upon request.
References
- Ahn BH, Kim HS, Song S, Lee IH, Liu J, Vassilopoulos A, Deng CX, Finkel T. 2008. A role for the mitochondrial deacetylase Sirt3 in regulating energy homeostasis. Proc Natl Acad Sci U S A 105(38):14447–14452. [DOI] [PMC free article] [PubMed] [Google Scholar]
- Anderson KA, Hirschey MD. 2012. Mitochondrial protein acetylation regulates metabolism. Essays in biochemistry 52:23–35. [DOI] [PMC free article] [PubMed] [Google Scholar]
- Anne Stetler R, Leak RK, Gao Y, Chen J. 2013. The dynamics of the mitochondrial organelle as a potential therapeutic target. J Cereb Blood Flow Metab 33(1):22–32. [DOI] [PMC free article] [PubMed] [Google Scholar]
- Baeza J, Smallegan MJ, Denu JM. 2016. Mechanisms and Dynamics of Protein Acetylation in Mitochondria. Trends Biochem Sci 41(3):231–244. [DOI] [PMC free article] [PubMed] [Google Scholar]
- Belenky P, Bogan KL, Brenner C. 2007. NAD+ metabolism in health and disease. Trends Biochem Sci 32(1):12–19. [DOI] [PubMed] [Google Scholar]
- Belenky P, Christensen KC, Gazzaniga F, Pletnev AA, Brenner C. 2009. Nicotinamide riboside and nicotinic acid riboside salvage in fungi and mammals. Quantitative basis for Urh1 and purine nucleoside phosphorylase function in NAD+ metabolism. J Biol Chem 284(1):158–164. [DOI] [PMC free article] [PubMed] [Google Scholar]
- Brennan AM, Connor JA, Shuttleworth CW. 2006. NAD(P)H fluorescence transients after synaptic activity in brain slices: predominant role of mitochondrial function. J Cereb Blood Flow Metab 26(11):1389–1406. [DOI] [PubMed] [Google Scholar]
- Broetto-Biazon AC, Bracht F, Bracht L, Kelmer-Bracht AM, Bracht A. 2009. Transformation and action of extracellular NAD+ in perfused rat and mouse livers. Acta Pharmacol Sin 30(1):90–97. [DOI] [PMC free article] [PubMed] [Google Scholar]
- Buhlman L, Damiano M, Bertolin G, Ferrando-Miguel R, Lombes A, Brice A, Corti O. 2014. Functional interplay between Parkin and Drp1 in mitochondrial fission and clearance. Biochim Biophys Acta 1843(9):2012–2026. [DOI] [PubMed] [Google Scholar]
- Chandrasekaran K, Hazelton JL, Wang Y, Fiskum G, Kristian T. 2006. Neuron-specific conditional expression of a mitochondrially targeted fluorescent protein in mice. J Neurosci 26(51):13123–13127. [DOI] [PMC free article] [PubMed] [Google Scholar]
- Chang CR, Blackstone C. 2010. Dynamic regulation of mitochondrial fission through modification of the dynamin-related protein Drp1. Annals of the New York Academy of Sciences 1201:34–39. [DOI] [PMC free article] [PubMed] [Google Scholar]
- Chen H, Chan DC. 2009. Mitochondrial dynamics--fusion, fission, movement, and mitophagy--in neurodegenerative diseases. Human molecular genetics 18(R2):R169–176. [DOI] [PMC free article] [PubMed] [Google Scholar]
- Chen Y, Zhang J, Lin Y, Lei Q, Guan KL, Zhao S, Xiong Y. 2011. Tumour suppressor SIRT3 deacetylates and activates manganese superoxide dismutase to scavenge ROS. EMBO reports 12(6):534–541. [DOI] [PMC free article] [PubMed] [Google Scholar]
- Cheng A, Yang Y, Zhou Y, Maharana C, Lu D, Peng W, Liu Y, Wan R, Marosi K, Misiak M, Bohr VA, Mattson MP. 2016. Mitochondrial SIRT3 Mediates Adaptive Responses of Neurons to Exercise and Metabolic and Excitatory Challenges. Cell metabolism 23(1):128–142. [DOI] [PMC free article] [PubMed] [Google Scholar]
- Dai SH, Chen T, Li X, Yue KY, Luo P, Yang LK, Zhu J, Wang YH, Fei Z, Jiang XF. 2017. Sirt3 confers protection against neuronal ischemia by inducing autophagy: Involvement of the AMPK-mTOR pathway. Free Radic Biol Med 108:345–353. [DOI] [PubMed] [Google Scholar]
- de Picciotto NE, Gano LB, Johnson LC, Martens CR, Sindler AL, Mills KF, Imai S, Seals DR. 2016. Nicotinamide mononucleotide supplementation reverses vascular dysfunction and oxidative stress with aging in mice. Aging Cell 15(3):522–530. [DOI] [PMC free article] [PubMed] [Google Scholar]
- Gan X, Huang S, Yu Q, Yu H, Yan SS. 2015. Blockade of Drp1 rescues oxidative stress-induced osteoblast dysfunction. Biochem Biophys Res Commun 468(4):719–725. [DOI] [PMC free article] [PubMed] [Google Scholar]
- Giralt A, Hondares E, Villena JA, Ribas F, Diaz-Delfin J, Giralt M, Iglesias R, Villarroya F. 2011. Peroxisome proliferator-activated receptor-gamma coactivator-1alpha controls transcription of the Sirt3 gene, an essential component of the thermogenic brown adipocyte phenotype. J Biol Chem 286(19):16958–16966. [DOI] [PMC free article] [PubMed] [Google Scholar]
- Grozio A, Sociali G, Sturla L, Caffa I, Soncini D, Salis A, Raffaelli N, De Flora A, Nencioni A, Bruzzone S. 2013. CD73 protein as a source of extracellular precursors for sustained NAD+ biosynthesis in FK866-treated tumor cells. J Biol Chem 288(36):25938–25949. [DOI] [PMC free article] [PubMed] [Google Scholar]
- Han XJ, Lu YF, Li SA, Kaitsuka T, Sato Y, Tomizawa K, Nairn AC, Takei K, Matsui H, Matsushita M. 2008. CaM kinase I alpha-induced phosphorylation of Drp1 regulates mitochondrial morphology. J Cell Biol 182(3):573–585. [DOI] [PMC free article] [PubMed] [Google Scholar]
- Hirschey MD, Shimazu T, Huang JY, Schwer B, Verdin E. 2011a. SIRT3 regulates mitochondrial protein acetylation and intermediary metabolism. Cold Spring Harbor symposia on quantitative biology 76:267–277. [DOI] [PubMed] [Google Scholar]
- Hirschey MD, Shimazu T, Jing E, Grueter CA, Collins AM, Aouizerat B, Stancakova A, Goetzman E, Lam MM, Schwer B, Stevens RD, Muehlbauer MJ, Kakar S, Bass NM, Kuusisto J, Laakso M, Alt FW, Newgard CB, Farese RV Jr., Kahn CR, Verdin E. 2011b. SIRT3 deficiency and mitochondrial protein hyperacetylation accelerate the development of the metabolic syndrome. Mol Cell 44(2):177–190. [DOI] [PMC free article] [PubMed] [Google Scholar]
- Hoffman GE, Murphy KJ, Sita LV. 2016. The Importance of Titrating Antibodies for Immunocytochemical Methods Current protocols in neuroscience / editorial board, Crawley Jacqueline N [et al. ] 76:2 12 11–12 12 37. [DOI] [PMC free article] [PubMed] [Google Scholar]
- Hosp F, Lassowskat I, Santoro V, De Vleesschauwer D, Fliegner D, Redestig H, Mann M, Christian S, Hannah MA, Finkemeier I. 2017. Lysine acetylation in mitochondria: From inventory to function. Mitochondrion 33:58–71. [DOI] [PubMed] [Google Scholar]
- Hu BR, Park M, Martone ME, Fischer WH, Ellisman MH, Zivin JA. 1998. Assembly of proteins to postsynaptic densities after transient cerebral ischemia. J Neurosci 18(2):625–633. [DOI] [PMC free article] [PubMed] [Google Scholar]
- Huang Q, Zhan L, Cao H, Li J, Lyu Y, Guo X, Zhang J, Ji L, Ren T, An J, Liu B, Nie Y, Xing J. 2016. Increased mitochondrial fission promotes autophagy and hepatocellular carcinoma cell survival through the ROS-modulated coordinated regulation of the NFKB and TP53 pathways. Autophagy 12(6):999–1014. [DOI] [PMC free article] [PubMed] [Google Scholar]
- Imai S, Guarente L. 2014. NAD+ and sirtuins in aging and disease. Trends Cell Biol 24(8):464–471. [DOI] [PMC free article] [PubMed] [Google Scholar]
- Jezek J, Cooper KF, Strich R. 2018. Reactive Oxygen Species and Mitochondrial Dynamics: The Yin and Yang of Mitochondrial Dysfunction and Cancer Progression. Antioxidants 7(1). [DOI] [PMC free article] [PubMed] [Google Scholar]
- Kauppinen TM, Swanson RA. 2007. The role of poly(ADP-ribose) polymerase-1 in CNS disease. Neuroscience 145(4):1267–1272. [DOI] [PubMed] [Google Scholar]
- Kim YM, Youn SW, Sudhahar V, Das A, Chandhri R, Cuervo Grajal H, Kweon J, Leanhart S, He L, Toth PT, Kitajewski J, Rehman J, Yoon Y, Cho J, Fukai T, Ushio-Fukai M. 2018. Redox Regulation of Mitochondrial Fission Protein Drp1 by Protein Disulfide Isomerase Limits Endothelial Senescence. Cell reports 23(12):3565–3578. [DOI] [PMC free article] [PubMed] [Google Scholar]
- Klimova N, Long A, Kristian T. 2018. Significance of Mitochondrial Protein Post-translational Modifications in Pathophysiology of Brain Injury. Transl Stroke Res 9(3):223–237. [DOI] [PubMed] [Google Scholar]
- Kraus F, Ryan MT. 2017. The constriction and scission machineries involved in mitochondrial fission. Journal of cell science 130(18):2953–2960. [DOI] [PubMed] [Google Scholar]
- Kristian T 2010. Isolation of mitochondria from the CNS Current protocols in neuroscience / editorial board, Crawley Jacqueline N [et al. ] Chapter 7:Unit 7 22. [DOI] [PMC free article] [PubMed] [Google Scholar]
- Kristian T, Fiskum G. 2004. A fluorescence-based technique for screening compounds that protect against damage to brain mitochondria. Brain Res Brain Res Protoc 13(3):176–182. [DOI] [PubMed] [Google Scholar]
- Kristian T, Gertsch J, Bates TE, Siesjo BK. 2000. Characteristics of the calcium-triggered mitochondrial permeability transition in nonsynaptic brain mitochondria: effect of cyclosporin A and ubiquinone O. J Neurochem 74(5):1999–2009. [DOI] [PubMed] [Google Scholar]
- Lawson M, Uciechowska U, Schemies J, Rumpf T, Jung M, Sippl W. 2010. Inhibitors to understand molecular mechanisms of NAD(+)-dependent deacetylases (sirtuins). Biochim Biophys Acta 1799(10–12):726–739. [DOI] [PubMed] [Google Scholar]
- Liu D, Gharavi R, Pitta M, Gleichmann M, Mattson MP. 2009. Nicotinamide prevents NAD+ depletion and protects neurons against excitotoxicity and cerebral ischemia: NAD+ consumption by SIRT1 may endanger energetically compromised neurons. Neuromolecular medicine 11(1):28–42. [DOI] [PMC free article] [PubMed] [Google Scholar]
- Liu D, Pitta M, Jiang H, Lee JH, Zhang G, Chen X, Kawamoto EM, Mattson MP. 2013. Nicotinamide forestalls pathology and cognitive decline in Alzheimer mice: evidence for improved neuronal bioenergetics and autophagy procession. Neurobiol Aging 34(6):1564–1580. [DOI] [PMC free article] [PubMed] [Google Scholar]
- Liu W, Tian F, Kurata T, Morimoto N, Abe K. 2012. Dynamic changes of mitochondrial fusion and fission proteins after transient cerebral ischemia in mice. J Neurosci Res 90(6):1183–1189. [DOI] [PubMed] [Google Scholar]
- Liu X, Zhang L, Wang P, Li X, Qiu D, Li L, Zhang J, Hou X, Han L, Ge J, Li M, Gu L, Wang Q. 2017. Sirt3-dependent deacetylation of SOD2 plays a protective role against oxidative stress in oocytes from diabetic mice. Cell Cycle 16(13):1302–1308. [DOI] [PMC free article] [PubMed] [Google Scholar]
- Lo EH, Bosque-Hamilton P, Meng W. 1998. Inhibition of poly(ADP-ribose) polymerase: reduction of ischemic injury and attenuation of N-methyl-D-aspartate-induced neurotransmitter dysregulation. Stroke 29(4):830–836. [DOI] [PubMed] [Google Scholar]
- Lombard DB, Alt FW, Cheng HL, Bunkenborg J, Streeper RS, Mostoslavsky R, Kim J, Yancopoulos G, Valenzuela D, Murphy A, Yang Y, Chen Y, Hirschey MD, Bronson RT, Haigis M, Guarente LP, Farese RV Jr., Weissman S, Verdin E, Schwer B. 2007. Mammalian Sir2 homolog SIRT3 regulates global mitochondrial lysine acetylation. Molecular and cellular biology 27(24):8807–8814. [DOI] [PMC free article] [PubMed] [Google Scholar]
- Long A, Park JH, Klimova N, Fowler C, Loane DJ, Kristian T. 2017. CD38 Knockout Mice Show Significant Protection Against Ischemic Brain Damage Despite High Level Poly-ADP-Ribosylation. Neurochem Res 42(1):283–293. [DOI] [PMC free article] [PubMed] [Google Scholar]
- Long AN, Owens K, Schlappal AE, Kristian T, Fishman PS, Schuh RA. 2015. Effect of nicotinamide mononucleotide on brain mitochondrial respiratory deficits in an Alzheimer's disease-relevant murine model. BMC Neurol 15:19. [DOI] [PMC free article] [PubMed] [Google Scholar]
- Lu L, Tang L, Wei W, Hong Y, Chen H, Ying W, Chen S. 2014. Nicotinamide mononucleotide improves energy activity and survival rate in an in vitro model of Parkinson's disease. Exp Ther Med 8(3):943–950. [DOI] [PMC free article] [PubMed] [Google Scholar]
- Martire S, Mosca L, d'Erme M. 2015. PARP-1 involvement in neurodegeneration: A focus on Alzheimer's and Parkinson's diseases. Mech Ageing Dev 146-148:53–64. [DOI] [PubMed] [Google Scholar]
- Mills KF, Yoshida S, Stein LR, Grozio A, Kubota S, Sasaki Y, Redpath P, Migaud ME, Apte RS, Uchida K, Yoshino J, Imai SI. 2016. Long-Term Administration of Nicotinamide Mononucleotide Mitigates Age-Associated Physiological Decline in Mice. Cell metabolism 24(6):795–806. [DOI] [PMC free article] [PubMed] [Google Scholar]
- Murakami K, Kondo T, Kawase M, Li Y, Sato S, Chen SF, Chan PH. 1998. Mitochondrial susceptibility to oxidative stress exacerbates cerebral infarction that follows permanent focal cerebral ischemia in mutant mice with manganese superoxide dismutase deficiency. J Neurosci 18(1):205–213. [DOI] [PMC free article] [PubMed] [Google Scholar]
- Ni HM, Williams JA, Ding WX. 2015. Mitochondrial dynamics and mitochondrial quality control. Redox biology 4:6–13. [DOI] [PMC free article] [PubMed] [Google Scholar]
- Nikiforov A, Dolle C, Niere M, Ziegler M. 2011. Pathways and subcellular compartmentation of NAD biosynthesis in human cells: from entry of extracellular precursors to mitochondrial NAD generation. J Biol Chem 286(24):21767–21778. [DOI] [PMC free article] [PubMed] [Google Scholar]
- Ouyang YB, Voloboueva LA, Xu LJ, Giffard RG. 2007. Selective dysfunction of hippocampal CA1 astrocytes contributes to delayed neuronal damage after transient forebrain ischemia. J Neurosci 27(16):4253–4260. [DOI] [PMC free article] [PubMed] [Google Scholar]
- Owens K, Park JH, Gourley S, Jones H, Kristian T. 2015. Mitochondrial dynamics: cell-type and hippocampal region specific changes following global cerebral ischemia. J Bioenerg Biomembr 47(1-2): 13–31. [DOI] [PubMed] [Google Scholar]
- Owens K, Park JH, Schuh R, Kristian T. 2013. Mitochondrial Dysfunction and NAD+ Metabolism Alterations in the Pathophysiology of Acute Brain Injury. Transl Stroke Res 4:618–634. [DOI] [PubMed] [Google Scholar]
- Park JH, Long A, Owens K, Kristian T. 2016. Nicotinamide mononucleotide inhibits post-ischemic NAD(+) degradation and dramatically ameliorates brain damage following global cerebral ischemia. Neurobiol Dis 95:102–110. [DOI] [PMC free article] [PubMed] [Google Scholar]
- Parodi-Rullan RM, Chapa-Dubocq X, Rullan PJ, Jang S, Javadov S. 2017. High Sensitivity of SIRT3 Deficient Hearts to Ischemia-Reperfusion Is Associated with Mitochondrial Abnormalities. Front Pharmacol 8:275. [DOI] [PMC free article] [PubMed] [Google Scholar]
- Parodi-Rullan RM, Chapa-Dubocq XR, Javadov S. 2018. Acetylation of Mitochondrial Proteins in the Heart: The Role of SIRT3. Front Physiol 9:1094. [DOI] [PMC free article] [PubMed] [Google Scholar]
- Ratajczak J, Joffraud M, Trammell SA, Ras R, Canela N, Boutant M, Kulkarni SS, Rodrigues M, Redpath P, Migaud ME, Auwerx J, Yanes O, Brenner C, Canto C. 2016. NRK1 controls nicotinamide mononucleotide and nicotinamide riboside metabolism in mammalian cells. Nat Commun 7:13103. [DOI] [PMC free article] [PubMed] [Google Scholar]
- Ren T, Zhang H, Wang J, Zhu J, Jin M, Wu Y, Guo X, Ji L, Huang Q, Zhang H, Yang H, Xing J. 2017. MCU-dependent mitochondrial Ca(2+) inhibits NAD(+)/SIRT3/SOD2 pathway to promote ROS production and metastasis of HCC cells. Oncogene 36(42):5897–5909. [DOI] [PubMed] [Google Scholar]
- Sauve AA. 2008. NAD+ and vitamin B3: from metabolism to therapies. The Journal of pharmacology and experimental therapeutics 324(3):883–893. [DOI] [PubMed] [Google Scholar]
- Sauve AA, Munshi C, Lee HC, Schramm VL. 1998. The reaction mechanism for CD38. A single intermediate is responsible for cyclization, hydrolysis, and base-exchange chemistries. Biochemistry 37(38):13239–13249. [DOI] [PubMed] [Google Scholar]
- Scott I, Webster BR, Li JH, Sack MN. 2012. Identification of a molecular component of the mitochondrial acetyltransferase programme: a novel role for GCN5L1. Biochem J 443(3):655–661. [DOI] [PMC free article] [PubMed] [Google Scholar]
- Siegel CS, McCullough LD. 2013. NAD+ and nicotinamide: sex differences in cerebral ischemia. Neuroscience 237:223–231. [DOI] [PMC free article] [PubMed] [Google Scholar]
- Smith ML, Auer RN, Siesjo BK. 1984. The density and distribution of ischemic brain injury in the rat following 2-10 min of forebrain ischemia. Acta neuropathologica 64(4):319–332. [DOI] [PubMed] [Google Scholar]
- Sol EM, Wagner SA, Weinert BT, Kumar A, Kim HS, Deng CX, Choudhary C. 2012. Proteomic investigations of lysine acetylation identify diverse substrates of mitochondrial deacetylase sirt3. PloS one 7(12):e50545. [DOI] [PMC free article] [PubMed] [Google Scholar]
- Song Z, Ghochani M, McCaffery JM, Frey TG, Chan DC. 2009. Mitofusins and OPA1 mediate sequential steps in mitochondrial membrane fusion. Molecular biology of the cell 20(15):3525–3532. [DOI] [PMC free article] [PubMed] [Google Scholar]
- Suh SW, Shin BS, Ma H, Van Hoecke M, Brennan AM, Yenari MA, Swanson RA. 2008. Glucose and NADPH oxidase drive neuronal superoxide formation in stroke. Ann Neurol 64(6):654–663. [DOI] [PMC free article] [PubMed] [Google Scholar]
- Szabo C, Dawson VL. 1998. Role of poly(ADP-ribose) synthetase in inflammation and ischaemia-reperfusion. Trends in pharmacological sciences 19(7):287–298. [DOI] [PubMed] [Google Scholar]
- Trammell SA, Schmidt MS, Weidemann BJ, Redpath P, Jaksch F, Dellinger RW, Li Z, Abel ED, Migaud ME, Brenner C. 2016. Nicotinamide riboside is uniquely and orally bioavailable in mice and humans. Nat Commun 7:12948. [DOI] [PMC free article] [PubMed] [Google Scholar]
- Uddin GM, Youngson NA, Doyle BM, Sinclair DA, Morris MJ. 2017. Nicotinamide mononucleotide (NMN) supplementation ameliorates the impact of maternal obesity in mice: comparison with exercise. Sci Rep 7(1):15063. [DOI] [PMC free article] [PubMed] [Google Scholar]
- Verdin E 2015. NAD(+) in aging, metabolism, and neurodegeneration. Science 350(6265):1208–1213. [DOI] [PubMed] [Google Scholar]
- Willems PH, Rossignol R, Dieteren CE, Murphy MP, Koopman WJ. 2015. Redox Homeostasis and Mitochondrial Dynamics. Cell metabolism 22(2):207–218. [DOI] [PubMed] [Google Scholar]
- Yoshino J, Baur JA, Imai SI. 2018. NAD(+) Intermediates: The Biology and Therapeutic Potential of NMN and NR. Cell metabolism 27(3):513–528. [DOI] [PMC free article] [PubMed] [Google Scholar]
- Yoshino J, Mills KF, Yoon MJ, Imai S. 2011. Nicotinamide mononucleotide, a key NAD(+) intermediate, treats the pathophysiology of diet- and age-induced diabetes in mice. Cell metabolism 14(4):528–536. [DOI] [PMC free article] [PubMed] [Google Scholar]
- Yu T, Robotham JL, Yoon Y. 2006. Increased production of reactive oxygen species in hyperglycemic conditions requires dynamic change of mitochondrial morphology. Proc Natl Acad Sci U S A 103(8):2653–2658. [DOI] [PMC free article] [PubMed] [Google Scholar]
- Zhang L, Gan X, He Y, Zhu Z, Zhu J, Yu H. 2017. Drp1-dependent mitochondrial fission mediates osteogenic dysfunction in inflammation through elevated production of reactive oxygen species. PloS one 12(4):e0175262. [DOI] [PMC free article] [PubMed] [Google Scholar]
- Zheng J, Shi L, Liang F, Xu W, Li T, Gao L, Sun Z, Yu J, Zhang J. 2018. Sirt3 Ameliorates Oxidative Stress and Mitochondrial Dysfunction After Intracerebral Hemorrhage in Diabetic Rats. Frontiers in neuroscience 12:414. [DOI] [PMC free article] [PubMed] [Google Scholar]
- Zhu K, Swanson RA, Ying W. 2005. NADH can enter into astrocytes and block poly(ADP-ribose) polymerase-1-mediated astrocyte death. Neuroreport 16(11):1209–1212. [DOI] [PubMed] [Google Scholar]