

Abstract
Obesity prevalence continues to rise worldwide, posing a substantial burden on people’s health and wellbeing. However, up to 45% of obese individuals do not suffer from cardiometabolic complications, also referred to as the metabolically healthy obese (MHO). Concurrently, up to 30% of normal weight individuals demonstrate cardiometabolic risk factors that are typically only seen in obese individuals; the so called metabolically obese normal weight (MONW). Besides lifestyle factors (physical activity, diet, smoking, …) and demographic (age, sex, ancestry) factors, innate biological mechanisms are known to contribute to the etiology of the MHO and MONW phenotypes, as well. Experimental studies in animal models have shown that adipose tissue and adipocyte biology are key players, and mechanisms such as adipose tissue expandability, fat distribution, adipogenesis, vascularization of adipose tissue, inflammation, and mitochondrial function are the main mechanisms that uncouple adiposity from its cardiometabolic comorbidities. We reviewed the current studies that take advantage of genetic association data to expand insights into the biology of MHO/MONW phenotypes. At least four genetic loci were identified through genome-wide association studies for body fat percentage (BF%) of which the BF%-increasing allele was associated with a protective effect on glycemic and lipid outcomes. For some – but not all – this association was mediated through favorable effect on body fat distribution. Other studies that aimed to characterize the genetic susceptibility of insulin resistance, found that a higher genetic susceptibility was associated with lower overall adiposity due to less fat accumulation at hips and legs, suggesting that an impaired capacity to store fat in adipose tissue may be metabolically harmful. While these genetic association studies have started to provide new insights into the biology of MHO/MONW phenotypes, purposefully designed genome-wide association studies to discover new genes in a hypothesis-free manner have not yet been performed. Clearly, a lot more work remains to be done in this field, first through gene discovery, and subsequently through functional follow-up of identified genes.
Introduction
Over the past four decades, the prevalence of obesity among adults worldwide has nearly tripled--from 4.8% in 1975 to almost 13% (or 650 million people) in 2016 [1–3]. Particularly alarming is the steady increase in middle- and low-income, often densely populated countries that have only been exposed to an increasingly obesogenic environment in recent years, the full impact of which remains to unfold [1, 3].
Obesity is a major risk factor for many metabolic diseases, such as type 2 diabetes (T2D), cardiovascular disease (CVD), dyslipidemia, and hypertension [4–10], and poses an enormous burden on people’s personal health and well-being [10, 11]. However, not all individuals who are obese suffer from metabolic comorbidities. An estimated 15–45% of obese individuals are considered to be metabolically healthy, despite excess adiposity (the so-called “metabolically healthy obese”, MHO) [12–32]. Conversely, not all normal weight individuals are protected from metabolic disease; i.e. an estimated 6–30% of normal weight people demonstrate cardiometabolic abnormalities that are typically seen in obese individuals (the so-called “metabolically obese normal weight”, MONW) [17–34]. These subgroups of obese and normal weight individuals were first described in the early 1980’s [35–37], but in the past decade, research into their etiology, correlates, and future disease risk has increased exponentially.
Here, we review the factors that explain why some obese individuals are metabolically healthy, why some normal weight individuals are at risk, and how this affects their risk of future disease. The main focus of this review is on the genetic etiology; we review the literature on genetic variations that are associated with increased adiposity and that, at the same time, have favorable effects on cardiometabolic outcomes. Through studying the genetic contributors to this apparently paradoxical relationship, we aim to gain insight into the biology that couples (or uncouples) adiposity to cardiometabolic comorbidities.
What is MHO and MONW ?
As noted above, the prevalence of MHO and MONW varies substantially across studies. Primarily, this wide range is due to the lack of a uniform definition to capture these complex conditions. Across different studies, different phenotypes and thresholds have been used to define “obesity” and “metabolic health” [34, 38]. In most studies, “normal weight” and “obese” are defined by using body mass index (BMI) cut offs defined by the WHO (BMI < 25 kg/m2 and BMI ≥ 30 kg/m2, respectively) [2], but other adiposity traits, such as body fat percentage and waist circumference, are being used, as well [34, 38]. The definition of “metabolic health” is more diversified. Most often, metabolic health is defined by the absence or presence of any of the four risk factors that constitute the metabolic syndrome (high blood pressure, high fasting glucose, triglycerides, and low HDL-cholesterol levels). However, the number of risk factors that have to be absent or present to define a person as metabolically “healthy” or “unhealthy”, respectively, varies across studies [34, 38]. Other markers of metabolic health, such as insulin sensitivity measures (HOMA), markers of inflammation, and even cardiorespiratory fitness, are sometimes included, as well [34, 38].
The phenotypes and criteria used to define MHO and MONW typically depend on the data available and the research questions to be answered. While the absence of a consensus hampers comparison of observations between studies and their generalizability, it is debatable whether a single definition can capture these complex and heterogeneous conditions. It is reasonable to assume that the MHO and MONW subgroups are themselves not homogenous. For example, a commonly used definition for MHO requires individuals to be both obese (BMI ≥ 30 kg/m2) and not have more than one metabolic syndrome risk factor present. As such, obese individuals with no risk factors are grouped with obese individuals who are mostly metabolically healthy, but may just have elevated fasting glucose levels, or elevated triglyceride levels, or low HDL-cholesterol levels. While all of these individuals are considered to be MHO, they clearly constitute one clinically heterogeneous group. In particular, when one aims to identify underlying genes, and thus underlying biology of MHO and MONW, such heterogeneity may make this task almost impossible.
Taken together, while the existence of MHO and MONW individuals is well recognized, the diversity of definitions makes the comparison of findings not straightforward. On the other hand, a single definition to capture these heterogeneous conditions could be a limiting factor when aiming to study the underlying biology that links adiposity and cardiometabolic health.
Disease risk associated with MHO and MONW
The disease risks associated with MHO and MONW vary across studies and across disease outcomes studied. Some studies found that the disease risk for MHO individuals is similar to that of normal weight individuals (at least for cardiovascular disease [15–18], stroke [15], peripheral vascular disease [20], dyslipidemia [39], type 2 diabetes [16]) and mortality [27–29]), even after many years of follow-up. However, cumulating evidence from several large-scale prospective studies suggest that MHO individuals have a higher risk than healthy normal weight individuals for many cardiometabolic outcomes (cardiovascular disease [14, 18–25, 40], cerebrovascular disease [20], hypertension [39], insulin resistance [39], type 2 diabetes [14, 24–26, 41]), yet their risk is lower than that of metabolically unhealthy obese individuals. Other studies suggest that the MHO-state may be transient, and that over time, MHO individuals will transition to metabolically unhealthy obese [14].
Similarly, MONW individuals were found to be at increased risk for future cardiometabolic disease, compared to healthy normal weight individuals, but for most outcomes (cardiovascular disease [14–25, 40], cerebrovascular disease [20], peripheral vascular disease [20], type 2 diabetes [14, 16, 24–26] and mortality [28, 29]), their risk is generally not as high as that of metabolically unhealthy obese individuals.
Differences in definitions, duration of follow-up, sample size, and disease outcomes studied likely contribute to the discrepancies in disease risks reported for MHO and MONW individuals [42, 43]. In general, it seems disease risks of MHO and MONW are intermediate to healthy normal weight and unhealthy obesity individuals.
Factors contributing to MHO and MONW
Lifestyle and demographic factors have been shown to explain at least part of the difference between metabolically healthy and metabolically unhealthy obese individuals. MHO individuals are generally younger, female, more often of African ancestry, have a relatively lower BMI and waist circumference, and tend to live a healthier lifestyle (smoke less, more physically active, healthier diet) compared to their unhealthy obese peers [13–32]. Similar factors partially explain why some normal weight individuals are metabolically unhealthy; i.e. MONW individuals are often older, male, less likely of African ancestry, have a higher BMI and larger waist circumference and live a less healthy lifestyle, compared to healthy normal weight individuals [14–32].
Nevertheless, even after accounting for these demographic and environmental correlates, MHO individuals continue to have a more favorable cardiometabolic risk profile than the unhealthy obese individuals, and MONW individuals continue to be at greater risk than the healthy normal weight individuals [14–28]. This suggests that innate, biological mechanisms also contribute to the cardiometabolic differences among obese and normal weight individuals.
Current insights into the underlying mechanisms
The mechanisms that determine why some obese individuals remain free from cardiometabolic complications, while others do not, are not fully understood. Current insights have come mainly from rodent models, which aim to identify pathways through the manipulation of candidate genes and proteins, such as adiponectin [44, 45], mitochondrial membrane protein (mitoNEET) [46], vascular endothelial growth factors [47–49], glucose transporter type 4 [50], and others [51–53]. From these studies, adipose tissue and adipocyte biology have emerged as key players underlying the MHO and MONW phenotypes. Specifically, adipose tissue expandability and lipotoxicity, fat distribution and ectopic fat accumulation, adipogenesis and lipogenesis, oxygen availability and vascularization of adipose tissue, adipose tissue inflammation, and mitochondrial function have been proposed as the main mechanisms involved [44–57]. These observations from animal studies have been corroborated by findings from studies in humans, which are often small-scale, due to the invasiveness of the methods used [58–68].
These in-depth experimental and physiological studies in animals and humans make it possible to focus on specific pathways or manipulate presumed mechanisms involved, but they are always “hypothesis-driven” – i.e, they build upon a biology that is already partially known. As such, these types of studies may prevent the discovery of totally new mechanisms that were not previously believed to play a role.
Using human genetics to identify new pathways and mechanisms
Complimentary to the hypothesis-driven experimental animal and human studies is the genome-wide association approach, which aims to identify new mechanisms through gene discovery. Genome-wide association studies (GWAS) are hypothesis-free and have the potential to point to new genes that have not been previously implicated in a given disease [69]. As genes translate into proteins and proteins constitute biological pathways, the discovery of genes and genetic variations that influence obesity and metabolic traits can lead to new insights in the biology that underlies MHO and MONW.
Over the past decade, GWAS have led to the identification of thousands of genetic loci robustly associated with a wide range of diseases and traits [70], including >500 genetic loci associated with adiposity traits [71], mainly with BMI (as a proxy of overall obesity) [72–74] and waist-to-hip ratio (WHR; proxy of fat distribution) [75], but also with more refined adiposity traits, such as body fat percentage (BF%) [76, 77], leptin [78], specific fat depots, such as visceral and subcutaneous adipose tissue (VAT, SAT) [79–81], and extreme and early-onset obesity [82–84]. In addition, GWAS have also identified hundreds of loci associated with cardiometabolic traits, including glycemic traits [85, 86], circulating lipid levels [87–89], blood pressure [90, 91], coronary artery disease (CAD) [92], and type 2 diabetes [93, 94].
So far, no GWAS have been performed to specifically search for genetic variants associated with MHO or MONW. This may be due to the absence of a uniform definition, but more importantly, it may be because the MHO and MONW represent heterogeneous sub-groups, which impedes gene discovery [69]. Despite the lack of specific GWAS for MHO or MONW, genetic variants exist that are associated with increased adiposity (e.g. higher BMI), and – at the same time – with a favorable cardiometabolic profile (e.g. lower glucose levels, lower triglyceride and higher HDL-cholesterol levels, lower blood pressure, and/or lower risk of T2D and CAD), and thus mirror the MHO phenotype. Because genetic variants in GWAS are typically bi-allelic (two variations), the alternate allele is associated with decreased adiposity and a poorer cardiometabolic profile, resembling the MONW phenotype. Here, we review the genetic variants identified so far and the insights that they have contributed to our understanding of the biology that either couples or uncouples obesity and cardiometabolic disease.
Genome-wide association studies for adiposity outcomes
Our interest in using genetic association data to identify adiposity-increasing variants that have protective effects on cardiometabolic outcomes was sparked by a GWAS on body fat percentage (N=76,150) that identified three loci that reached genome-wide significance (FTO, near IRS1, near SPRY2) [77]. Interestingly, the BF%-increasing allele (rs2943650, P=3.8×10⁻¹¹) of the IRS1 locus (insulin receptor substrate 1) was significantly associated with a lower cardiometabolic risk profile, including lower risk of T2D and CAD (Table 1), which is consistent with a MHO phenotype. In follow-up analyses, we showed that this – at first unanticipated –association signature was explained by an effect on fat deposition; i.e. the BF%-increasing allele favors fat deposition in subcutaneous, but not in the metabolically harmful visceral adipose tissue. These findings mirror Irs1 knockout mice that are lean but insulin resistant [95, 96], and whose cell lines suggest a role in adipocyte differentiation [97, 98]. The variant (rs2943650) that we identified is not located in IRS1, but at ~500k basepairs upstream of the gene. However, as its BF%-increasing allele is associated with higher IRS1 expression in adipose tissue and muscle, we believe that IRS1 is likely the causal gene is this locus [77]. Together, these data suggest that genetic variation near IRS1 may impair people’s ability to store fat subcutaneously, which may result in adverse cardiometabolic outcomes, such as insulin resistance and dyslipidemia. In contrast to IRS1, the BF%-increasing alleles of the variants in FTO and near SPRY2, the two other loci identified in the GWAS for BF%, were associated with a higher cardiometabolic risk [77].
Table 1.
Association results (direction of effect, P-value) of four loci, identified through genome-wide association studies for body fat percentage, that show a MHO/MONW association signature.
| Trait |
IRS1
rs2943650 |
COBLL1/GRB14 rs6738627 |
PLA2G6 rs3761445 |
TOMM40 rs6857 |
||||||
|---|---|---|---|---|---|---|---|---|---|---|
| Source (PMID) |
Nmax | BMI increasing (C-) allele |
P value | BMI increasing (A-) allele |
P value | BMI increasing (G-) allele |
P value | BMI increasing (C-) allele |
P value | |
| BMI | 25673413 | 335,397 | increase | 7.1 × 10⁻³ | increase | 6.1 × 10⁻⁴ | increase | 2.4 × 10⁻³ | increase | 10−4 |
| Body Fat% | 26833246 | 99,614 | increase | 3.8 × 10⁻¹¹ | increase | 5.7 × 10⁻⁹ | increase | 1.8 × 10⁻⁷ | increase | 6.8 × 10⁻⁹ |
| VAT/SAT | 27918534 | 18,205 | decrease | 3.5 × 10⁻³ | decrease | 0.014 | increase | 0.37 | increase | 0.25 |
| VAT (visceral adipose tissue) | 27918534 | 18,312 | increase | 0.21 | increase | 0.05 | increase | 1.6 × 10⁻³ | increase | 8.6 × 10⁻⁵ |
| SAT (subcunatenous adipose tissue) | 27918534 | 18,206 | increase | 1.2 × 10⁻⁵ | increase | 1.7× 10⁻³ | increase | 0.031 | increase | 0.014 |
| WHRadjBMI | 25673412 | 221,453 | decrease | 0.38 | decrease | 6.7 × 10⁻⁹ | decrease | 0.78 | increase | 7.8 × 10⁻⁵ |
| WHR (waist-to-hip ratio) | 25673412 | 223,839 | increase | 4.3 × 10⁻³ | decrease | 3.6 × 10⁻⁵ | increase | 0.54 | increase | 1.3 × 10⁻⁵ |
| Waist Circumference | 25673412 | 241,458 | increase | 8.4 × 10⁻³ | increase | 0.20 | increase | 0.012 | increase | 8.3 × 10⁻⁵ |
| Hip Circumference | 25673412 | 224,459 | increase | 2 × 10⁻⁴ | increase | 1.7 × 10⁻⁶ | increase | 1.1 × 10⁻³ | increase | 0.19 |
| Height | 25282103 | 253,006 | decrease | 0.38 | increase | 0.72 | increase | 6.7 × 10⁻⁵ | decrease | 0.17 |
| Triglycerides | 24097068 | 175,846 | decrease | 2 × 10⁻⁵ | decrease | 3.3 × 10⁻⁵ | decrease | 8.1 × 10⁻¹² | decrease | 4.6 × 10⁻¹⁹ |
| HDL-Cholesterol | 24097068 | 185,166 | increase | 1 × 10⁻⁷ | increase | 4.9 × 10⁻⁹ | increase | 3.9 × 10⁻⁴ | increase | 2.6 × 10⁻¹⁷ |
| LDL-Cholesterol | 24097068 | 171,168 | decrease | 0.045 | decrease | 0.035 | decrease | 0.04 | decrease | 5.1 × 10−112 |
| Fasting glucose | 22885924 | 133,010 | decrease | 0.11 | decrease | 0.22 | increase | 0.93 | increase | 2.1 × 10⁻³ |
| Fasting Insulin | 22885924 | 108,557 | decrease | 1.4 × 10⁻⁷ | decrease | 4.1 × 10⁻⁶ | decrease | 0.86 | increase | 0.28 |
| Fasting Insulin adjusted for BMI | 22885924 | 108,557 | decrease | 3.2 × 10⁻¹⁹ | decrease | 1.7 x 10⁻¹² | decrease | 10−3 | increase | 0.35 |
| T2D risk (cases/controls) | 24509480 | 26,488/83,964 | decrease | 2.7 × 10⁻¹⁴ | decrease | 5.4 × 10⁻¹¹ | decrease | 0.43 | increase | 2.8 × 10⁻³ |
| CVD risk (cases/controls) | 26343387 | 60,801/123,504 | decrease | 1.6 × 10⁻⁷ | decrease | 0.039 | increase | 0.74 | decrease | 6.8 × 10⁻⁸ |
Associations that reach nominal significance (P<0.05) are in bold
Associations that are considered favorable are in green, and those that are unfavorable for health are in red.
Associations are shown in function of the BF% increasing allele.
In a larger, subsequent GWAS (N=100,716), we identified 12 loci significantly associated with BF% [76]. Five loci had been previously identified for association with BMI; their effect on BMI was more pronounced than on BF%. Consistent with expectations based on phenotypic correlations between adiposity and cardiometabolic traits, the BMI-increasing alleles of these five loci were associated with a generally poorer glycemic and lipid profile. The other seven loci – four of which were novel – had a larger effect on BF% than on BMI. Interestingly, four of these loci (including IRS1) showed an association signature consistent with a MHO/MONW phenotype; i.e. the BF%-increasing alleles had protective effects on glycemic and lipid traits (Table 1). For example, the BF%-increasing allele of the COBLL1/GRB14 variant (rs6738627) is associated with lower triglyceride levels, higher HDL-cholesterol, and lower fasting insulin levels, as well as a lower risk of T2D. Similar to the locus near IRS1, the protective effect of the COBLL1/GRB14 variants may be mediated through an effect on body fat distribution; i.e. the BF%-increasing allele is associated with increased subcutaneous, but not visceral, adipose tissue. In addition, the BF%-increasing allele is associated with lower BMI-adjusted WHR and larger hip circumference, suggestive of a relatively greater gluteal than abdominal fat deposition. The causal gene in the locus remains to be pinpointed, but current evidence points to GRB14, as the BF%-increasing allele is associated with a lower expression of GRB14 in subcutaneous and omental fat, whereas no association is observed with COBLL1 expression [76]. GRB14 encodes a protein that interacts with insulin receptors and insulin-like growth-factor receptors. Grb14 expression is increased in genetically obese (ob/ob) mice [99] and grb14-deficient mice show improved glucose homeostasis and enhanced insulin action through increased irs1 phosphorylation in muscle and liver [100]. Together, the genetic association data and the animal data suggest that GRB14 and IRS1 act in the same pathway and influence insulin sensitivity through an effect of fat distribution and storage.
The BF%-increasing allele of the PLA2G6 locus (rs3761445) is also associated with lower triglyceride and higher HDL cholesterol levels, lower fasting insulin levels, and a lower risk of T2D (Table 1) – a similar association signature to the near-IRS1 and GRB14 loci [76]. However, the role of body fat distribution as a potential mediator is less evident; the BF%-increasing allele is associated with increased SAT and hip circumference, which is considered to be protective, but the same allele is also associated with increased VAT and waist circumference (Table 1). In addition, the BF%-increasing allele is associated with a significantly greater height. This suggests that the mechanisms that underlie the MHO/MONW phenotypes for this locus, may be different than for the near-IRS1 and GRB14 loci. The lead variant (rs3761445) is located in PLA2G6, a potential candidate gene in this locus, as it encodes a phospholipase A2 enzyme that catalyzes the release of fatty acids from phospholipids.
Another BF% associated locus, nearest to TOMM40, is more complex. The BF%-increasing allele (rs6857) is associated with a significantly healthier lipid profile (lower triglyceride and LDL-cholesterol levels, higher HDL-cholesterol levels) and protects against coronary artery disease, whereas no associations with glycemic traits were observed (Table 1). Interestingly, despite its protective effects on lipid levels, the BF%-increasing allele of rs6857 was associated with a significantly increased WHR, waist (but not hip) circumference and visceral adipose tissue deposition, suggesting a proportionally greater fat accumulation in the abdominal area, which is metabolically more harmful. The locus is located near APOE, in which variants are known to be highly significantly associated with lipid levels. However, follow-up analyses showed that the associations observed for rs6857 are mostly independent from those observed for APOE variants. Similar to the PLA6G2 locus, the BF%-increasing allele of the TOMM40 locus are associated with a proportionally greater VAT than SAT, and a higher WHR, which in contrary to the typical hypothesis that fat distribution mediates the MHO/MONW phenotypes (Table 1). The BF%-increasing alleles of variants highly correlated with rs6857 and thus representing the same locus, have been shown to associate with lower risk of Alzheimer’s disease [101], slower cognitive decline [102], and increased longevity [103]. TOMM40 encodes a protein that is embedded in the outer membranes of mitochondria and is critical for protein transport in mitochondria [104]. BF%-increasing allele of rs6857 is associated with increased expression of TOMM40 in omental and subcutaneous fat [76]. TOMM40 has been studied primarily in the context of Alzheimer’s disease; the precise mechanism through which it may affect adiposity and cardiometabolic disease remains to be elucidated.
Another locus with a MHO/MONW association signature was identified through a GWAS for BMI in a relatively small population of Samoans (Nmax=3,072) [105], whose obesity prevalence ranks among the highest in the world. Samoans constitute a founder population with distinct demographic and evolutionary characteristics, which provide unique opportunities for gene discovery. The GWAS identified one genome-wide significant association: the minor allele of a coding variant (rs373863828, p.Arg457Gln) in CREBRF was associated with a 1.4 kg/m2 higher BMI (equivalent to ~4 kg/allele for a 1.7m tall person) and with a 1.3-fold increased risk of obesity. Interestingly, the obesity-increasing allele was significantly associated with 1.6-fold lower risk of T2D and lower fasting glucose levels [106]. This obesity-increasing and T2D-decreasing association signature has since been replicated in other Pacific populations [107], with effects on body size seen as early as age 4 [108], and does not seem to be mediated through favorable fat distribution (assessed by WHR) [106]. The BMI-increasing allele is common among Polynesian populations (MAF>10%) [106–109], in particular among Samoans (MAF=26%) [106], and is present among some Melanesian and Micronesian populations (MAF>2%) [109], but is practically non-existent in other populations [110]. CREBRF is widely expressed, including in adipose tissue, and the Arg-to-Gln change at rs373863828 is predicted to have functional implications for the gene/protein [106, 110]. Using a cellular model, it was shown that the Gln-(BMI-increasing) allele promotes lipid storage but reduces energy use in adipocytes. While this explains the potential biology underlying the obesity susceptibility, it does not explain the protective effect on T2D [105]. More work will be needed to further elucidate CREBRF’s paradoxical effect on obesity and T2D susceptibility, and to assess its role in non-Pacific Islanders.
Follow up of genetic variants associated with cardiometabolic traits
The GWAS studies described above aimed – in the first place – to identify loci associated with adiposity traits. The fact that some of these loci have a MHO/MONW association signature was a secondary – and rather serendipitous – finding. In other studies, reviewed here, follow-up analyses were performed on GWAS-identified loci for cardiometabolic traits to gain insight into how they affect health. The first three studies focused on genetic loci identified in GWAS for fasting insulin levels, and a fourth study identified novel loci by combining three GWAS (fasting insulin, HDL-cholesterol, and triglyceride levels). All four studies show that these insulin resistance associated loci – individually or aggregated – are associated with higher cardiometabolic risk, despite being associated with decreased adiposity [111–114].
The first three studies focused on genetic variants identified in a GWAS for insulin levels, as a proxy for insulin resistance [85]. In the first study (Nmax=18,565), Scott et al. created a genetic risk score (GRS) that combined 10 variants that, besides being associated with fasting insulin levels, were also associated with lower HDL-cholesterol and higher triglyceride levels [113]. In the second study (Nmax = 70,000), Yaghootkar et al. [111] considered all 19 insulin-associated variants identified in the same GWAS and examined their associations with eight adiposity and cardiometabolic traits. Hierarchical clustering of these association results split the 19 variants into two clusters, with the main cluster grouping 11 insulin-associated variants (in/near LYPLAL1, GRB14, IRS1, PPARG, FAM12A1, PDGFC, ARL15, ANKRD55, RSPO3, PEPD, and TET2) [111]). Apart from TET2, the variants in this main cluster fully overlapped with the 10 variants examined by Scott et al. [113]. In the third paper, Yaghootkar et al. replicated their observations for the same 11 variants in 164,609 indviduals of the UK Biobank and 5 additional studies [112]. As the three studies ended up using largely the same variants and similar approaches (i.e. GRS) to characterise the genetic susceptibility to insulin resistance, their overall observations are consistent. All three studies created a GRS that summed the risk alleles of insulin-associated variants that were also known to associate with a poorer lipid profile. As expected, a higher GRS was associated with increased insulin resistance, lower HDL cholesterol and higher triglyceride levels, and increased risk of T2D and CAD. Follow-up analyses, using more refined measures of body composition and fat distribution, showed that the association with lower BMI and BF% was linked to a higher WHR and visceral-to-subcutaneous adipose tissue (VAT/SAT) ratio, which was driven by a smaller hip circumference, less subcutaneous (but not visceral) adipose tissue, and less leg and gynoid (but not trunk or android) fat mass [111–113]. Thus, all three studies show – across different populations – that the lower adiposity observed with increased genetic susceptibility to insulin resistance is due to less fat accumulation at hips and legs. The 11 genetic variants, used to assess the genetic susceptibility to insulin resiatnce, are located in or near genes that may play a role in adipocyte biology (e.g. IRS1, PPARG, LYPLAL1, PEPD, GRB14, COBLL1, ANKRD55, FAM13A), but the mechanisms through which each associate with reduced adiposity and increased insulin resistance may be different and requires further functional follow up.
In the fourth study, using a more exploratory approach to move beyond already established insulin-associated variants, Lotta et al. aligned the summary statistics of three GWAS, for fasting insulin (BMI-adjusted) [86, 113], HDL-cholesterol [87], and triglyceride levels [87] to identify additional variants and to gain insight into the genetic and molecular mechanisms underpinning insulin resistance and adiposity [114]. They identified 53 genetic loci associated with higher insulin, higher triglyceride, and lower HDL-cholesterol levels (at P<0.005 for each trait), which included the 10 loci included in the previous studies, and 43 novel loci. A GRS based on these 53 loci was associated with increased risk of T2D (P<10−60) and – to a lesser extent – with risk of coronary heart disease (P<10−13) (Figure 1). Consistent with previous studies, a higher GRS for insulin resistance was associated with lower BMI (P<10−7) and BF% (P<10−15), but with higher WHR (P<20−87), which was mainly due to a proportionally smaller hip (P<10−33) than larger waist (P=0.003) circumference (Figure 1). Follow-up analyses using more refined measurements showed that the association with lower adiposity was driven by lower gynoid (P<10−12) and leg (P<10−15) fat mass (but not lean mass), with no effect on trunk fat mass (P=0.42) [114] (Figure 1). As before, these findings suggest that a genetic susceptibility to insulin resistance – as assessed by these 53 loci – is mediated through an inability to store fat in peripheral adipose depots. Tissue and cell type enrichment analyses showed that genes located in the 53 loci are significantly more often expressed in adipose tissue and adipocytes (Figure 2), and 31 of the 53 lead SNPs (P<10−4) overlap enhancer elements that are active in adipose tissue [114]. Three candidate genes among the 53 loci (PPARG, PIK3R1 and INSR) are known to cause monogenic forms of lipodystrophy, and another candidate, LPL, is a key lipolysis regulator. Eight of the 53 loci were previously identified – at genome-wide significance – in GWAS for BF% and/or hip circumference (COBLL1/GRB14, FAM13A, ITPR2, KLF14, L3MBTL3, LYPLAL1, TNFAIP8, PIK3R1) and the adiposity-lowering alleles at these loci are associated with increased insulin resistance and T2D risk [114].
Figure 1.
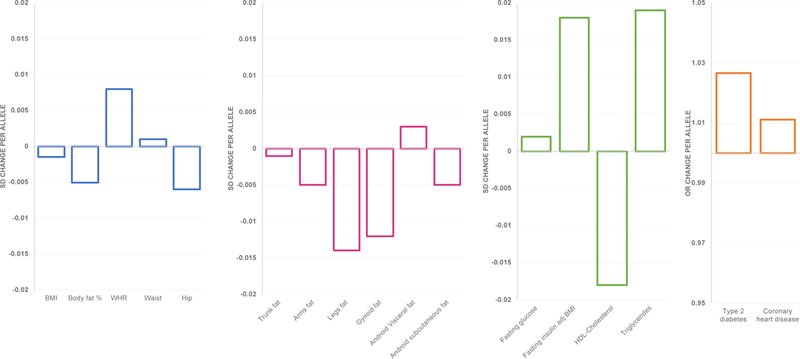
Association between the GRS, based on the insulin-increasing alleles of 53 variants, with adiposity and cardiometabolic outcomes. The per-allele effects for continuous traits are expressed in SD. Adapted from Lotta et al. [114].
Figure 2.

Tissue and cell type enrichment, using DEPICT, based on expression patterns in 37,427 human microarray samples. The y axis represents the −log10 (P value) for enrichment of signal in a cell or tissue type; enrichment is significant at PBonferroni ≤ 0.00072. From Lotta et al. [114].
These four studies -- focusing on insulin resistance-associated genetic variants -- suggest that the unexpected association between a lower overall adiposity and higher insulin resistance and risk of T2D is mediated through an unfavorable fat distribution. Specifically, these studies show that less subcutaneous fat storage and/or less fat accumulation at legs and hips is metabolically harmful and that an impaired capacity to expand peripheral fat depots might contribute to increased insulin resistance and T2D risk in the general population – features that are reminiscent of those observed in more extreme monogenic forms of lipodystrophy. The finding that relatively larger hip and thigh circumferences are metabolically protective corroborates observations from general and genetic epidemiological studies [115–122].
While these studies support a role for fat distribution and fat storage as one mechanism underlying insulin resistance, it is important to note that a GRS based on other (or more) insulin resistance-associated variants may not show the same association with lower (gluteofemoral) adiposity. After all, the variants included in the GRS were identified in GWAS for BMI-adjusted insulin levels and were also associated with HDL-cholesterol and triglyceride levels. Therefore, the GRSs may represent only one part of the genetic susceptibility to insulin resistance and T2D risk. Other variants of which the association with increased insulin levels is mediated through an effect on increased BMI (e.g. FTO, YSK4, HIP1) or that are not associated with lipid levels (e.g. UHRF1BP1, IGF1, HIP1), were not included in the GRS.
A limitation of using GRSs is that contributing genetic variants and/or genes are only assessed in aggregate, as a proxy for genetic susceptibility to insulin resistance, whereas the biological candidacy of the individual genes is not considered. Besides examining the GRS, Lotta et al. performed experimental follow up on a handful of genes (IRS1, CCDC92, DNAH10, L3MBTL3, and FAM13A) near four of the 53 variants included in their analyses [114]. They aimed to validated these genes’ putative role in adipogenesis, given that enrichment analyses had implicated adipocytes as a likely effector cell type underlying the observed associations (Figure 3). Except for Fam13a, knockdown of these genes in an adipocyte mouse model resulted in impaired lipid accumulation, consistent with the genetic association data showing that a higher genetic susceptibility to insulin resistance correlates with less peripheral fat and lower expression of these genes in subcutaneous adipocytes [114]. While these experiments in mouse models validate the candidacy of the genes, in-depth functional follow-up is needed to further pinpoint the underlying pathways.
Figure 3.

Summary of insights from current genetic association studies. Adiposity-increasing alleles that have protective effects on cardiometabolic outcomes have a favourable effect on fat distribution; fat accumulates peripherally, at thighs, hips and in subcutaneous adipocytes.
Conclusions
Environmental factors (diet, physical activity, smoking, etc.) and demographic factors (age, sex, ancestry) are important contributors to why some obese individuals are protected from cardiometabolic complications and why some normal weight individuals are at risk. In-depth functional studies in animals and humans support a role for innate biological mechanisms to underlie these paradoxical phenotypes, as well. As such, gene discovery analyses can be used to identify new genes, and thus reveal new pathways and mechanisms, that link increased adiposity with reduced risk of cardiometabolic complications. Nevertheless, insights gained from human genetic studies in the context of the MHO and MONW phenotypes have been limited, thus far.
Genome-wide association studies that aimed to identify variants for BF%, discovered that for some of these variants (in/near IRS1, COBLL1/GRB14, PLA2G6, TOMM40), the BF%-increasing allele had protective effects on cardiometabolic outcomes (Table 1) [76, 77]. These observations were secondary to the original goal of the studies and in-depth experimental follow up is still needed to gain insight into the underpinning biology. Even though, the adiposity-increasing allele for all four loci has protective effects on cardiometabolic outcomes, their association signatures differ and suggest that they each may represent different parts of the biology (Table 1).
Other studies aimed to characterize the genetic susceptibility for insulin resistance, using GRS based on genetic variants associated with BMI-adjusted insulin levels, and found that a higher susceptibility was coupled to lower adiposity [111–114]. Follow-up analyses, using more refined body composition measures, showed that this “paradoxical” observation was primarily due to less peripheral fat storage. This observation is consistent with the expandability hypothesis that suggests an impaired capacity to store fat in (subcutaneous) adipose tissue, can lead to metabolically harmful ectopic fat storage (e.g. in liver, muscle, …) and may result in comorbidities. The role of fat distribution and adipose tissue expandability has been highlighted before by experimental studies in animals and humans before. The value of the genetic association studies is that genes contributing to the GRS may reveal new proteins and pathways that had not been considered previously.
While the current studies provide some new insights to the field, observations are secondary to the main objective, and progress has been generally limited. Currently, what is missing are purposefully designed genome-wide discovery studies that aim to identify loci for MHO and/or MONW. This would allow discovery of genetic loci without any a priori hypothesis and may reveal new biology that (un)couples obesity and cardiometabolic complications.
Acknowledgments
Support
Ruth Loos is supported by the National Institutes of Health (R01 DK107786, R01 DK110113, U01HG007417) and a Visiting Professorship that is supported by the Novo Nordisk Foundation through the Danish Diabetes Academy. Tuomas Kilpeläinen is supported by the Danish Council for Independent Research (DFF – 6110–00183) and the Novo Nordisk Foundation (NNF17OC0026848)
Footnotes
Conflict of interest
The authors declare no conflict of interests related to this article.
References
- 1.NCD Risk Factor Collaboration. Trends in adult body-mass index in 200 countries from 1975 to 2014: a pooled analysis of 1698 population-based measurement studies with 19.2 million participants. The Lancet 2016; 387: 1377–96. [DOI] [PMC free article] [PubMed] [Google Scholar]
- 2.World Health Organisation. Fact Sheet: obesity and overweight. WHO; 2017. [Google Scholar]
- 3.NCD Risk Factor Collaboration, Abarca-Gómez L, Abdeen ZA, et al. Worldwide trends in body-mass index, underweight, overweight, and obesity from 1975 to 2016: a pooled analysis of 2416 population-based measurement studies in 128.9 million children, adolescents, and adults. The Lancet 2017. [DOI] [PMC free article] [PubMed] [Google Scholar]
- 4.Must A, Spadano J, Coakley EH, Field AE, Colditz G, Dietz WH. The disease burden associated with overweight and obesity. JAMA 1999; 282 1523–9. [DOI] [PubMed] [Google Scholar]
- 5.Mokdad AH, Ford ES, Bowman BA, Dietz WH, Vinicor F, Bales VS, Marks JS. Prevalence of obesity, diabetes, and obesity-related health risk factors, 2001. JAMA 2003; 289: 76–9. [DOI] [PubMed] [Google Scholar]
- 6.Yusuf S, Hawken S, Ounpuu S, et al. Obesity and the risk of myocardial infarction in 27,000 participants from 52 countries: a case-control study. Lancet 2005; 366: 1640–9. [DOI] [PubMed] [Google Scholar]
- 7.Canoy D, Boekholdt SM, Wareham N, et al. Body fat distribution and risk of coronary heart disease in men and women in the European Prospective Investigation Into Cancer and Nutrition in Norfolk cohort: a population-based prospective study. Circulation 2007; 116: 2933–43. [DOI] [PubMed] [Google Scholar]
- 8.Vazquez G, Duval S, Jacobs DR Jr., Silventoinen K. Comparison of body mass index, waist circumference, and waist/hip ratio in predicting incident diabetes: a meta-analysis. Epidemiologic Reviews 2007; 29: 115–28. [DOI] [PubMed] [Google Scholar]
- 9.Zheng Y, Manson JE, Yuan C, et al. Associations of Weight Gain From Early to Middle Adulthood With Major Health Outcomes Later in Life. JAMA 2017; 318: 255–69. [DOI] [PMC free article] [PubMed] [Google Scholar]
- 10.GBD Risk Factors Collaborators. Global, regional, and national comparative risk assessment of 79 behavioural, environmental and occupational, and metabolic risks or clusters of risks, 1990–2015: a systematic analysis for the Global Burden of Disease Study 2015. Lancet 2016; 388: 1659–724. [DOI] [PMC free article] [PubMed] [Google Scholar]
- 11.Collaborators GBDO, Afshin A, Forouzanfar MH, et al. Health Effects of Overweight and Obesity in 195 Countries over 25 Years. N Engl J Med 2017; 377: 13–27. [DOI] [PMC free article] [PubMed] [Google Scholar]
- 12.Iacobellis G, Ribaudo MC, Zappaterreno A, Iannucci CV, Leonetti F. Prevalence of uncomplicated obesity in an Italian obese population. Obes Res 2005; 13: 1116–22. [DOI] [PubMed] [Google Scholar]
- 13.Velho S, Paccaud F, Waeber G, Vollenweider P, Marques-Vidal P. Metabolically healthy obesity: different prevalences using different criteria. Eur J Clin Nutr 2010; 64: 1043–51. [DOI] [PubMed] [Google Scholar]
- 14.Appleton SL, Seaborn CJ, Visvanathan R, Hill CL, Gill TK, Taylor AW, Adams RJ. Diabetes and cardiovascular disease outcomes in the metabolically healthy obese phenotype: a cohort study. Diabetes Care 2013; 36: 2388–94. [DOI] [PMC free article] [PubMed] [Google Scholar]
- 15.Ogorodnikova AD, Kim M, McGinn AP, Muntner P, Khan U, Wildman RP. Incident cardiovascular disease events in metabolically benign obese individuals. Obesity (Silver Spring) 2012; 20: 651–9. [DOI] [PMC free article] [PubMed] [Google Scholar]
- 16.Meigs JB, Wilson PW, Fox CS, Vasan RS, Nathan DM, Sullivan LM, D’Agostino RB. Body mass index, metabolic syndrome, and risk of type 2 diabetes or cardiovascular disease. Journal of Clinical Endocrinology and Metabolism 2006; 91: 2906–12. [DOI] [PubMed] [Google Scholar]
- 17.Hosseinpanah F, Barzin M, Sheikholeslami F, Azizi F. Effect of different obesity phenotypes on cardiovascular events in Tehran Lipid and Glucose Study (TLGS). Am J Cardiol 2011; 107: 412–6. [DOI] [PubMed] [Google Scholar]
- 18.Morkedal B, Vatten LJ, Romundstad PR, Laugsand LE, Janszky I. Risk of myocardial infarction and heart failure among metabolically healthy but obese individuals: HUNT (Nord-Trondelag Health Study), Norway. J Am Coll Cardiol 2014; 63: 1071–8. [DOI] [PubMed] [Google Scholar]
- 19.Song Y, Manson JE, Meigs JB, Ridker PM, Buring JE, Liu S. Comparison of usefulness of body mass index versus metabolic risk factors in predicting 10-year risk of cardiovascular events in women. Am J Cardiol 2007; 100: 1654–8. [DOI] [PMC free article] [PubMed] [Google Scholar]
- 20.Caleyachetty R, Thomas GN, Toulis KA, Mohammed N, Gokhale KM, Balachandran K, Nirantharakumar K. Metabolically Healthy Obese and Incident Cardiovascular Disease Events Among 3.5 Million Men and Women. J Am Coll Cardiol 2017; 70: 1429–37. [DOI] [PubMed] [Google Scholar]
- 21.Lassale C, Tzoulaki I, Moons KGM, et al. Separate and combined associations of obesity and metabolic health with coronary heart disease: a pan-European case-cohort analysis. Eur Heart J 2017. [DOI] [PMC free article] [PubMed] [Google Scholar]
- 22.Thomsen M, Nordestgaard BG. Myocardial infarction and ischemic heart disease in overweight and obesity with and without metabolic syndrome. JAMA Intern Med 2014; 174: 15–22. [DOI] [PubMed] [Google Scholar]
- 23.Arnlov J, Ingelsson E, Sundstrom J, Lind L. Impact of body mass index and the metabolic syndrome on the risk of cardiovascular disease and death in middle-aged men. Circulation 2010; 121: 230–6. [DOI] [PubMed] [Google Scholar]
- 24.Hinnouho GM, Czernichow S, Dugravot A, Nabi H, Brunner EJ, Kivimaki M, Singh-Manoux A. Metabolically healthy obesity and the risk of cardiovascular disease and type 2 diabetes: the Whitehall II cohort study. Eur Heart J 2015; 36: 551–9. [DOI] [PMC free article] [PubMed] [Google Scholar]
- 25.Aung K, Lorenzo C, Hinojosa MA, Haffner SM. Risk of developing diabetes and cardiovascular disease in metabolically unhealthy normal-weight and metabolically healthy obese individuals. J Clin Endocrinol Metab 2014; 99: 462–8. [DOI] [PMC free article] [PubMed] [Google Scholar]
- 26.Arnlov J, Sundstrom J, Ingelsson E, Lind L. Impact of BMI and the metabolic syndrome on the risk of diabetes in middle-aged men. Diabetes Care 2011; 34: 61–5. [DOI] [PMC free article] [PubMed] [Google Scholar]
- 27.Kaur A, Johnston DG, Godsland IF. Does metabolic health in overweight and obesity persist? - Individual variation and cardiovascular mortality over two decades. Eur J Endocrinol 2016; 175: 133–43. [DOI] [PubMed] [Google Scholar]
- 28.Hamer M, Stamatakis E. Metabolically healthy obesity and risk of all-cause and cardiovascular disease mortality. Journal of Clinical Endocrinology and Metabolism 2012; 97: 2482–8. [DOI] [PMC free article] [PubMed] [Google Scholar]
- 29.Calori G, Lattuada G, Piemonti L, et al. Prevalence, metabolic features, and prognosis of metabolically healthy obese Italian individuals: the Cremona Study. Diabetes Care 2011; 34: 210–5. [DOI] [PMC free article] [PubMed] [Google Scholar]
- 30.Bradshaw PT, Monda KL, Stevens J. Metabolic Syndrome in Healthy Obese, Overweight, and Normal Weight Individuals: The Atherosclerosis Risk in Communities Study. Obesity (Silver Spring) 2012. [DOI] [PMC free article] [PubMed] [Google Scholar]
- 31.Tomiyama AJ, Hunger JM, Nguyen-Cuu J, Wells C. Misclassification of cardiometabolic health when using body mass index categories in NHANES 2005–2012. Int J Obes (Lond) 2016; 40: 883–6. [DOI] [PubMed] [Google Scholar]
- 32.Wildman RP, Muntner P, Reynolds K, McGinn AP, Rajpathak S, Wylie-Rosett J, Sowers MR. The obese without cardiometabolic risk factor clustering and the normal weight with cardiometabolic risk factor clustering: prevalence and correlates of 2 phenotypes among the US population (NHANES 1999–2004). Arch Intern Med 2008; 168: 1617–24. [DOI] [PubMed] [Google Scholar]
- 33.Conus F, Allison DB, Rabasa-Lhoret R, St-Onge M, St-Pierre DH, Tremblay-Lebeau A, Poehlman ET. Metabolic and behavioral characteristics of metabolically obese but normal-weight women. Journal of Clinical Endocrinology and Metabolism 2004; 89: 5013–20. [DOI] [PubMed] [Google Scholar]
- 34.Primeau V, Coderre L, Karelis AD, et al. Characterizing the profile of obese patients who are metabolically healthy. Int J Obes (Lond) 2011; 35: 971–81. [DOI] [PubMed] [Google Scholar]
- 35.Ruderman NB, Schneider SH, Berchtold P. The “metabolically-obese,” normal-weight individual. Am J Clin Nutr 1981; 34: 1617–21. [DOI] [PubMed] [Google Scholar]
- 36.Sims EA. Characterization of the syndromes of obesity In: Brodoff BN, Bleicher SJ, eds, Diabetes Mellitus and Obesity. Baltimore, MD: Williams & Wilkins; 1982; 219–26. [Google Scholar]
- 37.Andres R Effect of obesity on total mortality. Int J Obes 1980; 4: 381–6. [PubMed] [Google Scholar]
- 38.Pataky Z, Makoundou V, Nilsson P, et al. Metabolic normality in overweight and obese subjects. Which parameters? Which risks? Int J Obes (Lond) 2011; 35: 1208–15. [DOI] [PubMed] [Google Scholar]
- 39.Bell JA, Hamer M, Batty GD, Singh-Manoux A, Sabia S, Kivimaki M. Incidence of Metabolic Risk Factors Among Healthy Obese Adults: 20-Year Follow-Up. J Am Coll Cardiol 2015; 66: 871–3. [DOI] [PMC free article] [PubMed] [Google Scholar]
- 40.Eckel N, Meidtner K, Kalle-Uhlmann T, Stefan N, Schulze MB. Metabolically healthy obesity and cardiovascular events: A systematic review and meta-analysis. Eur J Prev Cardiol 2016; 23: 956–66. [DOI] [PubMed] [Google Scholar]
- 41.Bell JA, Kivimaki M, Hamer M. Metabolically healthy obesity and risk of incident type 2 diabetes: a meta-analysis of prospective cohort studies. Obes Rev 2014; 15: 504–15. [DOI] [PMC free article] [PubMed] [Google Scholar]
- 42.Boonchaya-Anant P, Apovian CM. Metabolically Healthy Obesity-Does it Exist? Current atherosclerosis reports 2014; 16: 441. [DOI] [PubMed] [Google Scholar]
- 43.Stefan N, Haring HU, Hu FB, Schulze MB. Metabolically healthy obesity: epidemiology, mechanisms, and clinical implications. Lancet Diabetes Endocrinol 2013; 1: 152–62. [DOI] [PubMed] [Google Scholar]
- 44.Kim JY, van de Wall E, Laplante M, et al. Obesity-associated improvements in metabolic profile through expansion of adipose tissue. J Clin Invest 2007; 117: 2621–37. [DOI] [PMC free article] [PubMed] [Google Scholar]
- 45.Ye R, Scherer PE. Adiponectin, driver or passenger on the road to insulin sensitivity? Mol Metab 2013; 2: 133–41. [DOI] [PMC free article] [PubMed] [Google Scholar]
- 46.Kusminski CM, Holland WL, Sun K, et al. MitoNEET-driven alterations in adipocyte mitochondrial activity reveal a crucial adaptive process that preserves insulin sensitivity in obesity. Nat Med 2012; 18: 1539–49. [DOI] [PMC free article] [PubMed] [Google Scholar]
- 47.Sun K, Wernstedt Asterholm I, Kusminski CM, et al. Dichotomous effects of VEGF-A on adipose tissue dysfunction. Proc Natl Acad Sci U S A 2012; 109: 5874–9. [DOI] [PMC free article] [PubMed] [Google Scholar]
- 48.Michailidou Z, Turban S, Miller E, et al. Increased angiogenesis protects against adipose hypoxia and fibrosis in metabolic disease-resistant 11beta-hydroxysteroid dehydrogenase type 1 (HSD1)-deficient mice. J Biol Chem 2012; 287: 4188–97. [DOI] [PMC free article] [PubMed] [Google Scholar]
- 49.Robciuc MR, Kivela R, Williams IM, et al. VEGFB/VEGFR1-Induced Expansion of Adipose Vasculature Counteracts Obesity and Related Metabolic Complications. Cell Metab 2016; 23: 712–24. [DOI] [PMC free article] [PubMed] [Google Scholar]
- 50.Herman MA, Peroni OD, Villoria J, et al. A novel ChREBP isoform in adipose tissue regulates systemic glucose metabolism. Nature 2012; 484: 333–8. [DOI] [PMC free article] [PubMed] [Google Scholar]
- 51.Crewe C, An YA, Scherer PE. The ominous triad of adipose tissue dysfunction: inflammation, fibrosis, and impaired angiogenesis. J Clin Invest 2017; 127: 74–82. [DOI] [PMC free article] [PubMed] [Google Scholar]
- 52.Carobbio S, Pellegrinelli V, Vidal-Puig A. Adipose Tissue Function and Expandability as Determinants of Lipotoxicity and the Metabolic Syndrome. Adv Exp Med Biol 2017; 960: 161–96. [DOI] [PubMed] [Google Scholar]
- 53.Pellegrinelli V, Carobbio S, Vidal-Puig A. Adipose tissue plasticity: how fat depots respond differently to pathophysiological cues. Diabetologia 2016; 59: 1075–88. [DOI] [PMC free article] [PubMed] [Google Scholar]
- 54.Gavrilova O, Marcus-Samuels B, Graham D, et al. Surgical implantation of adipose tissue reverses diabetes in lipoatrophic mice. J Clin Invest 2000; 105: 271–8. [DOI] [PMC free article] [PubMed] [Google Scholar]
- 55.Sun K, Kusminski CM, Scherer PE. Adipose tissue remodeling and obesity. J Clin Invest 2011; 121: 2094–101. [DOI] [PMC free article] [PubMed] [Google Scholar]
- 56.Medina-Gomez G, Gray SL, Yetukuri L, et al. PPAR gamma 2 prevents lipotoxicity by controlling adipose tissue expandability and peripheral lipid metabolism. PLoS Genet 2007; 3: e64. [DOI] [PMC free article] [PubMed] [Google Scholar]
- 57.Vandanmagsar B, Youm YH, Ravussin A, et al. The NLRP3 inflammasome instigates obesity-induced inflammation and insulin resistance. Nat Med 2011; 17: 179–88. [DOI] [PMC free article] [PubMed] [Google Scholar]
- 58.Naukkarinen J, Heinonen S, Hakkarainen A, et al. Characterising metabolically healthy obesity in weight-discordant monozygotic twins. Diabetologia 2014; 57: 167–76. [DOI] [PubMed] [Google Scholar]
- 59.Fabbrini E, Yoshino J, Yoshino M, et al. Metabolically normal obese people are protected from adverse effects following weight gain. J Clin Invest 2015. [DOI] [PMC free article] [PubMed] [Google Scholar]
- 60.Qatanani M, Tan Y, Dobrin R, et al. Inverse regulation of inflammation and mitochondrial function in adipose tissue defines extreme insulin sensitivity in morbidly obese patients. Diabetes 2013; 62: 855–63. [DOI] [PMC free article] [PubMed] [Google Scholar]
- 61.McLaughlin T, Deng A, Yee G, et al. Inflammation in subcutaneous adipose tissue: relationship to adipose cell size. Diabetologia 2010; 53: 369–77. [DOI] [PMC free article] [PubMed] [Google Scholar]
- 62.Kloting N, Fasshauer M, Dietrich A, et al. Insulin-sensitive obesity. American journal of physiology Endocrinology and metabolism 2010; 299: E506–15. [DOI] [PubMed] [Google Scholar]
- 63.Doumatey AP, Bentley AR, Zhou J, Huang H, Adeyemo A, Rotimi CN. Paradoxical Hyperadiponectinemia is Associated With the Metabolically Healthy Obese (MHO) Phenotype in African Americans. J Endocrinol Metab 2012; 2: 51–65. [DOI] [PMC free article] [PubMed] [Google Scholar]
- 64.Farb MG, Bigornia S, Mott M, et al. Reduced adipose tissue inflammation represents an intermediate cardiometabolic phenotype in obesity. J Am Coll Cardiol 2011; 58: 232–7. [DOI] [PMC free article] [PubMed] [Google Scholar]
- 65.Pasarica M, Sereda OR, Redman LM, et al. Reduced adipose tissue oxygenation in human obesity: evidence for rarefaction, macrophage chemotaxis, and inflammation without an angiogenic response. Diabetes 2009; 58: 718–25. [DOI] [PMC free article] [PubMed] [Google Scholar]
- 66.Gealekman O, Guseva N, Hartigan C, et al. Depot-specific differences and insufficient subcutaneous adipose tissue angiogenesis in human obesity. Circulation 2011; 123: 186–94. [DOI] [PMC free article] [PubMed] [Google Scholar]
- 67.Fabbrini E, Cella M, McCartney SA, et al. Association between specific adipose tissue CD4+ T-cell populations and insulin resistance in obese individuals. Gastroenterology 2013; 145: 366–74 e1–3. [DOI] [PMC free article] [PubMed] [Google Scholar]
- 68.Stefan N, Kantartzis K, Machann J, et al. Identification and characterization of metabolically benign obesity in humans. Arch Intern Med 2008; 168: 1609–16. [DOI] [PubMed] [Google Scholar]
- 69.Visscher PM, Wray NR, Zhang Q, Sklar P, McCarthy MI, Brown MA, Yang J. 10 Years of GWAS Discovery: Biology, Function, and Translation. Am J Hum Genet 2017; 101: 5–22. [DOI] [PMC free article] [PubMed] [Google Scholar]
- 70.Burdett T, Hall PN, Hastings E, et al. The NHGRI-EBI Catalog of published genome-wide association studies. Available at: http://www.ebi.ac.uk/gwas 2018. [DOI] [PMC free article] [PubMed]
- 71.Loos RJ. The genetics of adiposity. Curr Opin Genet Dev 2018; 50: 86–95. [DOI] [PMC free article] [PubMed] [Google Scholar]
- 72.Turcot V, Lu Y, Highland HM, et al. Protein-altering variants associated with body mass index implicate pathways that control energy intake and expenditure in obesity. Nat Genet 2018; 50: 26–41. [DOI] [PMC free article] [PubMed] [Google Scholar]
- 73.Locke AE, Kahali B, Berndt SI, et al. Genetic studies of body mass index yield new insights for obesity biology. Nature 2015; 518: 197–206. [DOI] [PMC free article] [PubMed] [Google Scholar]
- 74.Akiyama M, Okada Y, Kanai M, et al. Genome-wide association study identifies 112 new loci for body mass index in the Japanese population. Nat Genet 2017; 49: 1458–67. [DOI] [PubMed] [Google Scholar]
- 75.Shungin D, Winkler TW, Croteau-Chonka DC, et al. New genetic loci link adipose and insulin biology to body fat distribution. Nature 2015; 518: 187–96. [DOI] [PMC free article] [PubMed] [Google Scholar]
- 76.Lu Y, Day FR, Gustafsson S, et al. New loci for body fat percentage reveal link between adiposity and cardiometabolic disease risk. Nature communications 2016; 7: 10495. [DOI] [PMC free article] [PubMed] [Google Scholar]
- 77.Kilpelainen TO, Zillikens MC, Stancakova A, et al. Genetic variation near IRS1 associates with reduced adiposity and an impaired metabolic profile. Nat Genet 2011; 43: 753–60. [DOI] [PMC free article] [PubMed] [Google Scholar]
- 78.Kilpelainen TO, Carli JF, Skowronski AA, et al. Genome-wide meta-analysis uncovers novel loci influencing circulating leptin levels. Nature communications 2016; 7: 10494. [DOI] [PMC free article] [PubMed] [Google Scholar]
- 79.Fox CS, Liu Y, White CC, et al. Genome-wide association for abdominal subcutaneous and visceral adipose reveals a novel locus for visceral fat in women. PLoS Genet 2012; 8: e1002695. [DOI] [PMC free article] [PubMed] [Google Scholar]
- 80.Sung YJ, Perusse L, Sarzynski MA, et al. Genome-wide association studies suggest sex-specific loci associated with abdominal and visceral fat. Int J Obes (Lond) 2016; 40: 662–74. [DOI] [PMC free article] [PubMed] [Google Scholar]
- 81.Chu AY, Deng X, Fisher VA, et al. Multiethnic genome-wide meta-analysis of ectopic fat depots identifies loci associated with adipocyte development and differentiation. Nat Genet 2017; 49: 125–30. [DOI] [PMC free article] [PubMed] [Google Scholar]
- 82.Scherag A, Dina C, Hinney A, et al. Two New Loci for Body-Weight Regulation Identified in a Joint Analysis of Genome-Wide Association Studies for Early-Onset Extreme Obesity in French and German Study Groups. PLoS Genet 2010; 6: e1000916. [DOI] [PMC free article] [PubMed] [Google Scholar]
- 83.Wheeler E, Huang N, Bochukova EG, et al. Genome-wide SNP and CNV analysis identifies common and low-frequency variants associated with severe early-onset obesity. Nat Genet 2013; 45: 513–7. [DOI] [PMC free article] [PubMed] [Google Scholar]
- 84.Meyre D, Delplanque J, Chevre JC, et al. Genome-wide association study for early-onset and morbid adult obesity identifies three new risk loci in European populations. Nat Genet 2009; 41: 157–9. [DOI] [PubMed] [Google Scholar]
- 85.Scott RA, Lagou V, Welch RP, et al. Large-scale association analyses identify new loci influencing glycemic traits and provide insight into the underlying biological pathways. Nat Genet 2012; 44: 991–1005. [DOI] [PMC free article] [PubMed] [Google Scholar]
- 86.Manning AK, Hivert MF, Scott RA, et al. A genome-wide approach accounting for body mass index identifies genetic variants influencing fasting glycemic traits and insulin resistance. Nat Genet 2012; 44: 659–69. [DOI] [PMC free article] [PubMed] [Google Scholar]
- 87.Willer CJ, Schmidt EM, Sengupta S, et al. Discovery and refinement of loci associated with lipid levels. Nat Genet 2013; 45: 1274–83. [DOI] [PMC free article] [PubMed] [Google Scholar]
- 88.Lange LA, Hu Y, Zhang H, et al. Whole-exome sequencing identifies rare and low-frequency coding variants associated with LDL cholesterol. Am J Hum Genet 2014; 94: 233–45. [DOI] [PMC free article] [PubMed] [Google Scholar]
- 89.Liu DJ, Peloso GM, Yu H, et al. Exome-wide association study of plasma lipids in >300,000 individuals. Nat Genet 2017; 49: 1758–66. [DOI] [PMC free article] [PubMed] [Google Scholar]
- 90.Wain LV, Vaez A, Jansen R, et al. Novel Blood Pressure Locus and Gene Discovery Using Genome-Wide Association Study and Expression Data Sets From Blood and the Kidney. Hypertension 2017. [DOI] [PMC free article] [PubMed] [Google Scholar]
- 91.Kraja AT, Cook JP, Warren HR, et al. New Blood Pressure-Associated Loci Identified in Meta-Analyses of 475 000 Individuals. Circulation Cardiovascular genetics 2017; 10. [DOI] [PMC free article] [PubMed] [Google Scholar]
- 92.Liu C, Kraja AT, Smith JA, et al. Meta-analysis identifies common and rare variants influencing blood pressure and overlapping with metabolic trait loci. Nat Genet 2016; 48: 1162–70. [DOI] [PMC free article] [PubMed] [Google Scholar]
- 93.Flannick J, Fuchsberger C, Mahajan A, et al. Sequence data and association statistics from 12,940 type 2 diabetes cases and controls. Scientific data 2017; 4: 170179. [DOI] [PMC free article] [PubMed] [Google Scholar]
- 94.Fuchsberger C, Flannick J, Teslovich TM, et al. The genetic architecture of type 2 diabetes. Nature 2016. [DOI] [PMC free article] [PubMed] [Google Scholar]
- 95.Araki E, Lipes MA, Patti ME, Bruning JC, Haag B, 3rd, Johnson RS, Kahn CR. Alternative pathway of insulin signalling in mice with targeted disruption of the IRS-1 gene. Nature 1994; 372: 186–90. [DOI] [PubMed] [Google Scholar]
- 96.Tamemoto H, Kadowaki T, Tobe K, et al. Insulin resistance and growth retardation in mice lacking insulin receptor substrate-1. Nature 1994; 372: 182–6. [DOI] [PubMed] [Google Scholar]
- 97.Miki H, Yamauchi T, Suzuki R, et al. Essential role of insulin receptor substrate 1 (IRS-1) and IRS-2 in adipocyte differentiation. Mol Cell Biol 2001; 21: 2521–32. [DOI] [PMC free article] [PubMed] [Google Scholar]
- 98.Tseng YH, Kriauciunas KM, Kokkotou E, Kahn CR. Differential roles of insulin receptor substrates in brown adipocyte differentiation. Mol Cell Biol 2004; 24: 1918–29. [DOI] [PMC free article] [PubMed] [Google Scholar]
- 99.Cariou B, Capitaine N, Le Marcis V, et al. Increased adipose tissue expression of Grb14 in several models of insulin resistance. FASEB J 2004; 18: 965–7. [DOI] [PubMed] [Google Scholar]
- 100.Cooney GJ, Lyons RJ, Crew AJ, et al. Improved glucose homeostasis and enhanced insulin signalling in Grb14-deficient mice. EMBO J 2004; 23: 582–93. [DOI] [PMC free article] [PubMed] [Google Scholar]
- 101.Jun G, Vardarajan BN, Buros J, et al. Comprehensive search for Alzheimer disease susceptibility loci in the APOE region. Arch Neurol 2012; 69: 1270–9. [DOI] [PMC free article] [PubMed] [Google Scholar]
- 102.Davies G, Harris SE, Reynolds CA, et al. A genome-wide association study implicates the APOE locus in nonpathological cognitive ageing. Mol Psychiatry 2014; 19: 76–87. [DOI] [PMC free article] [PubMed] [Google Scholar]
- 103.Deelen J, Beekman M, Uh HW, et al. Genome-wide association study identifies a single major locus contributing to survival into old age; the APOE locus revisited. Aging cell 2011; 10: 686–98. [DOI] [PMC free article] [PubMed] [Google Scholar]
- 104.Humphries AD, Streimann IC, Stojanovski D, Johnston AJ, Yano M, Hoogenraad NJ, Ryan MT. Dissection of the mitochondrial import and assembly pathway for human Tom40. J Biol Chem 2005; 280: 11535–43. [DOI] [PubMed] [Google Scholar]
- 105.Minster RL, al. e A thrifty variant in CREBRF strongly influences body mass index in Samoans. Nature Genetics 2016. [DOI] [PMC free article] [PubMed] [Google Scholar]
- 106.Minster RL, Hawley NL, Su CT, et al. A thrifty variant in CREBRF strongly influences body mass index in Samoans. Nat Genet 2016; 48: 1049–54. [DOI] [PMC free article] [PubMed] [Google Scholar]
- 107.Krishnan M, Major TJ, Topless RK, et al. Discordant association of the CREBRF rs373863828 A allele with increased BMI and protection from type 2 diabetes in Maori and Pacific (Polynesian) people living in Aotearoa/New Zealand. Diabetologia 2018. [DOI] [PMC free article] [PubMed] [Google Scholar]
- 108.Berry SD, Walker CG, Ly K, et al. Widespread prevalence of a CREBRF variant amongst Maori and Pacific children is associated with weight and height in early childhood. Int J Obes (Lond) 2017. [DOI] [PubMed] [Google Scholar]
- 109.Naka I, Furusawa T, Kimura R, et al. A missense variant, rs373863828-A (p.Arg457Gln), of CREBRF and body mass index in Oceanic populations. J Hum Genet 2017; 62: 847–9. [DOI] [PubMed] [Google Scholar]
- 110.Lek M, Karczewski KJ, Minikel EV, et al. Analysis of protein-coding genetic variation in 60,706 humans. Nature 2016; 536: 285–91. [DOI] [PMC free article] [PubMed] [Google Scholar]
- 111.Yaghootkar H, Scott RA, White CC, et al. Genetic evidence for a normal-weight “metabolically obese” phenotype linking insulin resistance, hypertension, coronary artery disease, and type 2 diabetes. Diabetes 2014; 63: 4369–77. [DOI] [PMC free article] [PubMed] [Google Scholar]
- 112.Yaghootkar H, Lotta LA, Tyrrell J, et al. Genetic Evidence for a Link Between Favorable Adiposity and Lower Risk of Type 2 Diabetes, Hypertension, and Heart Disease. Diabetes 2016; 65: 2448–60. [DOI] [PMC free article] [PubMed] [Google Scholar]
- 113.Scott RA, Fall T, Pasko D, et al. Common genetic variants highlight the role of insulin resistance and body fat distribution in type 2 diabetes, independent of obesity. Diabetes 2014; 63: 4378–87. [DOI] [PMC free article] [PubMed] [Google Scholar]
- 114.Lotta LA, Gulati P, Day FR, et al. Integrative genomic analysis implicates limited peripheral adipose storage capacity in the pathogenesis of human insulin resistance. Nat Genet 2017; 49: 17–26. [DOI] [PMC free article] [PubMed] [Google Scholar]
- 115.Heitmann BL, Frederiksen P, Lissner L. Hip circumference and cardiovascular morbidity and mortality in men and women. Obes Res 2004; 12: 482–7. [DOI] [PubMed] [Google Scholar]
- 116.Bigaard J, Frederiksen K, Tjonneland A, Thomsen BL, Overvad K, Heitmann BL, Sorensen TI. Waist and hip circumferences and all-cause mortality: usefulness of the waist-to-hip ratio? Int J Obes Relat Metab Disord 2004; 28: 741–7. [DOI] [PubMed] [Google Scholar]
- 117.Snijder MB, Dekker JM, Visser M, et al. Trunk fat and leg fat have independent and opposite associations with fasting and postload glucose levels: the Hoorn study. Diabetes Care 2004; 27: 372–7. [DOI] [PubMed] [Google Scholar]
- 118.Emdin CA, Khera AV, Natarajan P, Klarin D, Zekavat SM, Hsiao AJ, Kathiresan S. Genetic Association of Waist-to-Hip Ratio With Cardiometabolic Traits, Type 2 Diabetes, and Coronary Heart Disease. JAMA 2017; 317: 626–34. [DOI] [PMC free article] [PubMed] [Google Scholar]
- 119.Snijder MB, Dekker JM, Visser M, et al. Larger thigh and hip circumferences are associated with better glucose tolerance: the Hoorn study. Obes Res 2003; 11: 104–11. [DOI] [PubMed] [Google Scholar]
- 120.Choi SI, Chung D, Lim JS, Lee MY, Shin JY, Chung CH, Huh JH. Relationship between Regional Body Fat Distribution and Diabetes Mellitus: 2008 to 2010 Korean National Health and Nutrition Examination Surveys. Diabetes Metab J 2017; 41: 51–9. [DOI] [PMC free article] [PubMed] [Google Scholar]
- 121.Tatsukawa Y, Misumi M, Kim YM, et al. Body composition and development of diabetes: a 15-year follow-up study in a Japanese population. Eur J Clin Nutr 2018; 72: 374–80. [DOI] [PubMed] [Google Scholar]
- 122.Heid IM, Jackson AU, Randall JC, et al. Meta-analysis identifies 13 new loci associated with waist-hip ratio and reveals sexual dimorphism in the genetic basis of fat distribution. Nat Genet 2010; 42: 949–60. [DOI] [PMC free article] [PubMed] [Google Scholar]