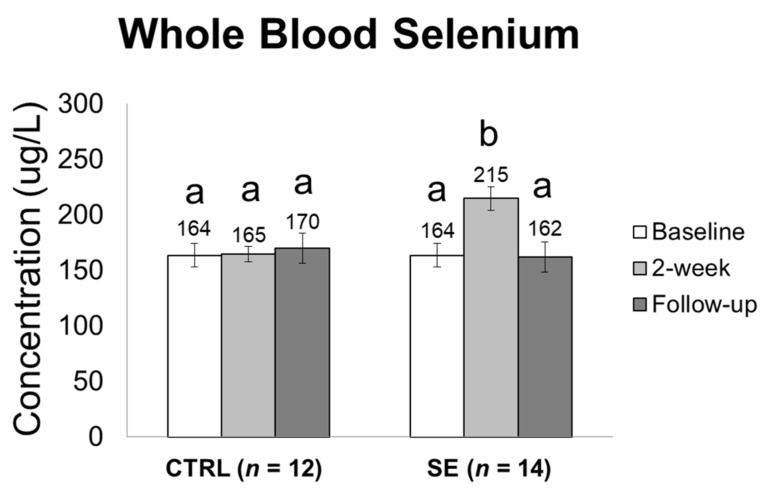
Figure 2.
Selenium concentration in whole blood. Values are presented as mean ± standard error. Statistical significance was determined by linear mixed-models analyses using time as a fixed effect and subjects as a random effect. Bonferroni corrected post-hoc analysis was reported by linear mixed model using time, group, and time × group as fixed effects and subjects as random effects. Bars with a and b denote statistically significant differences (p < 0.001) whereas the same letters mean no significant difference.

